| Oracle® Retail Xstore Point of Service Reports Guide Release 18.0 F10772-03 |
|

 Previous |
 Next |
This chapter contains information about the following reports:
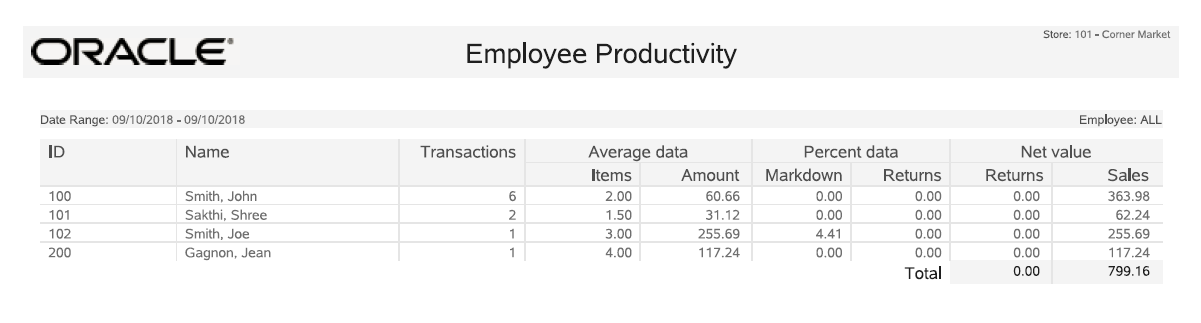
The Employee Productivity Report provides an analysis of each employee's sales results. To access the report in base, from the Back Office select the following menu buttons:
Navigate: Employee Maintenance and Payroll > Employee Maintenance > Employee Productivity Report.
For employees who are included in the report, the data includes the following:
Table 4-1 Employee Productivity Report Parameters
| Parameter | Description |
|---|---|
|
ID |
The employee's ID number. |
|
Name |
The employee's name. |
|
Transactions |
The total number of sales transactions for the employee. |
|
Average data |
Items: The average number of items included in a sale transaction for the employee. Amount: The average amount of the sale including all items in a transaction for the employee. |
|
Percent data |
Markdown: The percentage of the employee's net sales amount that was discounted for the employee. Returns: The percentage of the employee's net sales amount that was returned to the store for the employee. |
|
Net value: |
Returns: The total net amount of all return transactions for the employee. Sales: The total net amount of all sales transactions for the employee. |
The report may be restricted to a single employee or include all employees within the date range selected. A report total for all listed employees is also calculated.
Select an option or make entries in any of the following fields to determine report output:
Employee ID: Enter an employee ID to restrict the report data to a single employee. Otherwise all employees within the date range selected will be included.
Date Range: Enter a single fixed date, a date range (begin and end dates) or select a relative date option (Yesterday, Last Week, and so on) from the drop-down list.
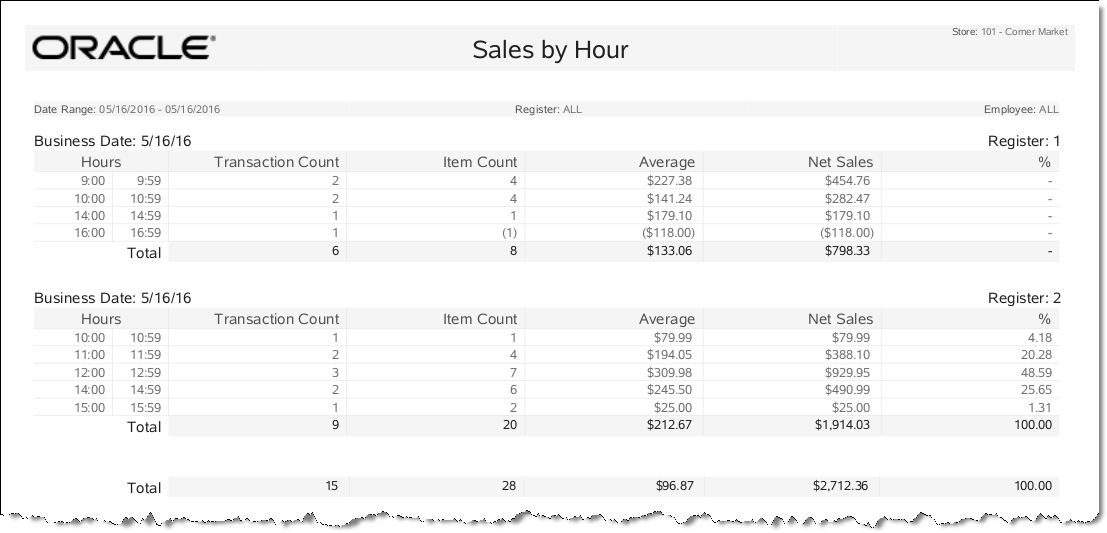
The Sales by Hour Report provides an hour-by-hour sales summary for the date range, registers, and sales associates specified. This is a summary report that produces one report line per hour of one day for a specified associate, or for all associates by register. If multiple days are specified, a summary by day is also provided. Calculations are performed for the number of transactions per hour, item count per hour, net sales amount per hour, average transaction amount per hour, and the percentage of the day's net sales earned during the hour. At the end of the report, after all records have been processed, the same calculations are performed for all dates included in the report.
The information includes the following:
Table 4-2 Sales by Hour Report
| Parameter | Description |
|---|---|
|
Hours |
The hours of the day with transactions. |
|
Transaction Count |
The number of transactions that occurred in each hourly group. |
|
Item Count |
The number of items sold in all qualifying transactions during each hourly group. |
|
Average |
The value of the net sales in an hourly period is divided by the number of transactions during the same period. |
|
Net Sales |
The quantity of each line item on a completed sales transaction is multiplied by the unit price of the item. This is done for every item that is sold during an hourly period. All of those amounts are totaled. |
|
% |
The monetary value of net sales in an hourly period is divided by the final total net sales for the entire report to calculate the percentage of the day's sales. |
Select an option or make entries in any of the following fields to determine report output:
Employee: Enter an employee's ID if you want to restrict the report to only one associate. Otherwise, all associates will be included.
Start Reg(ister): Enter the first register ID you want to include in the report.
End Reg(ister): Enter the last register ID you want to include in the report or enter the first register ID again if only one register will be included.
|
Note: The Start Reg and End Reg fields can be left empty to include all registers in the report. |
Date Range: Enter a single fixed date, a date range (begin and end dates) or select a relative date option (Yesterday, Last Week, and so on) from the drop-down list.
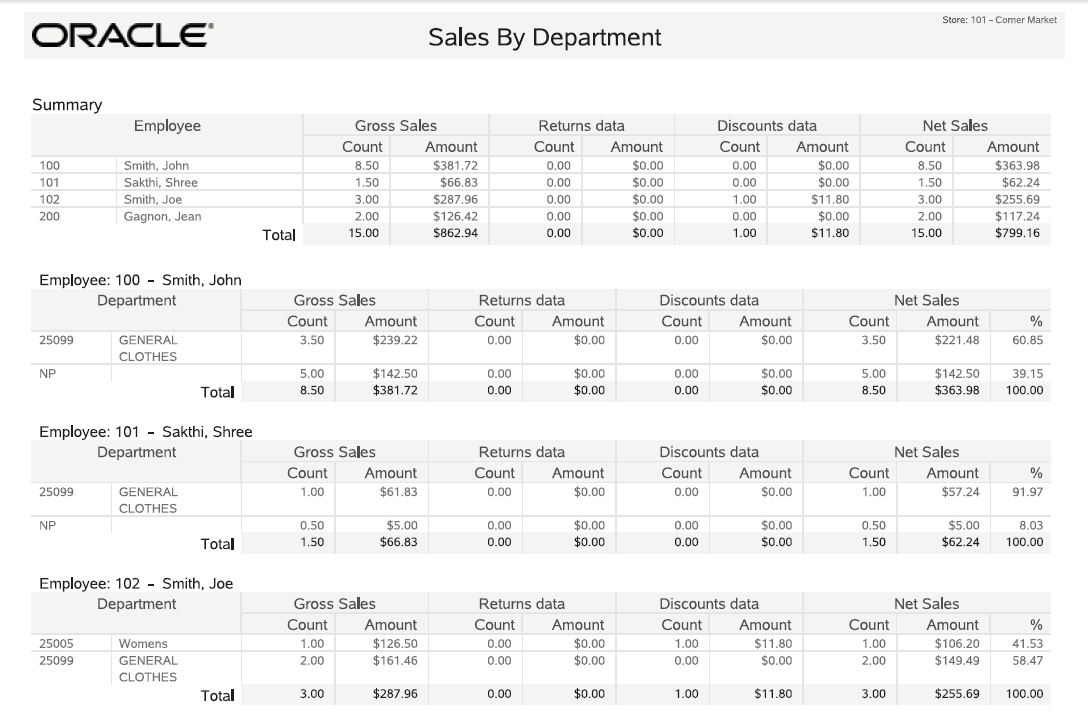
The Sales by Department Report summarizes sales-related information by department and includes both the quantity and amount for sales, returns, discounts and net sales. Each department's percentage of total sales is also provided.
Table 4-3 Sales by Department Report Parameters
| Parameter | Description |
|---|---|
|
Gross Sales |
Count - Total number of items by department. Amount - Total sales amount of items by department. Note: Due to the way some tax amounts are rounded, there are circumstances where the gross sales amount will not equal the total of all tender amounts collected. |
|
Returns data |
#Items - Total number of items returned by department. Amount - Total amount of all items returned by department. Report Totals - Final count of all items returned and the return amount for all departments, printed at the end of the report. |
|
Discounts data |
#Items - Total number of items discounted by department. Amount - Total amount of all items discounted by department. Report Totals - Final count of all discounted items and the discounted amount for all departments, printed at the end of the report. |
|
Net Sales |
#Items - Total number of items by department excluding returned items. Amount - Total amount of all sales by department after markdown (discounted) value is subtracted. Report Totals - Final count of all items sold and the net amount for all departments, printed at the end of the report. |
|
Dept % (Net) |
Percentage contributed by each department of the store's total net sales, expressed in decimal format (1.00). Report Totals - This number is always 1.00 and is the sum of all individual departments' percentages. |
Select an option or make entries in any of the following fields to determine report output:
Date Range: Enter a single fixed date, a date range (begin and end dates) or select a relative date option (Yesterday, Last Week, and so on) from the drop-down list.
Employee: Check box to include employee data.
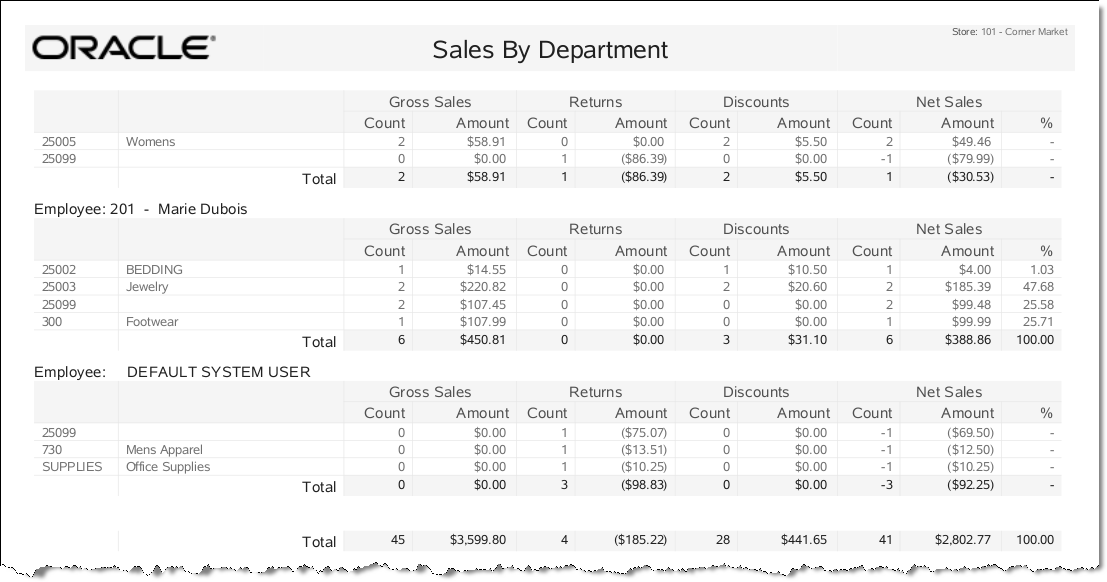
This report is similar to the Sales By Department Report, but it organizes the sales breakdown information per employee in every department in which the employee made a sale. For every employee selected for the report, the employee's gross sales, returns, markdowns and net sales are calculated and grouped by the department in which they occurred.
For example, if employee Tom Jones made sales in departments 100, 200 and 300, then Tom's amounts and quantities would be listed for sales, returns, discounts and net sales in only those three departments.
Table 4-4 Sales by Department and Employee Report Parameters
| Parameter | Description |
|---|---|
|
Gross Sales |
In each department where an employee had a transaction, the number of items sold is totaled and the gross amount is calculated. A total item count for all departments and the total gross amount for all departments are also calculated for each employee. Count - Total number of items by department. Amount - Gross sales amount of items by department. Report Totals - Final count of all items sold and the final gross sales amount for all departments, printed at the end of the report. Note: Due to the way some tax amounts are rounded, there are circumstances where the gross sales amount will not equal the total of all tender amounts collected. |
|
Returns |
In each department where an employee had a return, the number of items returned is totaled and the gross amount of the returns is calculated. A total returns count for all departments and the total gross amount for all returns in all departments are also calculated for each employee. Count - Total number of items returned by department. Amount - Total amount of all items returned by department. Report Totals - Final count of all items returned and the return amount for all departments, printed at the end of the report. |
|
Discounts |
In each department where an employee had a markdown, the number of items discounted is totaled and the gross amount for the markdowns is calculated. A total markdown count for all departments and the total gross amount for all markdowns in all departments are also calculated for each employee. Count - Total number of items discounted by department. Amount - Total amount of all items discounted by department. Amount - Total amount of all discounts applied to items in the department. Report Totals - Final count of all discounted items and the discounted amount for all departments, printed at the end of the report. |
|
Net Sales |
In each department where an employee had a transaction, the net sales amount is calculated by adjusting for returns and markdowns. A net item count for all departments is also calculated by adjusting for items that were returned. Count - Total number of items by department excluding returned items. Amount - Total amount of all sales by department after markdown (discounted) value is subtracted. Report Totals - Final count of all items sold and the net amount for all departments, printed at the end of the report. |
|
% (Net) |
A percentage of the department/employee's total net sales, expressed in decimal format (1.00). Report Totals - This number is always 1.00 and is the sum of all individual department percentages. |
Select an option or make entries in any of the following fields to determine report output:
Employee: Enter an Employee ID to restrict the information to a single employee.
Date Range: Enter a single fixed date, a date range (begin and end dates) or select a relative date option (Yesterday, Last Week, and so on) from the drop-down list.
The Sales by Hour Analysis Report shows an hour-by-hour sales amount for every day in the date range specified. The report can be restricted by employee, till, and register. The report also provides a net sales value and percentage of the week value for each hourly segment of each day.
Table 4-5 Sales by Hour Analysis Report Parameters
| Parameter | Description |
|---|---|
|
Hours |
The hourly period |
|
Total |
Each qualified transaction that occurs with an hourly period. |
|
Net Sales |
For each transaction that occurs in an hourly period, the quantity of each item in the transaction is multiplied by its unit cost to calculate the net sales amount. |
|
% |
The net sales amount for the hourly period is divided by the report total net sales amount to calculate the percentage of the day's sales that occurred in each hour, expressed in decimal format. |
|
Sun, Mon, Tue, Wed, Thu, Fri, Sat |
For each day of the week, tracks the net sales amount that is sold in that day |
Select an option or make entries in any of the following fields to determine report output:
Date Range: Select a date range from the drop-down list.
Employee: Restrict the report to sales for a specific employee by entering an employee ID in this field.
Till: Select a specific till from the list of tills on the drop-down list in this field.
Register: Restrict the report to sales for the employees who used a specific register.
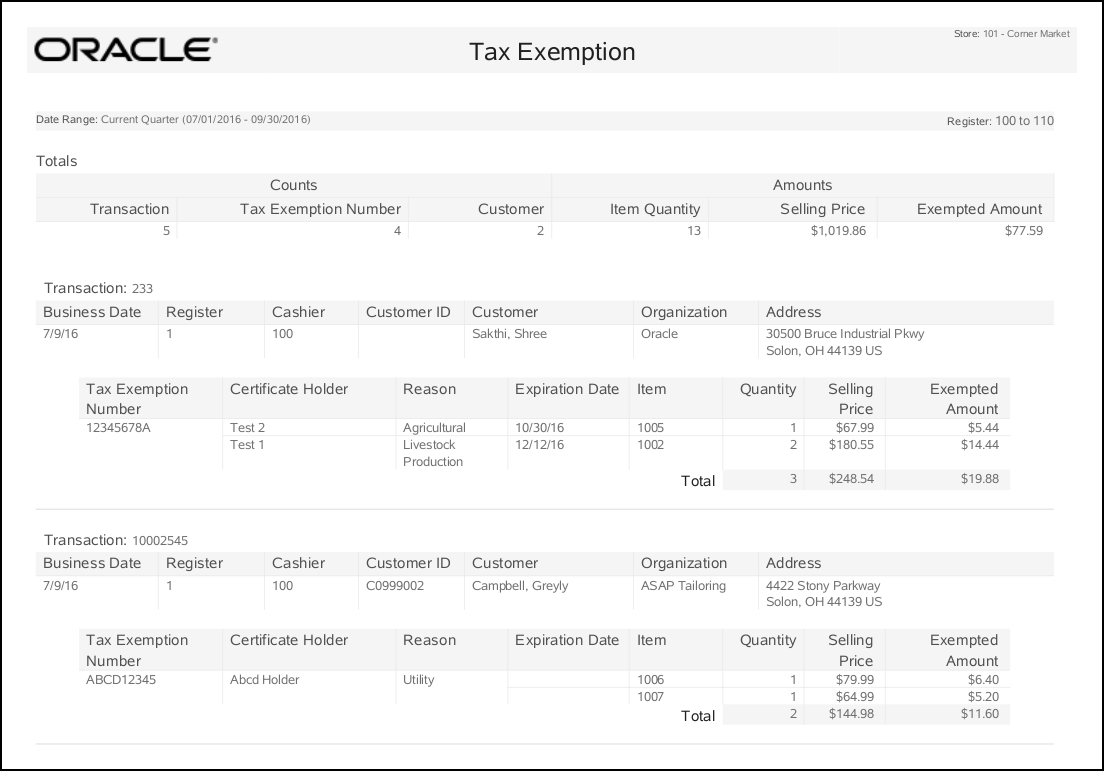
The Tax Exemption Report gives a customer-by-customer breakdown on transactions where a tax exemption was applied to a sale. For each transaction the report shows the date, exemption number, holder name, expiration date, reason code, and customer information. The report summarizes the total number of exemptions applied, total price of all items, and the total exempted amount for all tax exemptions on the report.
The data is grouped by transaction. If there is more than one tax exemption in a transaction, they will be grouped together. The outer table is transaction level, the inner table is exemption level. For the same exemption ID, Xstore allow users to have different certificate holders, reasons and expiration dates. They will be displayed when they are different.
Table 4-6 Tax Exemption Report Parameters
| Parameter | Description |
|---|---|
|
Totals |
|
|
Counts |
Transaction Tax Exemption Number Customer |
|
Amounts |
Item Quantity Selling Price Exempted Amount |
|
Transaction |
Date the transaction took place. |
|
Transaction Date |
Register where the transaction took place. |
|
Register |
Cashier who performed the transaction. |
|
Cashier |
Cashier who performed the transaction. |
|
Customer ID |
ID of the customer. |
|
Customer |
Customer name |
|
Organization |
The customer's organization. |
|
Address |
Customer address. |
|
Each Item Per Transaction |
|
|
Tax Exemption Number |
Customer's tax exemption number. |
|
Certificate Holder |
Owner of the tax exempt certificate |
|
Reason |
Reason code for the tax exemption. |
|
Expiration Date |
Date the tax exemption expires. |
|
Item |
The item identifier. |
|
Quantity |
Item quantity. |
|
Selling Price |
Item's selling price. |
|
Exempted Amount |
The item's exempted amount. |
Select an option or make entries in any of the following fields to determine report output:
Date Range: Enter a single fixed date, a date range (begin and end dates) or select a relative date option (Yesterday, Last Week, and so on) from the drop-down list.
Start Register: Enter the first register ID you want to include in the report.
End Register: Enter the last register ID you want to include for a range of registers or the same ID as the start register ID to restrict the report to a single register.
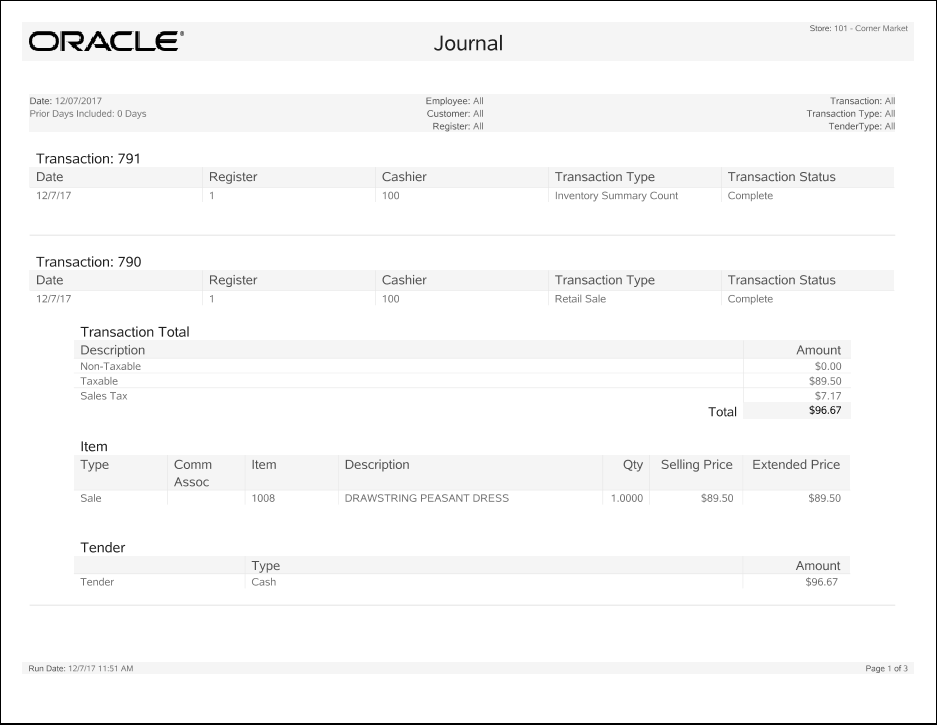
The Journal Report lists all register transactions that match the criteria you specify. The report includes all transaction categories and is not limited to retail sales transactions. The categories are shown below:
Account Lookup
Balance Inquiry
Bank Deposit
Batch Close
Credit Application
Escrow
Exchange Rate Maintenance
Inventory Control
Inventory Summary Count
Movement Pending
No Sale
Order
Post Void
Retail Sale
Sale Price Adjustments
Session Control
System Open/Close
Tender Control
Tender Exchange
Till Control
Time Clock
Training Mode Entry/Exit
Workstation Complete Remote Close
Workstation Open/Close
Workstation Start Remote Close
The report may be restricted by range of register IDs, transaction types, date range, employee ID, transaction number, customer ID, and tender type.
The data returned for the report will vary with the Category selected. Report information includes the Trans Type, Total, Customer ID, Register, Cashier, BusinessDate, TransId, Status, item detail, and tender detail, as applicable.
Select an option or make entries in the following fields to determine report output:
Date: Date on which to start the report. This field is only active when the selected Date Type is Specific Date.
Date Type (unlabeled): Select whether to use a Specific Date, Today, or Yesterday.
Prior Days Included: Select the number of days (0-6) to include in the report.
Start Reg: Enter a specific register ID, or the first register ID if you want to specify a range of registers. Leave blank to run the report for all registers.
End Reg: Enter the last register ID in the range of registers you want to specify or enter the start register ID again if the report will include only a single register.
Transaction Type: Select a transaction type from the drop-down list.
Employee ID: Enter an employee ID to restrict the report to a single employee. Leave blank to run the report for all employees.
Transaction: Enter a transaction ID to restrict the report a single transaction. Leave blank to run the report for all transactions.
Customer ID: Enter a customer ID (as recorded in Customer Maintenance) to restrict the report to a single customer. Leave blank to run the report for all customers.
Tender Type: Select a tender type from the list.
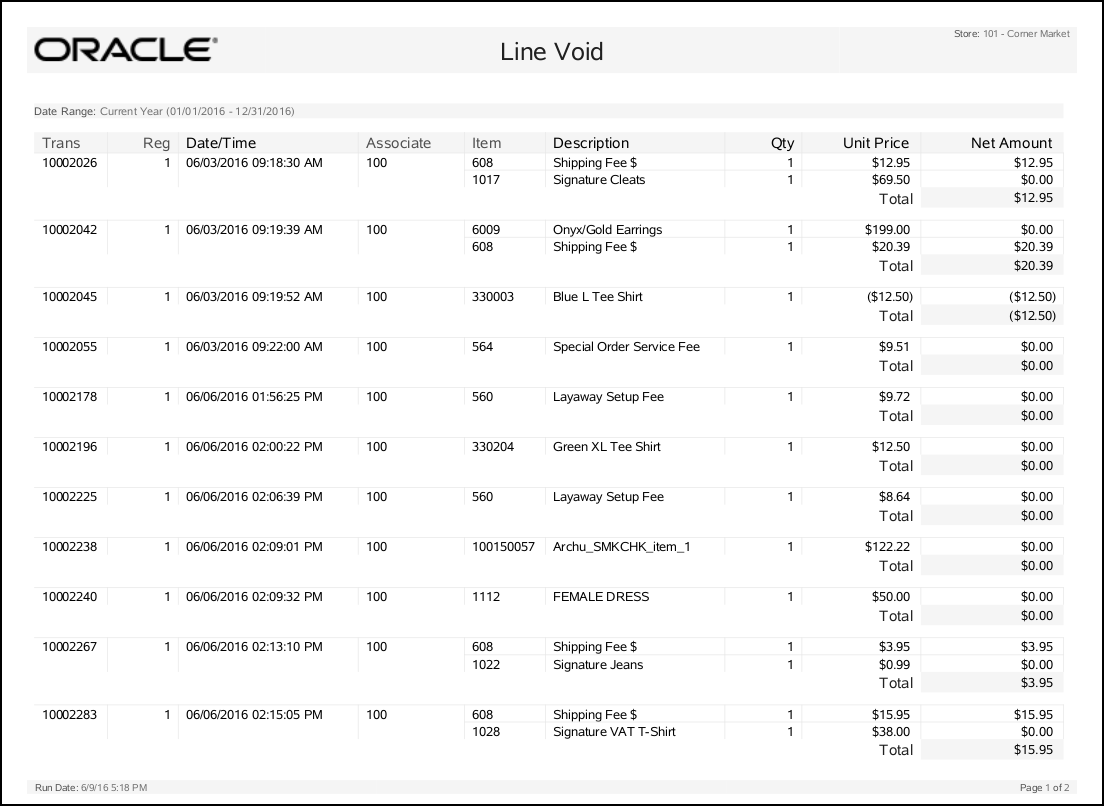
The Line Void Report lists transactions in which a line item was voided at the register. The transactions are listed in order by the transaction number, and the voided items are identified. The item ID, its description, price, and quantity are given. A total amount for all voided items on each transaction is also calculated.
Table 4-7 Line Void Report Parameters
| Parameter | Description |
|---|---|
|
Trans |
The identifier for the transaction. |
|
Reg |
The register where the transaction took place. |
|
Date/Time |
The date and time the transaction took place. |
|
Associate |
The cashier's identifier. |
|
Item |
The item identifier. |
|
Description |
The item description. |
|
Qty |
The item quantity. |
|
Unit Price |
The item price per unit. |
|
Net Amount |
The total net amount for the voided item. |
Select an option or make entries in any of the following fields to determine report output:
Date Range: Enter a single fixed date, a date range (begin and end dates) or select a relative date option (Yesterday, Last Week, and so on) from the drop-down list.
The Post Void Reports include transactions that were completed at the register but were later voided. These reports do not included cancelled sales transactions. For more information about cancelled transactions, see Transaction Cancel Reports.
The Summary Report lists voided transactions by transaction number, identifies the associate who performed the transaction and the register where it occurred, the date and time, the reason each transaction was voided, and gives the voided amount. A Total amount is also calculated at the end of report.
The Detail Report has additional information about the voided item, the quantity voided, unit cost and net amount voided. The Total amount is also calculated for each transaction.
Table 4-8 Post Void Reports Parameters
| Parameter | Description |
|---|---|
|
Summary |
|
|
Transaction |
The identifier for the transaction. |
|
Cashier |
The cashier's identifier. |
|
Register |
The register where the voiding transaction took place. |
|
Reason Code |
The reason code for the post void transaction. |
|
Transaction Time |
Date and time the transaction took place. |
|
Sub Total |
The subtotal of the transaction. |
|
Tax |
The tax amount of the transaction. |
|
Total |
The transaction total. |
|
Detail |
|
|
Transaction |
The transaction identifier. |
|
Cashier |
The cashier's identifier. |
|
Register |
The register where the voiding transaction took place. |
|
Reason Code |
The reason code for the post void transaction. |
|
Item |
The item identifier. |
|
Selling Price |
The item price per unit. |
|
Quantity |
The item quantity. |
|
Ext Price |
The net amount for the voided item. |
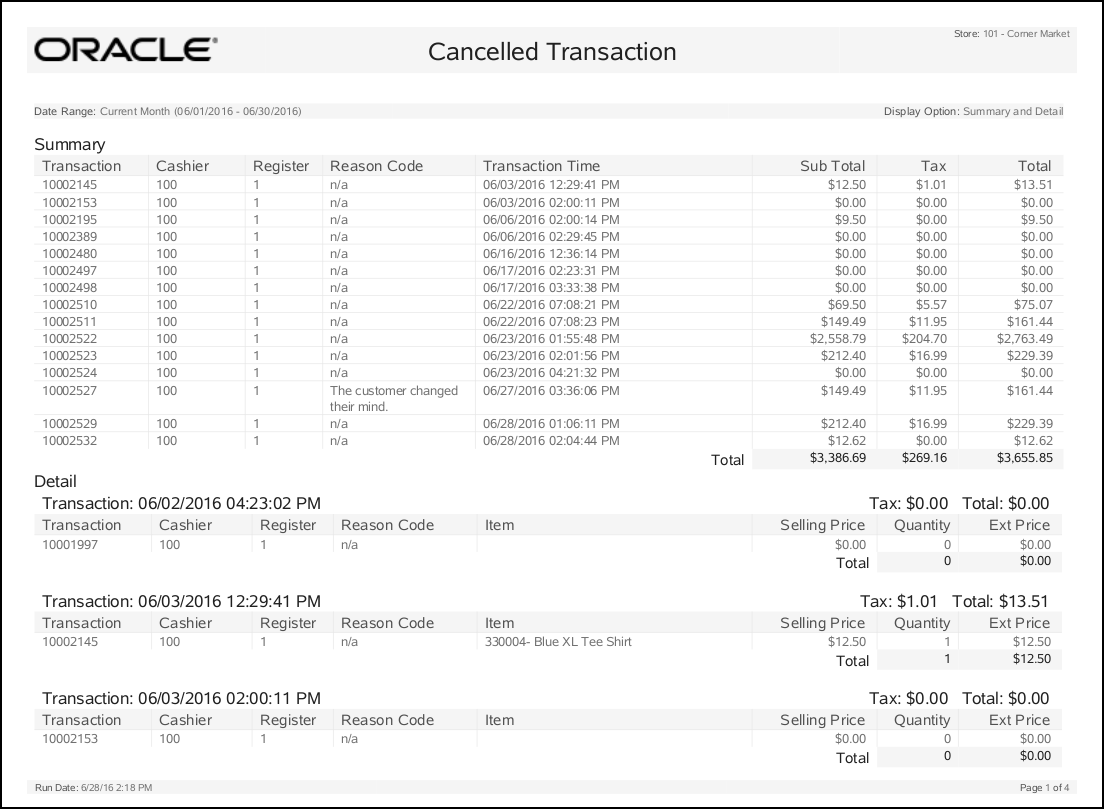
The Transaction Cancel Reports include transactions that were cancelled before completion at the register. These reports do not include post-voided transactions. For information on post- voided transactions see Post Void Reports.
The Transaction Cancel Summary Report lists transactions that were cancelled after entering at least one item. The report shows the reason for the cancellation (if available), the register number and associate's ID, the date and time that the cancellation occurred, and the amount on the ticket at the time it was cancelled.
The Transaction Cancel Detail Report provides the information that appears on the Summary Report, plus additional information about the items on the ticket such as the item description, unit price, quantity and net amount.
Table 4-9 Transaction Cancel Reports Parameters
| Parameter | Description |
|---|---|
|
Summary |
|
|
Transaction |
The identifier for the transaction. |
|
Cashier |
The cashier's identifier. |
|
Register |
The register where the transaction took place. |
|
Reason Code |
The reason code for the canceled transaction. |
|
Transaction Time |
The date and time the transaction took place. |
|
Sub Total |
The subtotal amount for all cancelled items on the transaction. |
|
Tax |
The tax amount for all cancelled items on the transaction. |
|
Total |
The total amount for all canceled items on the transaction. |
|
Detail |
|
|
Transaction |
The identifier for the transaction. |
|
Cashier |
The cashier's identifier. |
|
Register |
The register where the transaction took place. |
|
Reason Code |
The reason code for the canceled transaction. |
|
Item |
The item identifier. |
|
Selling Price |
The item price per unit. |
|
Quantity |
The item quantity. |
|
Ext Price |
The extended price for the cancelled item. |
Select an option or make entries in any of the following fields to determine report output:
Date Range: Enter a single fixed date, a date range (begin and end dates) or select a relative date option (Yesterday, Last Week, and so on) from the drop-down list.
The Price Override Report includes register sale transactions on which the price of one or more items was changed at the register. The report information is grouped by employee ID. Each line shows the transaction ID in which the price change occurred, the date and time of the transaction, the item ID with its description, and the reason for the price change. In addition, the original price and the changed price are shown and the difference is calculated.
Table 4-10 Price Override Report Parameters
| Parameter | Description |
|---|---|
|
By Employee ID |
|
|
Date |
The date the transaction took place. |
|
Time |
The time the transaction took place. |
|
Trans |
The identifier for the transaction. |
|
SKU |
The item identifier. |
|
Description |
The item description. |
|
Reason |
The reason for the item price override. |
|
Qty |
The number of items that have a price override. |
|
Price |
Regular Price: The price of the item before the price override was applied. Sold Price: The price of the item after the price override was applied. |
|
Difference |
The calculated price change between the regular price and the sold price. |
Select an option or make entries in any of the following fields to determine report output:
Date Range: Enter a single fixed date, a date range (begin and end dates) or select a relative date option (Yesterday, Last Week, and so on) from the drop-down list.
Start Employee: Enter the first employee ID to include in the report; if no employee ID is entered, all employees will be included.
End Employee: Enter the last employee ID to be included in the report if you want to specify a range of employees.
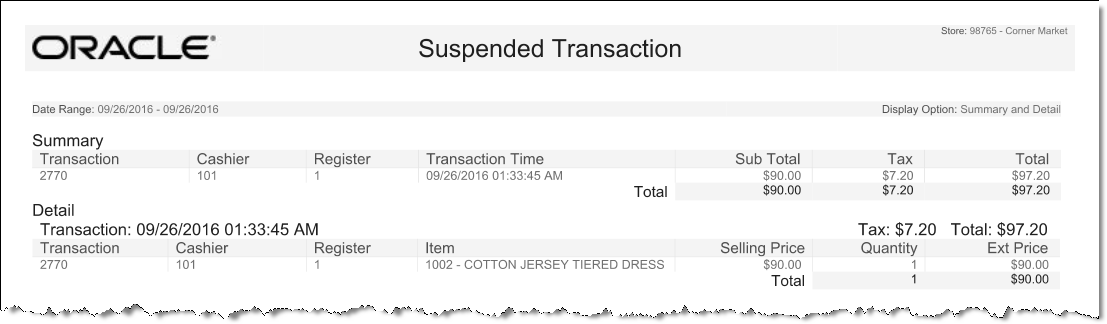
The Suspended Transaction Reports list transactions that have been temporarily placed on hold, including those that have been resumed and assigned a new transaction number. There are two Suspended Transaction Reports: a summary-level report and a detail-level report.
The summary-level report identifies the transaction numbers that were suspended, when the suspension occurred and the amount on the transaction. A Total amount is calculated at the end of the report. No item-level information is provided on this report.
The detail-level report provides all of the information found on the summary report. It also lists suspended transactions in transaction number order. Each item ID within the transaction is listed with its description, unit price, quantity and net amount.
Table 4-11 Suspended Transaction Reports Parameters
| Parameter | Description |
|---|---|
|
Summary |
|
|
Transaction |
The identifier for the transaction. |
|
Cashier |
The cashier's identifier. |
|
Register |
The register where the transaction took place. |
|
Transaction Time |
The date and time the transaction took place. |
|
Sub Total |
Subtotal for the transaction. |
|
Tax |
Tax applied to the transaction. |
|
Total |
Total amount of the transaction. |
|
Detail |
|
|
Transaction |
The identifier for the transaction. |
|
Cashier |
The cashier's identifier. |
|
Register |
The register where the transaction took place. |
|
Item |
The item identifier and description. |
|
Selling Price |
The item price per unit. |
|
Quantity |
The item quantity. |
|
Ext. Price |
The extended price for the suspended item. |
Select an option or make entries in any of the following fields to determine report output:
Date Range: Enter a single fixed date, a date range (begin and end dates) or select a relative date option (Yesterday, Last Week, and so on) from the drop-down list.
Type: Summary or detail.
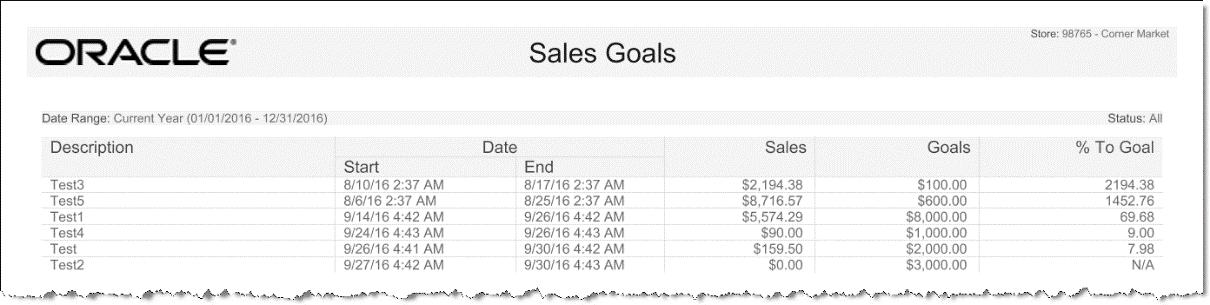
The Sales Goals report lists the sales goals for the store and the overall progress toward each goal. All calculations for the sales goals are based on net sales. If the status of All is selected, the sales goals will be grouped by status as follows: Completed, Active, then Future. Within each status, the goals are sorted by Ascending End Date, Ascending Effective Date, and then Description.
Table 4-12 Sales Goals Report Parameters
| Parameter | Description |
|---|---|
|
Description |
The sales goal description. |
|
Date |
Start: The date the goal begins. End: The date the goal ends. |
|
Sales |
Sales goal progress. This is calculated using net sales data for the period. Note: Future goals display "N/A". |
|
Goals |
The sales goal value. |
|
% To Goal |
The goal status as a percentage to the target. Note: Future goals display "N/A". |
Select an option or make entries in any of the following fields to determine report output:
Status: Select a sales goal status from the list to limit the report data returned, or keep the default status of All, to list all status types.
Active: Today's date is within the Effective Date and End Date range
Completed: Today's date is greater than the End Date.
Completed-Met: Today's date is greater than the End Date AND % to Goal is greater than or equal to 100.
Completed-Not Met: Today's date is greater than the End Date AND % to Goal is less than 100.
Future: Today's date is less than the Effective Date.
Date Range: Enter a single fixed date, a date range (begin and end dates) or select a relative date option (Yesterday, Last Week, and so on) from the drop-down list.
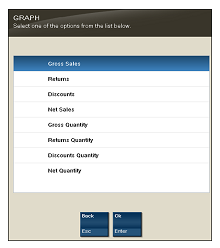
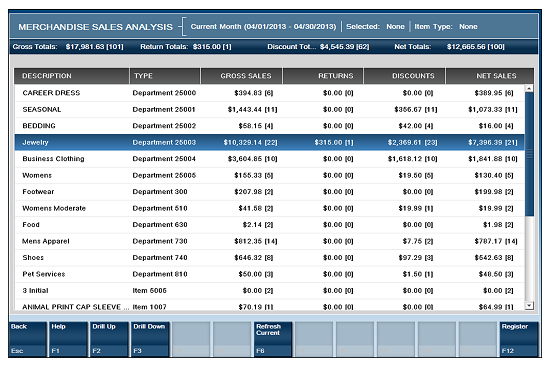
The Merchandise Sales Analysis report displays item merchandise hierarchy sales information. You may choose to drill-down into merchandise hierarchy levels to the item level by selecting a row and then selecting Drill Down. To return to the list select Drill Up. You can also sort by selecting a column name. Select Graph to create a pie chart.
|
Note: Touch-screen users tap the row or column to drill down or sort.Swipe down anywhere on a column (for example, Returns) to display a pie chart of totals (instead of selecting the Graph menu button). 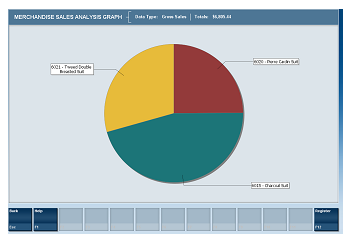
Swipe up anywhere on a column to display a pie chart of quantities. 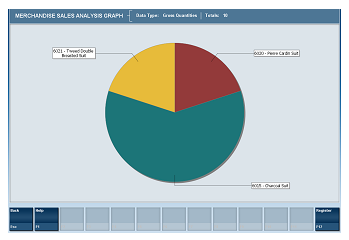
The parenthesis contains the number of items.  |
Table 4-13 Merchandise Sales Analysis Parameters
| Parameters | Description |
|---|---|
|
Gross Totals |
Amount of all items sold. |
|
Return Totals |
Amount of all returns. |
|
Discount Totals |
Amount of all discounts. |
|
Net Totals |
Net amount of all sales. |
|
Description |
The item description. |
|
Type |
The department or item number. |
|
Gross Sales |
Total sales amount by item. |
|
Returns |
Total amount of the item returned. |
|
Discounts |
Total amount of the item discounted. |
|
Net Sales |
The total net amount of all sales transactions for the item. |
Select an option or make entries in any of the following fields to determine report output:
Date Range: Enter a single fixed date, a date range (begin and end dates) or select a relative date option (Yesterday, Last Week, and so on) from the drop-down list.
|
Note: Select the Refresh Current button to update the report with current data. |