31 Working with Systems Infrastructure Targets
This chapter describes the Oracle Enterprise Manager Systems Infrastructure plug-in. This chapter covers the following:
31.1 Overview of Enterprise Manager Systems Infrastructure
A host is a computer where managed databases and other services reside. A host is one of many components or targets that Oracle Enterprise Manager Cloud Control monitors. Oracle Enterprise Manager Cloud Control is an enterprise-level data center management solution for the Oracle product stack, from applications to storage disks, as shown in Figure 31-1.
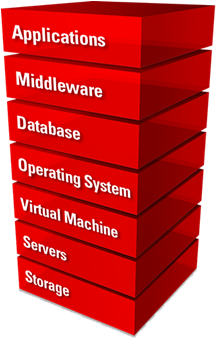
The Enterprise Manager Systems Infrastructure (EMSI) plug-in is a fully integrated software plug-in that provides monitoring and an enterprise-wide view the bottom half of the stack, including Oracle Solaris and Linux operating systems, virtualized operating systems (zones) and virtual machines (logical domains), servers, storage appliances, storage for a host, and network resources.
The Oracle Enterprise Manager Cloud Control console interface provides detailed information about managed components and shows the relationship between the components. You can drill down to view greater details about specific components or metrics.
For server targets, you can view server details, including power usage, network information, service processor configuration, and fan and temperature information. Other hardware targets include chassis, racks, power distribution units, and network equipment. You can view the storage resources and their components for a host or a storage appliance, including storage pools, storage hardware, filesystems, logical volumes, and Logical Units (LUNs).
For Oracle Solaris and Linux operating system targets, you can view resource and process information, top consumers, performance, and open incidents details. In addition, you can view details about Oracle Solaris alternate boot environments and zones.
When you use Oracle VM Server for SPARC to virtualize hardware or Oracle Solaris to virtualize operating systems, the details appear on virtualization platform pages. Virtualization platform pages provide high-level details such as overall guest, CPU and memory, incident, and configuration information. You can drill down to individual virtual server pages to view metrics specific to a selected logical domain or zone.
The Enterprise Manager Systems Infrastructure also provides a view of Oracle SuperCluster engineered systems. Oracle SuperCluster integrates SPARC compute nodes, an Oracle ZFS Storage Appliance, InfiniBand switches, PDUs, and Exadata Storage Servers into a multi-rack system. You can view all of the components of an Oracle SuperCluster including Compute Nodes, Exadata Storage Servers, InfiniBand Switches, Power Distribution Units, and ZFS Storage Servers. You can expand the Compute Nodes to view the logical domains and zones.
31.1.1 About Monitoring for the Systems Infrastructure Targets
A series of monitoring rules and parameters monitor your managed targets. Alerts and incidents are raised for resources that are not performing as expected.
Each target has a dashboard that displays details based on the target type. All dashboards show the number of warning, critical, and fatal open incidents with links that enable you to drill down to the Incident Manager for the specific incident.
A Management Agent deployed on the host gathers information and keeps track of activity, status, performance and the health of the targets. You can view metrics for the following discovered Oracle target types:
-
Servers
-
Storage servers
-
Networks
-
Racks and power distribution units (PDUs)
-
Oracle Solaris and Linux operating systems
-
Oracle Solaris Zones
-
Oracle VM Server for SPARC and logical domains
-
Oracle SuperCluster engineered systems
31.1.2 About Dynamic Views for the Systems Infrastructure Targets
Depending on the type of target, a target home page might include graphs, charts and tables to provide greater detail at a glance. The home pages of more complex targets include dynamic photorealistic views and relationship charts. In some cases, you can interact with the images to better understand how hardware is deployed and how resources are utilized.
The following charts and views enable you to assess a target quickly and determine the relationships at a glance:
-
Relationship Chart: Displays how resources are allocated among guests. For example, the Systems Infrastructure Virtualization Platform page of an Oracle VM Server for SPARC includes a Core Distribution tab that displays the vCPU and core allocation. The chart contains concentric circles with segments that display which CPUs and cores are allocated to which guests, and which CPUs and cores are not allocated. You can click a guest in the outer ring to view detailed information about that guest's resource consumption.
-
Photorealistic View: Displays the components and ports of a hardware target, and if there are open incidents. For example, the Oracle SuperCluster engineered system monitoring pages provide a photorealistic view, which enables you to see how the system is laid out in the rack. All active targets in the system appear in the image. You can view greater detail by hovering your mouse over a target in the image. When a component of the engineered system has an open incident, the component appears in the image with a red border.
-
Schematic View: Displays a symbolic view that displays the labels of an engineered system's components. At a glance, you can see the LED status (up, down, or blackout) and temperature of the server, ZFS Storage Appliance Server, InfiniBand Switch, and PDU in the engineered system.
31.2 Overview of the Systems Infrastructure User Interface
Information gathered by the Systems Infrastructure plug-in appears in an updated user interface. Each target home page is slightly different, depending on the type of target and whether the target utilizes Oracle VM Server for SPARC or Oracle Solaris Zones virtualization technology.
Open incidents, resource utilization and metrics for a target appear in a dashboard, helping you to maintain high availability and optimized performance. Tabs in the user interface contain more detailed metric information. Information appears in graphs, tables, charts, and schematic, and photorealistic views to help you to quickly understand the status and relationships between components.
31.2.1 About the Target Home Page
The home page enables you to quickly view the status, identify potential resource issues, and view the service request and configuration history of a specific target. From this page, you can drill down to specifics for an open incident, view detailed metrics, and guest details.
You can access the home pages from the All Targets menu. Each home page includes a dashboard across the top. Greater details and historic graphs are available in the tabs on the right side of the page.
The dashboard is designed to display an overview of important information and information that you might want to monitor closely. The information appears in a series of sections, called dashlets. At least four dashlets appear in the dashboard. The target type determines the number of dashlets and the content. Click the small button below the row of dashlets to toggle to the next series of dashlets. Below the navigation buttons is a single button that gives you the option to minimize the dashboard.
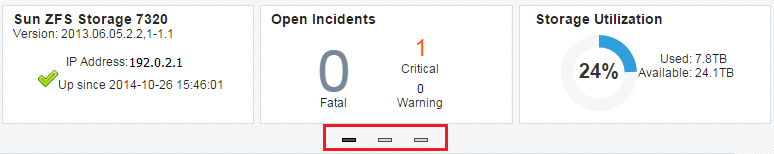
Figure 31-2 is an example of the first three dashlets on an Oracle ZFS Storage Server target home page. This example shows target type and date the page was last refreshed. The first dashlet contains target details, the second dashlet shows the number of open incidents and the severity level. The third dashlet shows the amount of space used and available for this target. One or more buttons appears beneath the Open Incidents dashlet, as indicated by the red box. Click a button to navigate to the next series of dashlets.
While the content will differ, each home page provides a consolidated view of the status, resource utilization, and metrics for the target. The following are some of the details that appear in dashlets:
-
Target details, such as the name and status of the selected target, appears in the first dashlet.
-
Incident information appears in the second dashlet. The number of Critical, Warning and Informational incidents that are currently open appear in this dashlet. Each number is a link to greater detail.
-
Resource usage, top statistics, and metrics information specific to the target type appears in one or more dashlets.
-
The number of service requests for the selected target that were filed with Oracle in the past 30 days and the past 5 days appears in a dashlet.
-
Last configuration change and last reported incident time appear in the last dashlet.
In some cases, you can click content in a dashlet to drill down to get more information. For example, the Open Incidents dashlet links to more detailed information. When you click a number next to the type of incident, the dashboard flips and shows a table of incidents with the target name, a synopsis, and additional information depending on the type of incident. You can drill down further to navigate to the Incident Manager for the highest level of detail.
See About the Virtualization Home Page and About the Oracle Engineered Systems Home Page for some differences in the home pages for these types of targets.
31.2.2 About the Virtualization Home Page
When you are using the Oracle VM Server for SPARC or Oracle Solaris Zone virtualization technology, the target home pages are different.
The following are the target home pages for virtualization:
-
Virtualization Platform page
-
Virtual Server page
The Virtualization Platform page is the home page for the Control Domain or for the Global Zone. The Virtualization Platform page has a Target Navigation icon in the upper left corner that contains links to the Virtual Server home page for each associated logical domain or zone.
For zones and logical domains, the number of incidents that appear on the Virtualization Platform page includes incidents for all associated zones and domains. For example, the control domain and all associated logical domains.
31.2.3 About the Oracle Engineered Systems Home Page
For Oracle SuperCluster engineered systems, you can monitor the components of the engineered system from the target's home page. The monitoring pages provide a photorealistic view and a schematic view of the engineered system. The photorealistic view is helpful in seeing how the system is physically laid out in the rack. You can hover over the image to view details about the components. The schematic view displays the component labels and LED status.
31.3 Creating Roles for Systems Infrastructure Administration
The Systems Infrastructure plug-in does not define its own roles for access controls. To manage the plug-in, you must create roles and administrators, and then assign roles to administrators. The roles restrict a user's privileges.
Note:
For security reasons, Oracle recommends that the SYSMAN account be used only as a template to create other accounts, and not used directly.To create roles to provide management rights to users:
-
Log in to the Enterprise Manager Cloud Control as the super administrator user.
-
Click Setup, then Security.
-
Select Roles.
On the Security page, a list of predefined roles is provided. These roles can serve as basis to define custom roles to suite specific site level requirements.
Note:
The predefined roles provided cannot be edited or deleted. -
Select a role that closely matches the role you wish to create. Click Create Like.
-
On the Properties page, enter a name for the new role. You can optionally add a description. Click Next.
-
On the Roles page, select the roles from the list of Available Roles. Click Move to add the role to Selected Roles. Click Next.
-
On the Target Privileges page, select the privilege you want to grant to the new role. Click Next.
-
On the Resource Privileges page, you can edit specific privileges to be explicitly granted. Click the Manage Privilege Grant edit icon to make the changes. Click Next.
-
On the Administrators page, select the administrators from the list of Available Administrators that you want to grant the new role to. Click Move to add the administrator to Selected Administrators. Click Next.
-
On the Review page, a complete summary of the new role you have created is displayed. Click Back to go to previous screens to make changes. Click Finish to complete the role creation.
When the newly created administrator logs in, unlike SYSMAN, the administrator is restricted by the privileges set.
31.4 Related Resources for Systems Infrastructure Targets
See the following for more information: