1 Enterprise Monitoring
This chapter covers the following topics:
1.1 Monitoring Overview
Enterprise Manager Cloud Control monitoring functionality permits unattended monitoring of your IT environment. Enterprise Manager comes with a comprehensive set of performance and health metrics that allows monitoring of key components in your environment, such as applications, application servers, databases, as well as the back-end components on which they rely (such as hosts, operating systems, storage).
The Management Agent on each monitored host monitors the status, health, and performance of all managed components (targets) on that host. If a target goes down, or if a performance metric crosses a warning or critical threshold, an event is triggered and sent to Enterprise Manager. Administrators or any interested party can be notified of the triggered event through the Enterprise Manager notification system.
Adding targets to monitor is simple. Enterprise Manager provides you with the option of either adding targets manually or automatically discovering all targets on a host. Enterprise Manager can also automatically and intelligently apply monitoring settings for newly added targets. For more information, see Section 1.4.2, "Administration Groups and Template Collections"). While Enterprise Manager provides a comprehensive set of metrics used for monitoring, you can also use metric extensions (see Section 1.3.6, "Metric Extensions: Customizing Monitoring") to monitor conditions that are specific to your environment. As your data center grows, it will become more challenging to manage individual targets separately, thus you can use Enterprise Manager's group management functionality to organize large sets of targets into groups, allowing you to monitor and manage many targets as one.
1.2 Comprehensive Out-of-Box Monitoring
Monitoring begins as soon as you install Enterprise Manager Cloud Control 12c. Enterprise Manager's Management Agents automatically start monitoring their host's systems (including hardware and software configuration data on these hosts) as soon as they are deployed and started. Enterprise Manager provides auto-discovery scripts that enable these Agents to automatically discover all Oracle components and start monitoring them using a comprehensive set of metrics at Oracle-recommended thresholds.
This monitoring functionality includes other components of the Oracle ecosystem such as NetApp Filer, BIG-IP load balancers, Checkpoint Firewall, and IBM WebSphere. Metrics from all monitored components are stored and aggregated in the Management Repository, providing administrators with a rich source of diagnostic information and trend analysis data. When critical alerts are detected, notifications are sent to administrators for rapid resolution.
Out-of-box, Enterprise Manager monitoring functionality provides:
-
In-depth monitoring with Oracle-recommended metrics and thresholds.
-
Monitoring of all components of your IT infrastructure (Oracle and non-Oracle) as well as the applications and services that are running on them.
-
Access to real-time performance charts.
-
Collection, storage, and aggregation of metric data in the Management Repository. This allows you to perform strategic tasks such as trend analysis and reporting.
-
E-mail and pager notifications for detected critical events.
Enterprise Manager can monitor a wide variety of components (such as databases, hosts, and routers) within your IT infrastructure.
Some examples of monitored metrics are:
-
Archive Area Used (Database)
-
Component Memory Usage (Application Server)
-
Segments Approaching Maximum Extents Count (Database)
-
Network Interface Total I/O Rate (Host)
Monitoring Without Management Agents
When it is not practical to have a Management Agent present to monitor specific components of your IT infrastructure, as might be the case with an IP traffic controller or remote Web application, Enterprise Manager provides Extended Network and Critical URL Monitoring functionality. This feature allows the Beacon functionality of the Agent to monitor remote network devices and URLs for availability and responsiveness without requiring an Agent to be physically present on that device. You simply select a specific Beacon, and add key network components and URLs to the Network and URL Watch Lists. Enterprise Manager monitoring concepts and the underlying subsystems that support this functionality are discussed in the following sections.
1.3 Monitoring: Basics
Enterprise Manager Cloud Control 13c comes with a comprehensive set of predefined performance and health metrics that enables automated monitoring of key components in your environment, such as applications, application servers, databases, as well as the back-end components on which they rely, such as hosts, operating systems, storage. While Enterprise Manager can monitor for many types of conditions (events), the most common use of its monitoring capability centers around the basics of monitoring for violation of acceptable performance boundaries defined by metric values. The following sections discuss the basic concepts and Enterprise Manger functionality that supports monitoring of targets.
1.3.1 Metric Thresholds: Determining When a Monitored Condition is an Issue
Some metrics have associated predefined limiting parameters called thresholds that cause metric alerts (specific type of event) to be triggered when collected metric values exceed these limits. Enterprise Manager allows you to set metric threshold values for two levels of alert severity:
-
Warning - Attention is required in a particular area, but the area is still functional.
-
Critical - Immediate action is required in a particular area. The area is either not functional or indicative of imminent problems.
Hence, thresholds are boundary values against which monitored metric values are compared. For example, for each disk device associated with the Disk Utilization (%) metric, you might define a warning threshold at 80% disk space used and critical threshold at 95%.
Note:
Not all metrics need a threshold: If the values do not make sense, or are not needed in a particular environment, they can be removed or simply not set.While the out-of-box predefined metric threshold values will work for most monitoring conditions, your environment may require that you customize threshold values to more accurately reflect the operational norms of your environment. Setting accurate threshold values, however, may be more challenging for certain categories of metrics such as performance metrics.
For example, what are appropriate warning and critical thresholds for the Response Time Per Transaction database metric? For such metrics, it might make more sense to be alerted when the monitored values for the performance metric deviates from normal behavior. Enterprise Manager provides features to enable you to capture normal performance behavior for a target and determine thresholds that are deviations from that performance norm.
Note:
Enterprise Manager administrators must be granted Manage Target Metrics or greater privilege on a target in order to perform any metric threshold changes.1.3.2 Metric Baselines: Determining Valid Metric Thresholds
Determining what metric threshold values accurately reflect the performance monitoring needs of your environment is not trivial. Rather than relying on trial and error to determine the correct values, Enterprise Manager provides metric baselines. Metric baselines are well-defined time intervals (baseline periods) over which Enterprise Manager has captured system performance metrics, creating statistical characterizations of system performance over specific time periods. This historical data greatly simplifies the task of determining valid metric threshold values by providing normalized views of system performance. Baseline normalized views of metric behavior help administrators explain and understand event occurrences.
The underlying assumption of metric baselines is that systems with relatively stable performance should exhibit similar metric observations (values) over times of comparable workload. Two types of baseline periods are supported:
-
Moving Window Baseline Periods: Moving window baseline periods are defined as some number of days prior to the current date (Example: Last 7 days). This allows comparison of current metric values with recently observed history. Moving window baselines are useful for operational systems with predictable workload cycles (Example: OLTP days and batch nights).
-
Static Baseline Periods: Static baselines are periods of time you define that are of particular interest to you (Example: End of the fiscal year). These baselines can be used to characterize workload periods for comparison against future occurrences of that workload (Example: Compare the end of the fiscal year from one calendar year to the next).
1.3.3 Advanced Threshold Management
While metric baselines are generally useful for determining valid target alert thresholds, these thresholds are static and are not able to account for expected performance variation. There are monitoring situations in which different work loads for a target occur at regular (expected) intervals. Here, a static alert threshold would prove to be inaccurate. For example, the alert thresholds for a database performing Online Transaction Process (OLTP) during the day and batch processing at night would be different. Similarly, database workloads can change based purely on different time periods, such as weekday versus weekend. Thus, fixed static values for thresholds might result in false alert reporting, and with excessive alerting could generate excessive overhead with regard to performance management. For this OLTP example, using static baselines to determine accurate alert thresholds fails to account for expected cyclic variations in performance, adversely affecting problem detection. Static baselines introduce the following configuration issues:
-
Baselines configured for Batch performance may fail to detect OLTP performance degradation.
-
Baselines configured for OLTP performance may generate excessive alerts during Batch cycles
Beginning with Enterprise Manager Release 12.1.0.4, Advanced Threshold Management can be used to compute thresholds using baselines that are either adaptive (self-adjusting) or time-based (user-defined).
-
Adaptive Thresholds: Allows Enterprise Manager to statistically compute threshold that are adaptive in nature. Adaptive thresholds apply to all targets (both Agent and repository monitored).
-
Time-based Thresholds: Allows you to define a specific threshold values to be used at different times to account for changing workloads over time.
A convenient UI allows you to create time-based and adaptive thresholds. From a target home page (a host, for example), navigate to the Metric Collection and Settings page. Click Advanced Threshold Management in the Related Links region.
Only numeric and View Collect metrics can be registered as adaptive thresholds. In addition, only the following types of metrics are permitted:
-
Load
-
Load Type
-
Utilization and Response
1.3.4 Events: Defining What Conditions are of Interest
When a metric threshold value is reached, a metric alert is raised. A metric alert is a type of event. An event is a significant occurrence that indicates a potential problem; for example, either a warning or critical threshold for a monitored metric has been crossed. Other examples of events include: database instance is down, a configuration file has been changed, job executions ended in failure, or a host exceeded a specified percentage CPU utilization. Two of the most important event types used in enterprise monitoring are:
-
Metric Alert
-
Target Availability
For more information on events and available event types for which you can monitor, see Chapter 2, "Using Incident Management".
1.3.5 Corrective Actions: Resolving Issues Automatically
Corrective actions allow you to specify automated responses to metric alerts, saving administrator time and ensuring issues are dealt with before they noticeably impact users. For example, if Enterprise Manager detects that a component, such as the SQL*Net listener is down, a corrective action can be specified to automatically start it back up. A corrective action is, therefore, any task you specify that will be executed when a metric triggers a warning or critical alert severity. In addition to performing a corrective task, a corrective action can be used to gather more diagnostic information, if needed. By default, the corrective action runs on the target on which the event has been raised.
A corrective action can also consist of multiple tasks, with each task running on a different target. Administrators can also receive notifications for the success or failure of corrective actions. A corrective action can also consist of multiple tasks, with each task running on a different target.
Corrective actions for a target can be defined by all Enterprise Manager administrators who have been granted Manage Target Metrics or greater privilege on the target. For any metric, you can define different corrective actions when the metric triggers at warning severity or at critical severity.
Corrective actions must run using the credentials of a specific Enterprise Manager administrator. For this reason, whenever a corrective action is created or modified, the credentials that the modified action will run with must be specified. You specify these credentials when you associate the corrective action with elements such as incident or event rules.
1.3.6 Metric Extensions: Customizing Monitoring
Metric Extensions let you extend Enterprise Manager's monitoring capabilities to cover conditions specific to your IT environment, thus providing you with a complete and comprehensive view of your monitored environment.
Metric extensions allow you to define new metrics on any target type that utilize the same full set of data collection mechanisms used by Oracle provided metrics. For example, some target types you can create metrics on are:
-
Hosts
-
Databases
-
IBM Websphere
-
Oracle Exadata Databases and Storage Servers
-
Oracle Business Intelligence Components
Once these new metrics are defined, they are used like any other Enterprise Manager metric. For more information about metric extensions, see Chapter 8, "Using Metric Extensions".
User-Defined Metrics (Pre-12c)
If you upgraded your Enterprise Manager 12c site from an older version of Enterprise Manager, then all user-defined metrics defined in the older version will also be migrated to Enterprise Manager 12c. These user-defined metrics will continue to work, however they will no longer be supported a future release. If you have existing user-defined metrics, it is recommended that you migrate them to metric extensions as soon as possible to prevent potential monitoring disruptions in your managed environment. For information about the migration process, see Converting User-defined Metrics to Metric Extensions in Chapter 8, "Using Metric Extensions"
1.3.7 Blackouts and Notification Blackouts
Blackouts allow you to support planned outage periods to perform scheduled or emergency maintenance. When a target is put under blackout, monitoring is suspended, thus preventing unnecessary alerts from being sent when you bring down a target for scheduled maintenance operations such as database backup or hardware upgrade. Blackout periods are automatically excluded when calculating a target's overall availability.
A blackout period can be defined for individual targets, a group of targets or for all targets on a host. The blackout can be scheduled to run immediately or in the future, and to run indefinitely or stop after a specific duration. Blackouts can be created on an as-needed basis, or scheduled to run at regular intervals. If, during the maintenance period, you discover that you need more (or less) time to complete maintenance tasks, you can easily extend (or stop) the blackout that is currently in effect. Blackout functionality is available from both the Enterprise Manager console as well as via the Enterprise Manager command-line interface (EM CLI). EM CLI is often useful for administrators who would like to incorporate the blacking out of a target within their maintenance scripts. When a blackout ends, the Management Agent automatically re-evaluates all metrics for the target to provide current status of the target post-blackout.
If an administrator inadvertently performs scheduled maintenance on a target without first putting the target under blackout, these periods would be reflected as target downtime instead of planned blackout periods. This has an adverse impact on the target's availability records. In such cases, Enterprise Manager allows Super Administrators to go back and define the blackout period that should have happened at that time. The ability to create these retroactive blackouts provides Super Administrators with the flexibility to define a more accurate picture of target availability.
Notification Blackouts
Beginning with Enterprise Manager 13c, you can stop notifications only. These are called Notification Blackouts and are intended solely for suppressing event notifications on targets. Because the Agent continues to monitor the target during the Notification Blackout duration, the OMS will continue to show the actual target status along with an indication that the target is currently under Notification Blackout.
1.4 Monitoring: Advanced Setup
Enterprise Manager greatly simplifies managing your monitored environment and also allows you to customize and extend Enterprise Manager monitoring capabilities. However, the primary advantage Enterprise Manager monitoring provides is the ability to monitor and manage large-scale, heterogeneous environments. Whether you are monitoring an environment with 10 targets or 10,000 targets, the following Enterprise Manager advanced features allow you to implement and maintain your monitored environment with the equal levels of convenience and simplicity.
1.4.1 Monitoring Templates
Monitoring Templates simplify the task of standardizing monitoring settings across your enterprise by allowing you to specify your standards for monitoring in a template once and apply them to monitored targets across your organization. This makes it easy for you to apply specific monitoring settings to specific classes of targets throughout your enterprise. For example, you can define one monitoring template for test databases and another monitoring template for production databases.
A monitoring template defines all Enterprise Manager parameters you would normally set to monitor a target, such as:
-
Target type to which the template applies.
-
Metrics (including user-defined metrics), thresholds, metric collection schedules, and corrective actions.
When a change is made to a template, you can reapply the template across affected targets in order to propagate the new changes. The apply operation can be automated using Administration Groups and Template Collections. For any target, you can preserve custom monitoring settings by specifying metric settings that can never be overwritten by a template.
Enterprise Manager comes with an array of Oracle-certified templates that provide recommended metric settings for various Oracle target types.
For more information about monitoring templates, see Chapter 7, "Using Monitoring Templates".
1.4.2 Administration Groups and Template Collections
Monitored environments are rarely static—new targets are constantly being added from across your ecosystem. Enterprise Manager allows you to maintain control of this dynamic environment through administration groups. Administration groups automate the process of setting up targets for management in Enterprise Manager by automatically applying management settings such as monitoring settings or compliance standards. Typically, these settings are manually applied to individual targets, or perhaps semi-automatically using monitoring templates (see Section 1.4.1, "Monitoring Templates") or custom scripts. Administration groups combine the convenience of applying monitoring settings using monitoring templates with the power of automation.
Template collections contain the monitoring settings and other management settings that are meant to be applied to targets as they join the administration group. Monitoring settings for targets are defined in monitoring templates. Monitoring templates are defined on a per target type basis, so you will need to create monitoring templates for each of the different target types in your administration group. You will most likely create multiple monitoring templates to define the appropriate monitoring settings for an administration group.
Every target added to Enterprise Manager possesses innate attributes called target properties. Enterprise Manager uses these target properties to add targets to the correct administration group. Administration group membership is based on target properties as membership criteria so target membership is dynamic. Once added to the administration group, Enterprise Manager automatically applies the requisite monitoring settings using monitoring templates that are part of the associated template collection .
Administration groups use the following target properties to define membership criteria:
-
Contact
-
Cost Center
-
Customer Support Identifier
-
Department
-
Lifecycle Status
-
Line of Business
-
Location
-
Target Version
-
Target Type
1.4.3 Customizing Alert Messages
Whenever a metric threshold is reached, an alert is raised along with a metric-specific message. These messages are written to address generic metric alert conditions. Beginning with Enterprise Manager Release 12.1.0.4, you can customize these messages to suit the specific requirements of your monitored environment.
Customizing an alert message allows you to tailor the message to suit your monitoring needs. You can tailor the message to include their operational context specific to your environment such as IT error codes used in your data center, or add additional information collected by Enterprise Manager such as:
-
Metric name for which the alert has been triggered
-
Severity level of the alert or violation
-
Threshold value for which warning or critical violation has been triggered
-
Number of Occurrences after which alert has been triggered
Alert message customization allows for more efficient alert management by increasing message usability.
To customize a metric alert message:
-
Navigate to a target homepage.
-
From the target menu (host target type is shows in the graphic), select Monitoring and then Metric and Collection Settings.
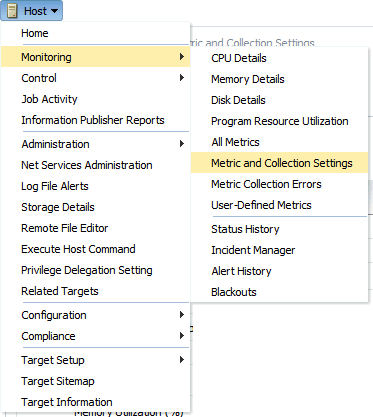
The Metric and Collection Settings page displays.
-
In the metric table, find the specific metric whose message you want to change and click the edit icon (pencil).
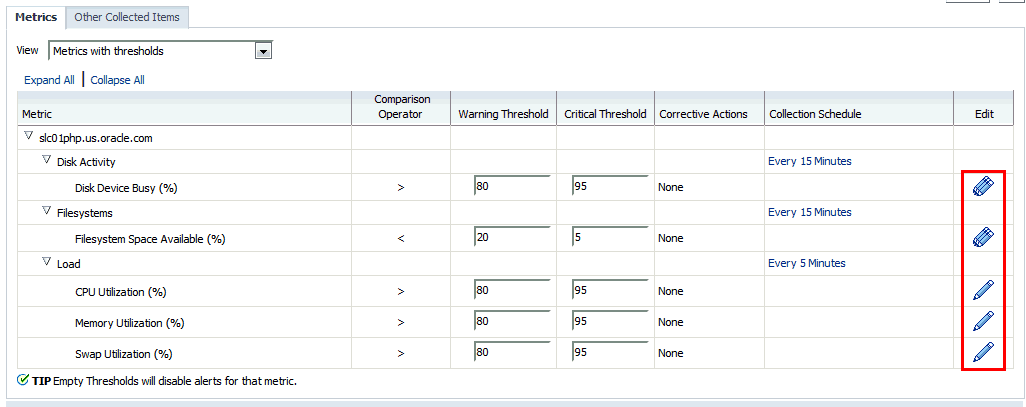
The Edit Advanced Settings page displays.
-
In the Monitored Objects region, click Edit Alert Message.
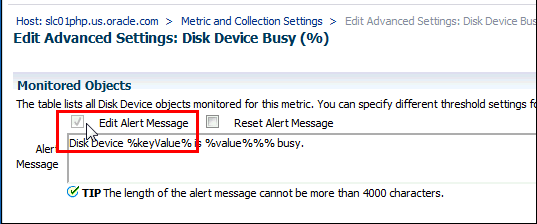
-
Modify the alert message as appropriate.
Note:
To change your revised message back to the original Oracle-defined message at any time, click Reset Alert Message. -
Click Continue to return to the Metric and Collection Settings page.
-
To modify additional metric alert messages, repeat steps three through six.
-
Once you are finished, click OK to save all changes to the Enterprise Manager Repository. Enterprise Manager will display a message indicating the updates have succeeded.
-
Click OK to dismiss the message and return to the target homepage.
1.5 Notifications
For a typical monitoring scenario, when a target becomes unavailable or if thresholds for performance are crossed, events are raised and notifications are sent to the appropriate administrators. Enterprise Manager supports notifications via email, pager, SNMP traps, or by running custom scripts and allows administrators to control these notification mechanisms through:
-
Notification Methods
-
Rules and Rule Sets
-
Notification Blackouts
Notification Methods
A notification method represents a specific way to send notifications. Besides e-mail, there are three types of notification methods: OS Command, PL/SQL, SNMP Traps. When configuring a notification method, you need to specify the particulars associated with a specific notification mechanism such as which SMTP gateway(s) to use for e-mail or which custom OS script to run. Super Administrators perform a one-time setup of the various types of notification methods available for use.
A rule instructs Enterprise Manager to take specific action when events or incidents (entity containing one important event or related events) occur, such as notifying an administrator or opening a helpdesk ticket (see Section 1.6, "Managing Events, Incidents, and Problems"). For example, you can define a rule that specifies e-mail should be sent to you when CPU Utilization on any host target is at critical severity, or another rule that notifies an administrator's supervisor if an incident is not acknowledged within 24 hours.
Notification Blackouts
Notification Blackouts allow you to stop notifications while at the same time allowing the Agents to continue monitoring your targets. This allows Enterprise Manager to more accurately collect target availability information. For more information, see "Blackouts and Notification Blackouts."
1.5.1 Customizing Notifications
Notifications that are sent to Administrators can be customized based on message type and on-call schedule. Message customization is useful for administrators who rely on both e-mail and paging systems as a means for receiving notifications. The message formats for these systems typically vary—messages sent to e-mail can be lengthy and can contain URLs, and messages sent to a pager are brief and limited to a finite number of characters. To support these types of mechanisms, Enterprise Manager allows administrators to associate a long or short message format with each e-mail address. E-mail addresses that are used to send regular e-mails can be associated with the long format; pages can be associated with the short format. The long format contains full details about the event/incident; the short format contains the most critical pieces of information.
Notifications can also be customized based on an administrator's on-call schedule. An administrator who is on-call might want to be contacted by both his pager and work email address during business hours and only by his pager address during off hours. Enterprise Manager offers a flexible notification schedule to support the wide variety of on-call schedules. Using this schedule, an administrator defines his on-call schedule by specifying the email addresses by which they should be contacted when they are on-call. For periods where they are not on-call, or do not wish to receive notifications for incidents, they simply leave that part of the schedule blank. All alerts that are sent to an administrator automatically adhere to his specified schedule.
1.6 Managing Events, Incidents, and Problems
Enterprise Manager's monitoring functionality is built upon the precept of monitoring by exception. This means it monitors and raises events when exception conditions exist in your IT environment and allowing administrators to address them in a timely manner. As discussed earlier, the two most commonly used event types to monitor for are metric alert and target availability. Although these are the most common event types for which Enterprise Manager monitors, there are many others. Available event types include:
-
Target Availability
-
Metric Alert
-
Metric Evaluation Errors
-
Job Status Changes
-
Compliance Standard Rule Violations
-
Compliance Standard Score Violations
-
High Availability
-
Service Level Agreement Alerts
-
User-reported
-
Application Dependency and Performance Alert
-
JVM Diagnostics Threshold Violation
By definition, an incident is a unit containing a single, or closely correlated set of events that identify an issue that needs administrator attention within your managed environment. So an incident might be as simple as a single event indicating available space in a tablespace has fallen below a specified limit, or more complex such as an incident consisting of multiple events relating to potential performance issue when a server is running out of resources. Such an incident would contain events relating to the usage of CPU, I/O , and memory resources. Managing by incident gives you the ability to address issues that may consist of any number of causal factors. For an in-depth discussion on incidents and events, see Chapter 2, "Using Incident Management".
Although incidents can correspond to a single events, incidents more commonly correspond to groups of related events. A large number of discrete events can quickly become unmanageable, but handled as an assemblage of related events, incidents allow you to manage large numbers of event occurrences more effectively.
Once an incident is created, Enterprise Manager makes available a rich set of incident management workflow features that let you to manage and track the incident through its complete lifecycle. Incident management features include:
-
Assign incident ownership.
-
Track the incident resolution status.
-
Set incident priority.
-
Set incident escalation level.
-
Ability to provide a manual summary.
-
Ability to add user comments.
-
Ability to suppress/unsuppress
-
Ability to manually clear the incident.
-
Ability to create a ticket manually.
Problems pertain to the diagnostic incidents and problems stored in Automatic Diagnostic Repository (ADR), which are automatically raised by Oracle software when it encounters critical errors in the software. When problems are raised for Oracle software, Oracle has determined that the recommended recourse is to open a Service Request (SR), send support the diagnostic logs, and eventually provide a solution from Oracle. A problem represents the underlying root cause of a set of incidents. Enterprise Manager provides features to track and manage the lifecycle of a problem.
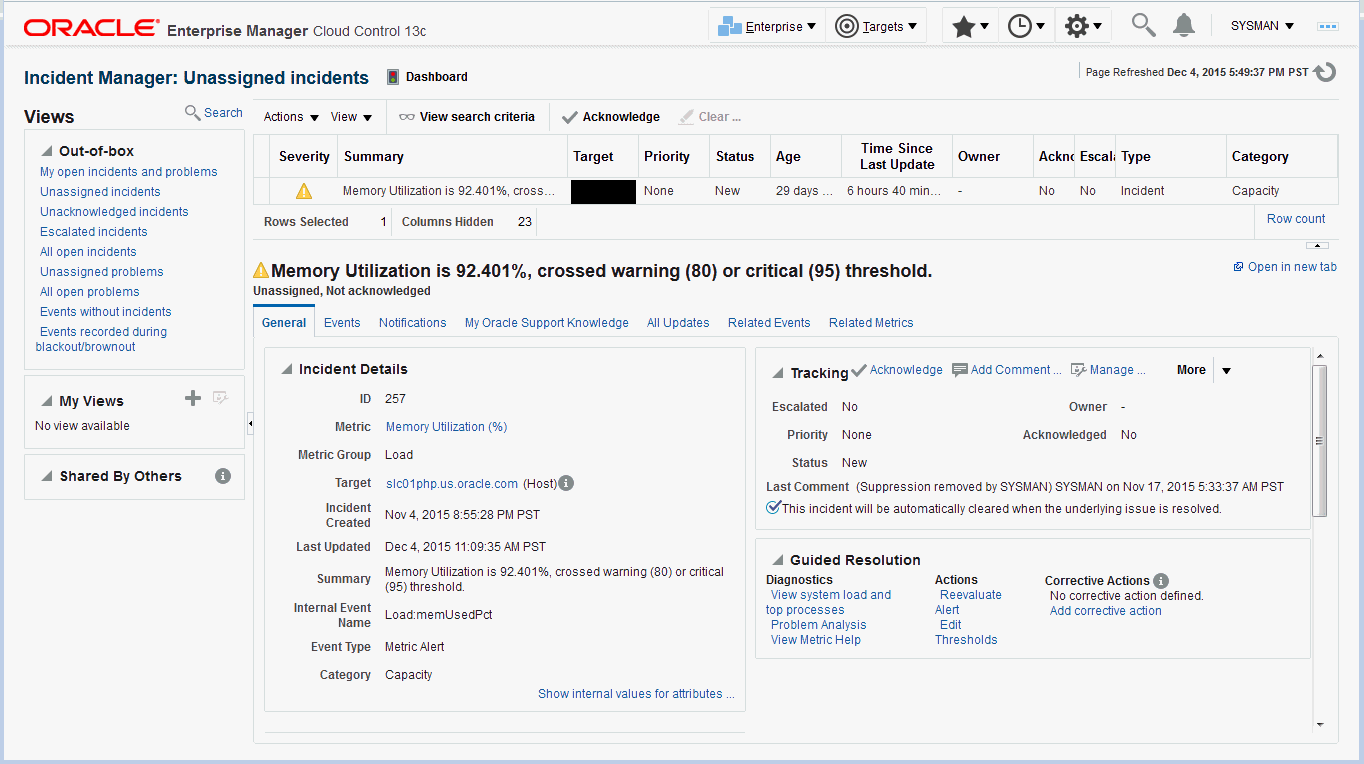
1.6.1 Incident Manager
Enterprise Manager Cloud Control simplifies managing incidents through an intuitive UI called Incident Manager. Incident Manager provides and easy-to-use interface that allows you to search, view, manage, and resolve incidents and problems impacting your environment. To access Incident Manager, from the Enterprise menu, select Monitoring, and then Incident Manager.
From the Incident Manager UI, you can:
-
Filter incidents, problems, and events by using custom views
-
Respond and work on an incident
-
Manage incident lifecycle including assigning, acknowledging, tracking its status, prioritization, and escalation
-
Access (in context) My Oracle Support knowledge base articles and other Oracle documentation to help resolve the incident.
-
Access direct in-context diagnostic/action links to relevant Enterprise Manager functionality allowing you to quickly diagnose or resolve the incident.
1.6.2 Incident Rules and Rule Sets
An incident rule specifies criteria and actions that determine when a notification should be sent and how it should be sent whenever an event or incident is raised. The criteria defined within a rule can apply to attributes such as the target type, events and severity states (clear, warning or critical) and the notification method that should be used when an incident is raised that matches the rule criteria. Rule actions can be conditional in nature. For example, a rule action can be defined to page a user when an incident severity is critical or just send e-mail if it is warning.
A rule set is a collection of rules that apply to a common set of targets such as hosts, databases, groups, jobs, metric extensions, or self updates and take appropriate actions to automate the business processes underlying incident. Incident rule sets can be made public for sharing across administrators. For example, administrators can subscribe to the same rule set if they are interested in receiving notifications for the same criteria defined in the rule. Alternatively, an Enterprise Manager Super Administrator can assign incident rule sets to other administrators so that they receive notifications for incidents as defined in the rule.
In addition to being used by the notification system (see Rules in Section 1.5, "Notifications" ), rule sets can also instruct Enterprise Manager to perform other actions, such as creating incidents, updating incidents, or call into a trouble ticketing system as discussed in Section 1.6.3, "Connectors".
1.6.3 Connectors
An Oracle Management Connector integrates third-party management systems with Enterprise Manager. There are two types of connectors: Event connectors and helpdesk connectors.
Using the event connector, you can configure Enterprise Manager to share events with non-Oracle management systems. The connector monitors all events sent from Oracle Enterprise Manager and automatically updates alert information in the third-party management system. Event connectors support the following functions:
-
Sharing of event information from Oracle Enterprise Manager to the third-party management system.
-
Customization of event to alert mappings between Oracle Enterprise Manager and the third-party management system.
-
Synchronization of event changes in Oracle Enterprise Manager with the alerts in the third-party management system.
Using the helpdesk connector, you can configure Enterprise Manager to create, update, or close a ticket for any event created in Enterprise Manager. The ticket generated by the connector contains the relevant information about the Enterprise Manager incident, including a link to the Enterprise Manager console to enable helpdesk analysts leverage Enterprise Manager's diagnostic and resolution features to resolve the incident. In Enterprise Manger, the ticket ID, ticket status, and link to the third-party ticketing system is the shown in the context of the incident. This provides Enterprise Manager administrators with ticket status information and an easy way to quickly access the ticket.
Available connectors include:
-
BMC Remedy Service Desk Connector
-
HP Service Manager Connector
-
CA Service Desk Connector
-
HP Operations Manager Connector
-
Microsoft Systems Center Operations Manager Connector
-
IBM Tivoli Enterprise Console Connector
-
IBM Tivoli Netcool/OMNIbus Connector
For more information about Oracle-built connectors, see the Enterprise Manager Plug-ins Exchange.
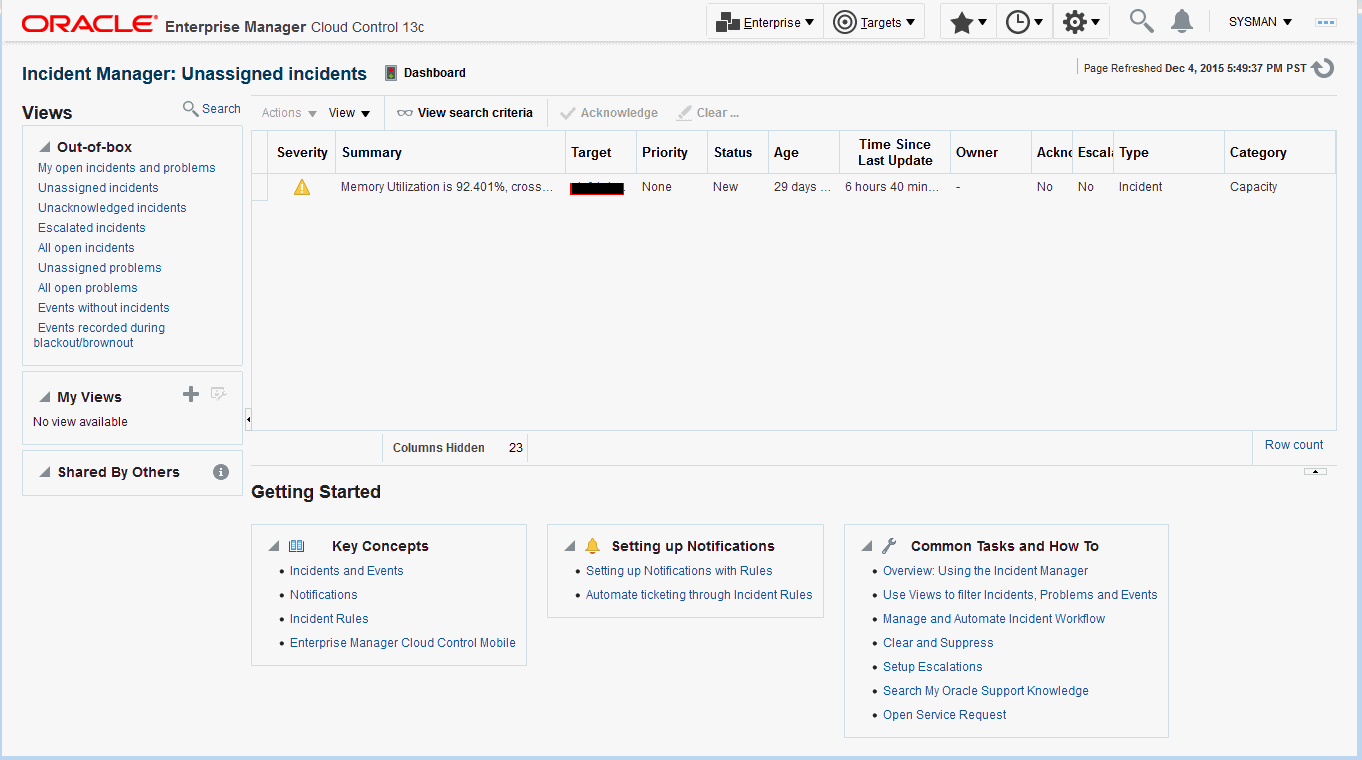
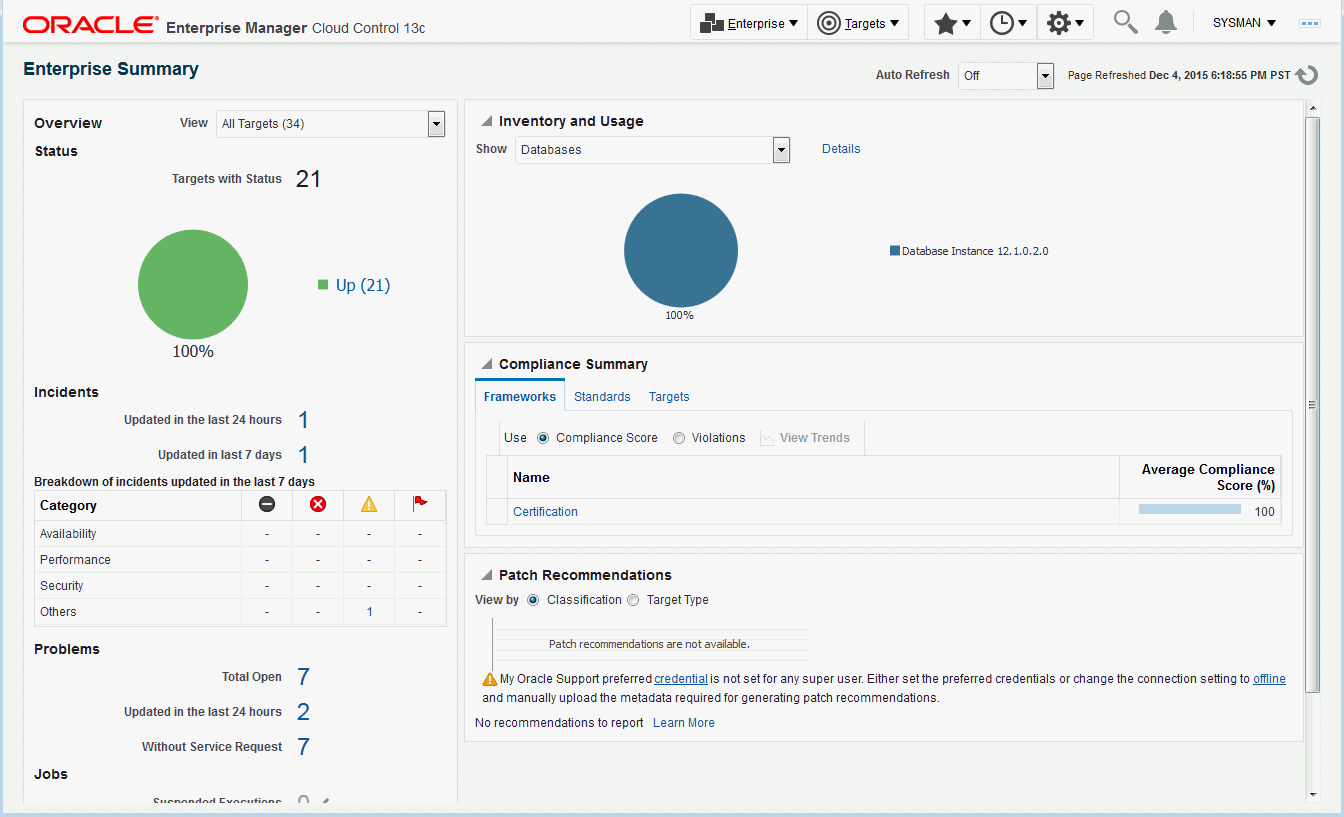
1.7 Accessing Monitoring Information
Enterprise Manager provides multiple ways to access monitoring information. The primary focal point for incident management is the Incident Manager console, however Enterprise Manager also provides other ways to access monitoring information. The following figures show the various locations within Enterprise Manager that display target monitoring information. The following figure shows the Enterprise Manager Overview page that conveniently displays target status rollup and rollup of incidents.
The next figure shows the Incident Manager home page which displays incidents for a system or target.
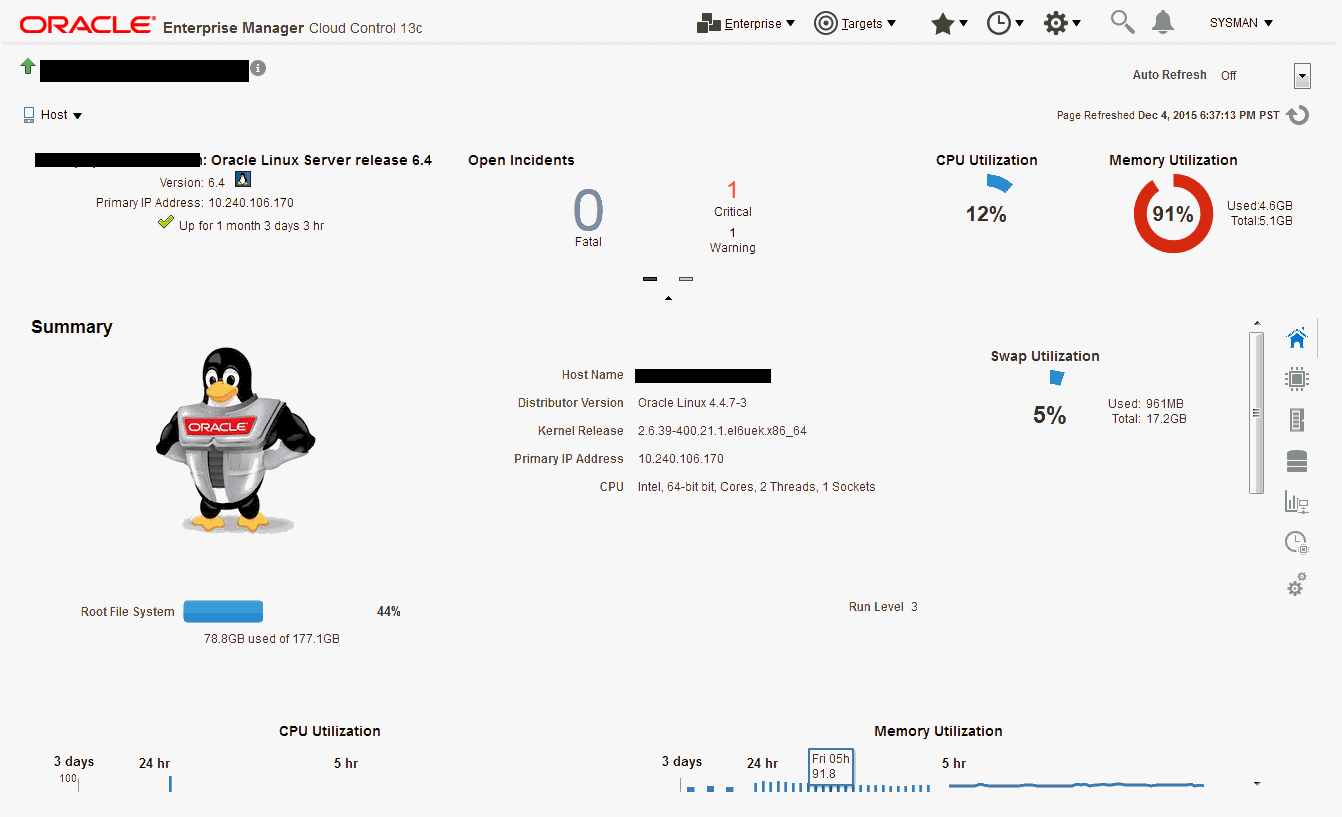
Monitoring information is also displayed on target home pages. In the following figure, you can see target status as well as a rollup of incidents.