5 Monitoring and Managing Exalogic
This chapter describes how to monitor and manage your Exalogic assets in the following sections:
-
Monitoring the Hardware Components of Exalogic Elastic Cloud
-
Visualizing Relationships Between Exalogic Software and Hardware Components
5.1 Displaying and Using the Exalogic Elastic Cloud Dashboard
Use the Exalogic Elastic Cloud Dashboard to view status information about software and hardware targets in the Exalogic Elastic Cloud:
To display and use the Exalogic Elastic Cloud Dashboard, follow these steps:
-
In Enterprise Manager, navigate to the Systems page. Filter the entries in the Search field by choosing Exalogic Elastic Cloud from the drop-down list and click Go. In the Search Results table, choose the Exalogic Elastic Cloud you want to view.
Enterprise Manager displays the Exalogic Elastic Cloud home page where you can monitor the components on the Exalogic Dashboard.
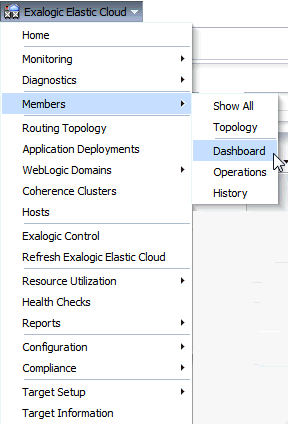
You can view the dashboard anytime from the Exalogic Elastic Cloud home page. From the Exalogic Elastic Cloud menu, select Members, then Dashboard as shown in Figure 5-1.
-
You can view detailed information about each software component by choosing the component name from the Exalogic Elastic Cloud drop-down list. Only the software components are visible in the Exalogic drop-down list. Hardware components can be seen in the Members tab.
Enterprise Manager displays the component page you selected. For example, select WebLogic Domains Summary page to see the charts showing the status of WebLogic servers, Request Processing Time metric information, CPU Usage, Requests per minute, and Heap Usage data.
-
You can return to this page at any time by choosing Home from the Exalogic Elastic Cloud drop-down list.
-
You can display General Information about the Exalogic target by choosing Target Information from the Exalogic Elastic Cloud drop-down list.
5.1.1 Using the Software Tab
Use the Software tab on the Exalogic Elastic Cloud Dashboard to display status information including alerts and key performance metrics of the following targets in the Exalogic Elastic Cloud:
-
Application Deployments - see Viewing Application Deployments in the Exalogic Elastic Cloud Target
-
WebLogic Domains - see Viewing WebLogic Domains Hosted on the Exalogic Elastic Cloud Target
-
Coherence Clusters - see Viewing Coherence Cluster Targets
-
Hosts - see Viewing Host Targets on the Exalogic Elastic Cloud Target
-
SOA
-
OTD
Note:
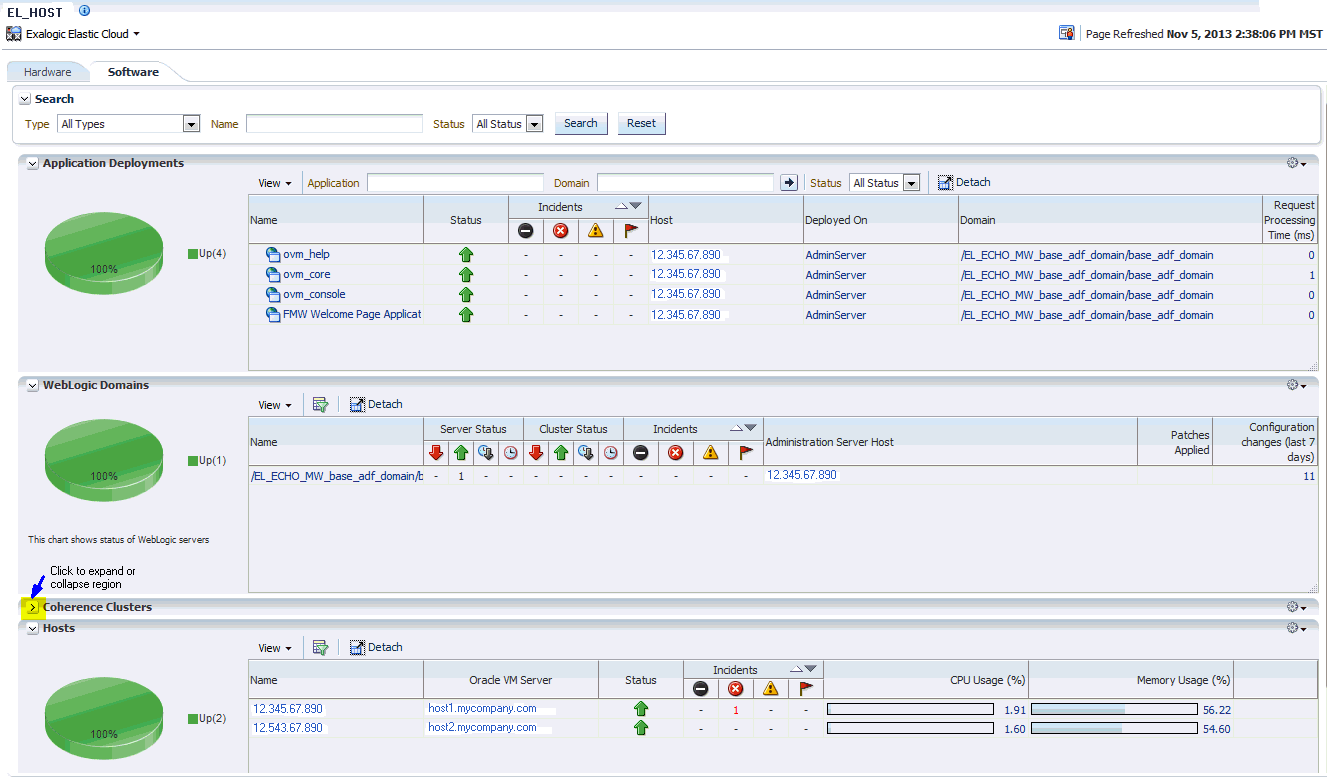
See Deploying the Management Agent for Servers for details to deploy the Management Agent to enable the Software tab.The Software tab (as show in Figure 5-2) displays an Incident section in the table for each element, such as Application Deployments or WebLogic Domains, that shows alerts on which you can drill down for more information.
You can also use the Software tab to view the alarms that are generated in Oracle Enterprise Manager Ops Center for an Exalogic Elastic Cloud system as incidents for an Exalogic system target. The Software tab displays alarms and incidents generated for Oracle Enterprise Manager Ops Center as incidents in Cloud Control for an Exalogic System target so that you can view all the issues from both the systems at one place. This allows you to use the existing integration between Oracle Enterprise Manager Cloud Control and the ticketing system to manage the Oracle Enterprise Manager Ops Center incidents.
The Software tab displays large numbers of software targets that are members of the Exalogic system. You can use the inter-region filtering option to conduct a page level search. For example, if the search is performed for an Oracle WebLogic Domain, the Applications region is also filtered to show all the applications deployed on the WebLogic servers that are members of the searched WebLogic domain. Similarly the Host region is filtered to show hosts that are hosting the WebLogic servers that are part of the searched WebLogic domain.
5.1.2 Using the Hardware Tab
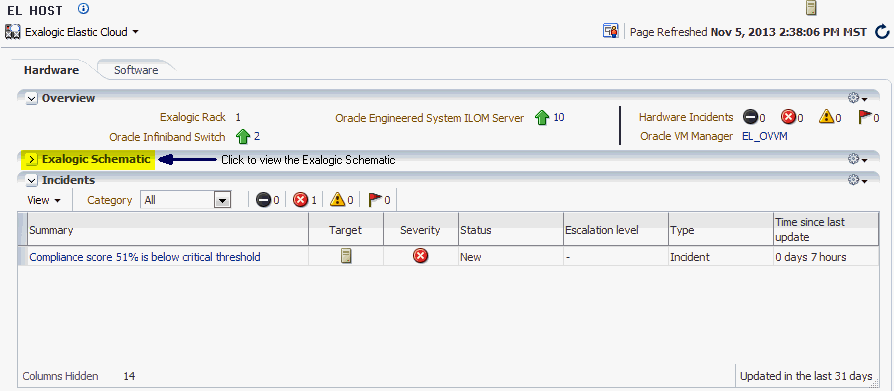
You can also use the Exalogic Elastic Cloud Dashboard page to access the Hardware tab (as shown in Figure 5-3)where you can view information about the hardware and infrastructure of the Exalogic Elastic Cloud. You can view information such as Temperature (by turning on the Temperature option at the top of the Exalogic Schematic) and Status, as well as a Hardware Schematic depicting the current state of the hardware.
The Hardware tab displays the number of hardware units in each category along with their status in the Overview section. It also shows the Incidents associated with the hardware. The Exalogic Hardware schematic shows the position of each hardware component on the rack. You can use the Incidents section to monitor hardware issues that arise and then drill down to the Incident Manager page by clicking the Incident Summary for more details about the incident.
5.2 Monitoring the Hardware Components of Exalogic Elastic Cloud
You can monitor the hardware components of an Exalogic Elastic Cloud by following these steps:
-
From the Enterprise Manager Systems page, click the Exalogic Elastic Cloud target from the table. Alternatively, you can choose Exalogic from the Targets menu.
Enterprise Manager displays the Exalogic Elastic Cloud Dashboard page.
-
Click the Hardware tab to view a schematic showing the hardware configuration of the Exalogic Elastic Cloud.
You can use the Hardware tab to view information such as Temperature (by turning on the Temperature option at the top of the Exalogic Schematic) and Status, as well as a Hardware Schematic depicting the current state of the hardware.
The Hardware tab displays the number of hardware units in each category along with their status in the Overview section. It also shows the Incidents associated with the hardware. The Exalogic Schematic depicts the hardware, such as InfiniBand Switches, Storage Heads, Storage Disks, and Compute Nodes and employs a Legend that indicates the current state (Up, Down, Unallocated, and so on) of each.
You can use the Incidents section to monitor hardware issues that arise and then drill down to the Incident Manager page by clicking the Incident Summary for more details about the incident.
5.3 Visualizing Relationships Between Exalogic Software and Hardware Components
Use Enterprise Manager Cloud Control to visualize relationships among Exalogic software and hardware components. To see the routing topology among these components, follow these steps:
-
From the Targets menu, select Exalogic.
-
From the list of Exalogic targets, click the Exalogic Elastic Cloud target you want to view.
-
From the Exalogic Elastic Cloud menu, select Routing Topology.
-
View the relationships between Exalogic software and hardware components.
5.4 Analyzing the Impact of Component Failures
You can analyze the impact of component failures in an Exalogic environment by following these steps:
-
From the Targets menu, select Exalogic.
-
From the list of Exalogic targets, click the Exalogic Elastic Cloud target you want to view.
-
From the navigation panel, click the Oracle Infiniband Network you want to view.
-
From the Infiniband Network menu, select Topology.
-
Identify any problems with a component by observing status and incident badges, or by showing metric values by way of the Annotations toolbar menu.Identify components linked to the problem component in the diagram.


