15 Monitoring and Maintaining the System
This chapter explains the tasks performed by an Administrator. These include monitoring the status of the system, performing backups and upgrades, working with the event log, managing system users, and configuring data retention policies.
15.1 Monitoring the Status of the System
An Administrator can check the system's condition, and receive automatic status monitoring messages on the Status page. To reach this page, select System, and then Status. An example is shown in Figure 15-1.
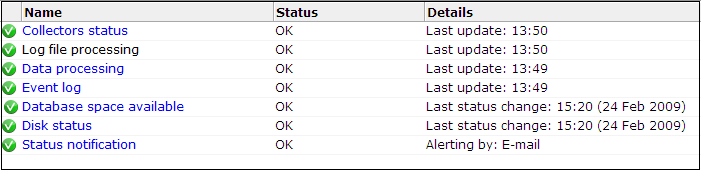
Through the Status page, you can review the status of the attached Collectors and the log file process, the current level of processing within the system, whether there is sufficient space within the Reporter and Processing Engine database table spaces, and the Event log. You can also configure which users are notified (and how) in the event of a system status error.
Understanding Component Failures
Each of the components shown in Figure 15-1 indicate their current status. During normal operation, this should be reported as "OK". However, if one or more component reports status "Error", use the information in Table 15-1 to identify and resolve the problem.
Table 15-1 Reasons for Reported Errors
| Component | Possible Cause |
|---|---|
|
Collector status |
|
|
Log file processing |
|
|
Data processing |
|
|
Event log |
|
|
Database space available |
(See Section 15.4, "Configuring Database and Disk Space Limits and Alerts"). |
|
Disk space |
(See Section 15.4, "Configuring Database and Disk Space Limits and Alerts"). |
15.1.1 Temporary Delays and Alerts
Be aware that the system status indicator shown in Figure 15-1 is only updated when the browser screen is refreshed. If one or more of the system processes are found to be failing, a system alert can be generated (as described in Section 15.3, "Configuring System Failure Alerts"). Therefore, the situation can arise that a process is shown temporarily as failing (with a red cross), but no alert is generated. This is because the system status indicator has returned to normal by the time the system processes are checked.
Due to this design, when an alert is triggered, it is recommended that you regard it as a warning that the system is starting to fail. A failure can be the result of a system delay that is larger than the default boundaries. For example, the latency between a hit on the monitored line, and the moment the information based on that hit is available in the Reporter, may not be long enough. This latency may be out of boundary within a high-traffic environment. A failure may also be the result of a temporary peak in traffic. However, if this condition persists, it is recommended that you review the monitored traffic level.
15.2 Viewing the Status of the Collectors
You can view the status of each Collector attached to the system by selecting System, then Status, and then Collector status. It opens the Network data Collectors status window. An example is shown in Figure 15-2.
Figure 15-2 Network Data Collectors Status Window
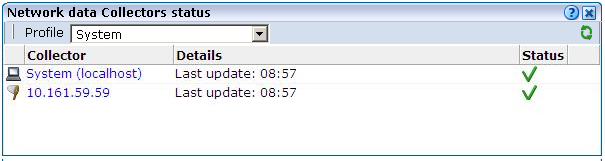
Description of ''Figure 15-2 Network Data Collectors Status Window''
Note that the System (localhost) item refers to the network data Collector instance on the Reporter system. Other network collectors within the network are represented by their IP address. Click the required Collector, or select View statistics from its context menu, to view a detailed report of the traffic monitored by the Collector. An example is shown in Figure 15-3.
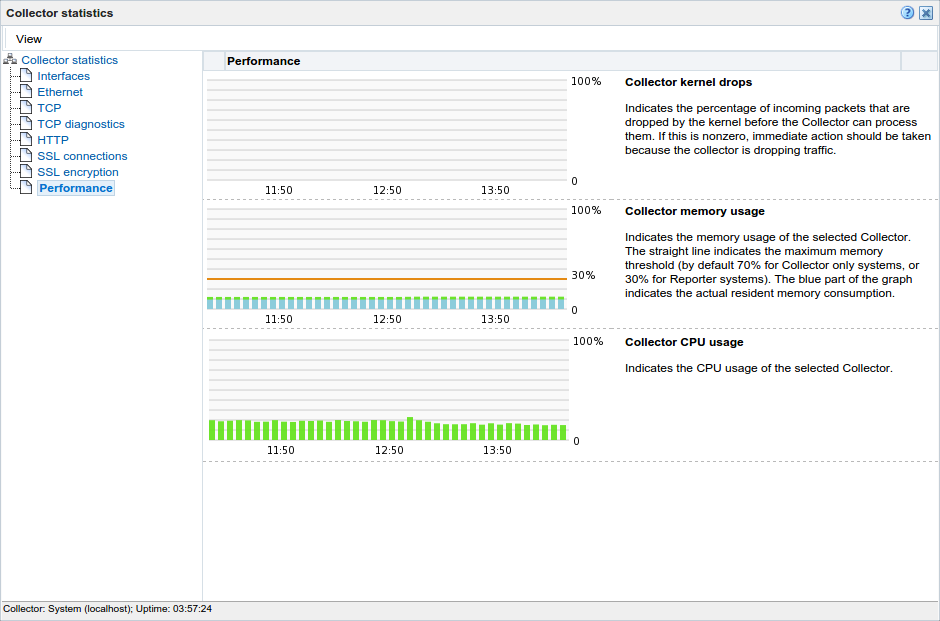
The information shown in this window refers to the traffic monitored since midnight for the selected Collector, or the counters were reset. The Uptime field in the bottom left-hand corner of the window shows the time the Collector has been running. The uptime is reset when the Collector is restarted to update its configuration. You can reset all HTTP request counters shown in the window by selecting Reset counters from the View menu. Note that the counters will be reset the next time a network packet is detected. Hence, on an installation with no network traffic, the counters will never be reset. The display is automatically refreshed every two seconds.
Working With the Collector Statistics Window
The tabs available in the top-left part of the part of the window provide a detailed breakdown of the traffic monitored by the selected Collector. They are explained in Table 15-2.
Table 15-2 Collector Statistics Report Tabs
| Tab | Description |
|---|---|
|
Interfaces |
Provides information on the available network interfaces for data collection. The number of interfaces and their status depends on the system configuration. For a tag server the interface is associated with an IP, network data collectors are not associated with an IP. Note that you will not see any "normally" configured interfaces. For each available network interface, the name (in the form |
|
Ethernet |
Provides a breakdown of the raw packet data transmitted over the monitored ports in terms of its protocols (such as IPv4 and ARP), and the number of measured frames. The "Truncated" listing indicates corrupted or dropped frames. |
|
TCP |
Provides an analysis of the TCP stream. The following counters are reported:
The following network error meters are also shown:
In the event of any of the above meters indicating problems, it is recommended that you use the TCP diagnostics facility to isolate possible causes. |
|
TCP diagnostics |
The use of this facility is described in Appendix R, "Verifying Monitored Network Traffic". |
|
HTTP |
Provides an analysis of the monitored HTTP stream. In particular, the type of requests (such as GET or POST) they contain. |
|
SSL connections |
Reports the encryption method used for packets of encrypted data. In particular:
Errors related to SSL key management are reported. In particular:
Information about (currently) unsupported encryption:
The Decrypt errors gauge indicates the connections which could not be decrypted. This can be caused by several reasons, including the master key could not be decrypted, session keys were incorrectly computed, or a segment could not be decrypted. |
|
SSL encryption |
Provides a breakdown of the monitored encrypted data in terms of the employed encryption algorithm. The Used column indicates the amount (percentage) of total monitored SSL encrypted traffic that used an encryption algorithm, and the Errors column indicates the percentage of measured SSL encryption which failed (that is, could not be read). |
|
Performance |
Reports on the impact to the Collector memory and CPU. Note that if the peak load nears 100%, immediate action should be taken to prevent data being dropped by the Collector. See Section 13.4.3, "Limiting Overall Traffic" about traffic sampling. If this does not provide a solution, it is also recommended that you contact Customer Support. The Collector's memory usage is also indicated. The maximum memory threshold is 30% for Reporter/Collector systems, and 70% for Collector only systems). The Collector kernel drops graph shows the percentage of packets not passed on by the kernel. |
Monitoring SSL and Forms Traffic
Be aware that SSL and Oracle Forms traffic are particularly sensitive to disruptions in the TCP packet stream. This is because they require state information to be maintained for the duration of the connection, and any lost packets can cause that information to be lost, preventing RUEI from accurately monitoring and reporting the connection.
Therefore, you should ensure that each Collector is connected to a reliable network device, such as a TAP. In addition, it is strongly recommended that you regular review the information available through the Collector Statistics window to verify the integrity of the TCP packet stream. Particular attention should be paid to the reported TCP and SSL connection errors.
15.3 Configuring System Failure Alerts
In addition to being notified about KPI and SLA violations, you can also configure alerts for system failures. It is strongly recommended that you do so. System alerts not only enable you to take prompt action in the case of system problems (such as a failing Collector), but can also help indicate serious external issues (such as a denial-of-service attack). To do so, select System, then Status, and then Status notification. The dialog that appears is similar to that described in Section 8.5.1, "Defining Alert Profiles".
Basically, any event that makes one (or more) of the indicators shown in Figure 15-1 report the status warning or error will trigger a system alert. For example, a Collector status alert might indicate that a Collector is unavailable or failing.
It is recommended that you pay particular attention to the following points:
-
The configured recipients are also notified about database and disk space utilization warnings and errors (as described in Section 15.4, "Configuring Database and Disk Space Limits and Alerts").
-
The system status alerting does not consider any alerting schedules or escalation levels. When configuring alerts, ensure all recipient information (such as E-mail addresses and telephone numbers) is correctly specified. Note also that the system status check is run every 10 minutes. Therefore, if a system failure is indicated in Figure 15-1, you may not immediately receive an alert about it, but when the scheduled system check is run.
-
In the case of Event log alerts, it is recommended that you review the reported events, as described Section 15.7, "Working with the Event Log". Be aware that Event log warnings or errors must be marked as read in order for the Event log indicator to return to the status OK.
-
In the case of Collector status alerts, it is recommended that you use the Collector Statistics window (described in Section 15.2, "Viewing the Status of the Collectors") to troubleshoot the issue.
-
In the event of other (or persistent) errors or warnings, please contact Customer Support.
As with KPI and SLA violations, you can configure system event notifications to be sent via SNMP traps. In this case, each event reported in the Event log (described in Section 15.7, "Working with the Event Log"), becomes a separate SNMP trap.
To configure SNMP traps for system events, do the following:
-
Select System, then Status, and then Status notification. The System status monitoring screen appears.
-
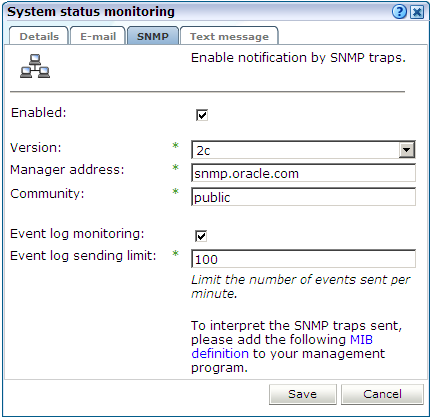
Click the SNMP tab. The dialog shown in Figure 15-4 appears.
-
Ensure that the Enabled and Event log monitoring check boxes are checked. Note that if not, no event SNMP traps for system events are generated.
-
Use the Event log sending limit field to specify the maximum number of SNMP traps that will be send within a 1-minute period. This feature is useful to prevent flooding the recipient SNMP manager with excessive numbers of traps. For example, consider the case in which 500 events are reported within a 1-minute period. In principle, each of these would become separate SNMP traps. However, if the send limit is set to 100, only the most serious 100 events would result in SNMP traps being generated.
-
See Section 8.5.6, "Using SNMP Notifications" for information about using the other fields in the dialog.
-
Download the Management Information Base (MIB) definition and incorporate it into your address book of managed objects. It contains necessary information about how the received SNMP messages should be interpreted. Note that the MIB file (
oracle-ruei.mib) is also available within the RUEI installation zip file in theRUEI/extradirectory.
15.4 Configuring Database and Disk Space Limits and Alerts
In order to ensure the uninterrupted operation of your system, limits are set to the maximum level of available database and disk space utilization. When the maximum database utilization level is reached, no further data is written to it until an administration mechanism has brought the database's size back to within its permitted boundary. Similarly, when the maximum disk space utilization is reached, the Collector is stopped, no further data (in the form of log files) is written to the file system until an administrator process has deleted existing files. As a result, information about ongoing sessions is lost, as is Full Session Replay (FSR) data. In addition, you can also configure alerts to be generated when either of these problems may be about to arise.
Important:
It is strongly recommended you only modify the default settings if you have a sound knowledge of RUEI, and clearly understand the use and effect of these settings.To define database or disk space thresholds, do the following:
-
Select Configuration, then General, then Advanced settings, and then Database/disk space usage. The thresholds selection panel shown in Figure 15-5 appears.
Figure 15-5 Database and Disk Space Thresholds
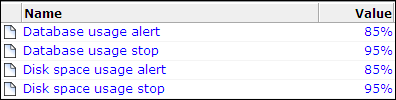
Description of ''Figure 15-5 Database and Disk Space Thresholds''
-
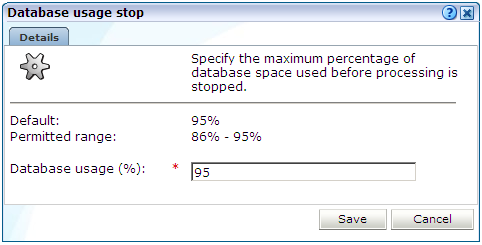
Select the required threshold. A dialog similar to the one shown in Figure 15-6 appears.
-
In the case of an alert threshold, use the dialog to specify the maximum database or disk space utilization before an alert is generated. The generated alert is sent to the same recipients, and uses the same notification mechanism, as that defined for system failure alerts (described in Section 15.3, "Configuring System Failure Alerts"). In the case of a stop threshold, specify the maximum database or disk space utilization before database processing or data collection is stopped. When ready, click Save. Any changes you specify take effect immediately.
When defining threshold values, be aware of the following:
-
The maximum permitted setting for stopping the database or disk space utilization is 95%. This is because if the available disk space becomes completely (100%) full, other components on the system may no longer work. In addition, remote logging onto the system may no longer be possible. Similarly, if the database is allowed to become completely full, the administrative mechanism used to reduce its size will no longer work.
-
The specified thresholds refer to all partitions used for RUEI. That is,
/var/opt/ruei, and any mounted partitions under it. The alert and stop mechanisms will be triggered if at least one partition reaches its specified threshold. -
Checking of the defined thresholds is not performed continuously, but every 10 minutes. Hence, it is possible that by the time a check is performed, and an alert is issued, the database or disk space utilization is already higher than the specified threshold. For this reason, it is recommended that you set threshold values slightly lower than their intended target. For example, instead of setting the disk space stop threshold at 95%, set it to 93% or 94%.
-
An alert notification threshold cannot be higher than its associated stop threshold. For example, if the database stop threshold is 95%, the alert threshold cannot be higher than this.
-
By default, alert thresholds are 85%, and stop thresholds are 95%.
-
There is also a Linux operating system limit of 95% on disk space usage. If this limit is reached, only the
rootuser can write to disk. Because RUEI does not have this privilege, further utilization of disk space is prevented.
15.5 Viewing a Traffic Summary
You can open an overview of the monitored network traffic by selecting System, then Status, and then Data processing. This provides you with immediate information about hits, pages, and session processing, as well as the system load for each processing unit. An example is shown in Figure 15-7.
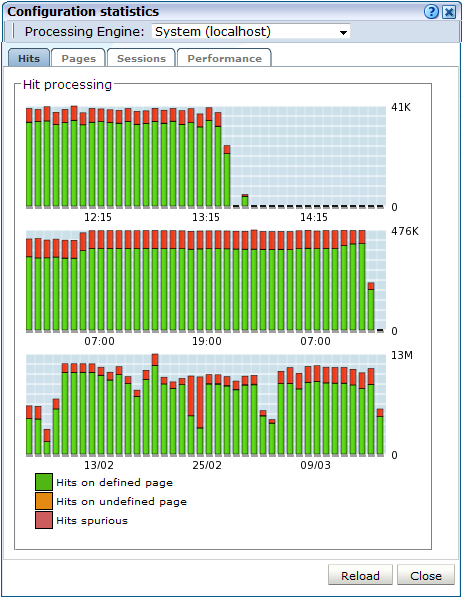
Note the Available resource usage (%) item on the Performance tab indicates the current processing level. If this approaches 100%, it means a lag in the processing of data is starting to occur, and it is no longer possible to process data in real time.
Be aware that because this facility is based on application logic, non-application traffic (such as suites, services, and SSOs), are not represented in the displayed reports.
Important:
In order for RUEI to correctly report on monitored traffic, it is strongly recommended that you regularly review this traffic summary. If necessary, review the RUEI configuration accordingly. For example, add additional cookie technologies. In addition, if the system is unable to track sessions, proper tracking of user flows will also not be available because user flow reporting requires session tracking.15.6 Creating and Restoring Configuration Backups
You can create backups of your system's current configuration, and restore it if necessary. It is recommended that you regularly make backups. Note that backups only contain the system settings. For security reasons, SSL keys and collected data are not included.
To create or restore a backup, do the following:
-
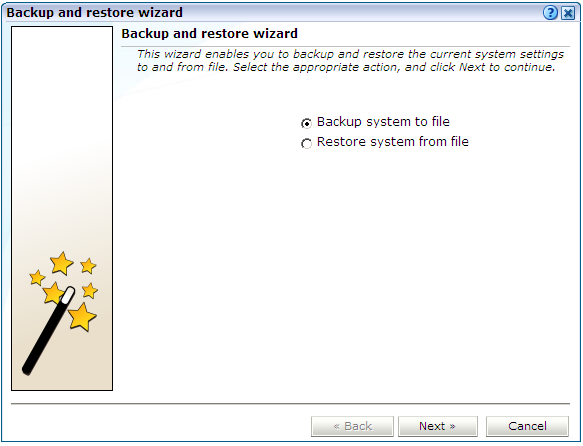
Select System, then Maintenance, and then Backup and restore. The dialog shown in Figure 15-8 appears.
-
Use the radio buttons to selected the required operation. When ready, click Next.
-
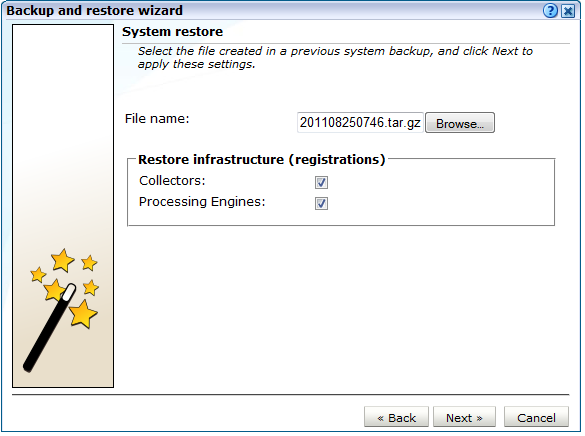
If you selected the Restore system from file option in Figure 15-8, the dialog shown in Figure 15-9 appears.
Click Browse to locate and select the required backup file.
By default, administration information about your Collectors and Processing Engines is not restored. However, you can use the Collectors and Processing Engines check boxes to specify that this information should also be restored. Be aware that Collectors and Processing Engines configured on your system at the time the backup was created, but which have since been removed, will be added to the restored system. Similarily, Collectors and Processing Engines currently configured on your system, but which were not configured at the time the backup was created, will be disabled. When ready, click Next.
-
If you selected the Backup system to file option in Figure 15-8, depending on how your browser is configured, you are either prompted to specify the location to which the zip file should be saved, or it is immediately saved to the defined default location.
Note the following:
-
The generated backup file contains large amounts of information intended for Customer Support use only. Do not try to modify the file's contents. When performing a restore, be aware that all current settings are overwritten by the restored ones.
-
After performing a restore from backup, you should immediately upload all required SSL keys. This is because all existing SSL keys are deleted and they are not included in the backup file.
15.7 Working with the Event Log
In addition to the status information described in Section 15.1, "Monitoring the Status of the System", RUEI maintains an event log. This contains a record of all system events. It enables both you and Customer Support to quickly identify and resolve any issues that might arise within your RUEI installation.
It is recommended that you regularly review the contents of the event log. If the event log contains any unread error messages, this is indicated by the Event log item within the Status panel being shown with an error icon. Be aware that while most events are reported almost immediately, Collector-related events can take up to five minutes to be reported.
To review the event log, do the following:
-
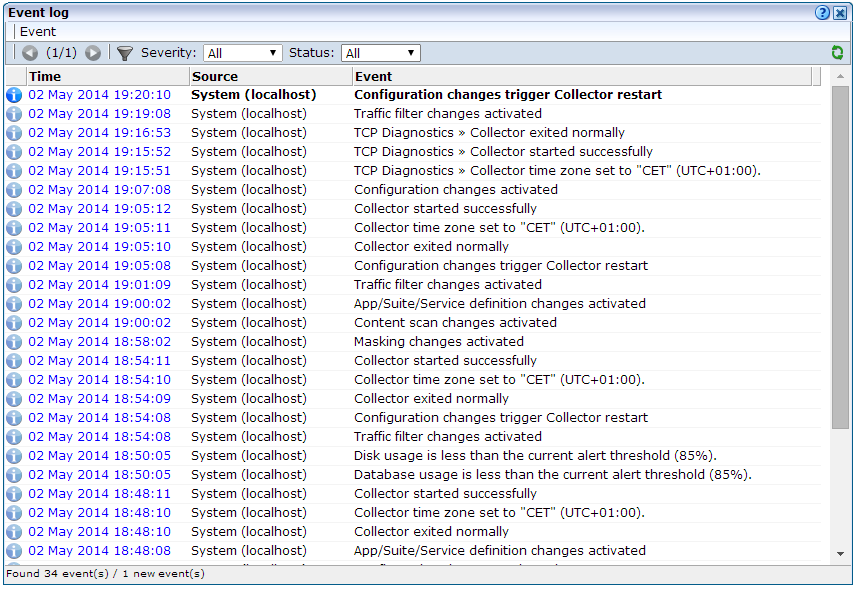
Select System, then Status, and then Event log. A dialog similar to the one shown in Figure 15-10 appears listing the most recent events.
-
Use the controls within the toolbar to scroll through the list of events. Each displayed log page can contain up to 100 reported events. By default, all event types are listed. However, the Severity menu enables you to restrict the displayed list to a selected category. The potential impact of an event is indicated through the severities described in Table 15-3.
Severity Description Info
Indicates a user-triggered action. For example, the restart of a Collector, the creation of a new user account, or a configuration backup or restoration.
Warning
Indicates an event that might cause your RUEI installation to fail. For example, the Reporter system is close to running out of disk space or a backlog is developing in the processing of log files.
Error
Indicates an event that results in your RUEI installation not being fully operational. For example, a remote Collector is no longer available.
Debug
Displays more detailed information about an event.
You can also use the Status menu to view all reported events, or restrict the displayed list to new (unread) events.
Note:
If the same event occurred multiple times within a 5-minute period, this is indicated by a repeat counter shown within the reported event. -
Optionally, you can select the options shown in Table 15-4 within the Event menu.
Option Description Mark all events as read
Refreshes the displayed event list with any event information that occurred since you opened the log. Note that you can also click the Reload icon within the toolbar to do this.
Reload
Refreshes the displayed event list with any event information that occurred since you opened the log. Note that you can also click the Reload icon within the toolbar to do this.
Close
Closes the event log.
-
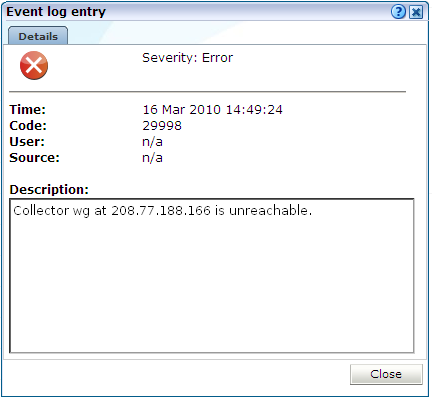
You can click a displayed event to view more information about it. A dialog similar to the one shown in Figure 15-11 appears.
This dialog provides you with the complete event text, as well as the associated event code. Note that both of these should be specified when contacting Customer Support. In the case of remote Collectors, the reported source is the Collector's IP address.
15.8 Configuring Text Message Providers
RUEI supports the use of text message notifications. In order to make use of this facility, all text message providers that you are planning to use must be configured and known to the system. To manage your provider information, select System, then Maintenance, and then Text message providers. The dialog shown in Figure 15-12 appears.
Figure 15-12 Text Message Accounts Dialog
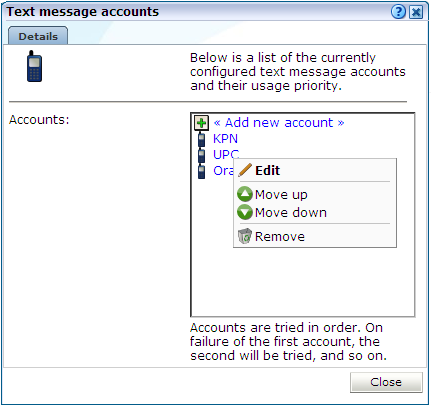
Description of ''Figure 15-12 Text Message Accounts Dialog''
To configure a text message provider, do the following:
-
Click Add new account to define a new text message provider. The dialog shown in Figure 15-13 appears.
Figure 15-13 Select Text Message Provider Dialog
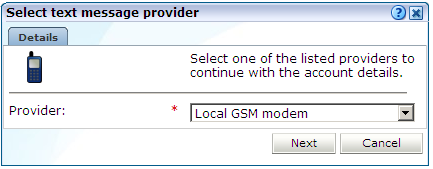
Description of ''Figure 15-13 Select Text Message Provider Dialog''
-
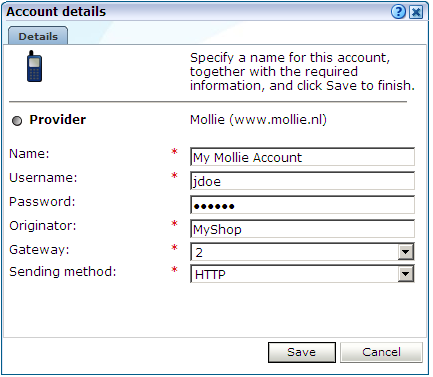
Select the required text message provider from the list. It contains a number of predefined supported services. Each of these require an account with the associated provider. When ready, click Next. A dialog similar to the one shown in Figure 15-14 appears.
Important:
If you specify a local GSM modem, a GSM modem must be installed on the system. The installed local modem must be a USB or serial GSM ETSI 07.05-compliant modem. -
The exact fields available within the dialog depend on the provider selected in Figure 15-13. For example, if you selected a local GSM modem, you are required to specify the local port and baud rate for the modem. If not known, automatic detection is available. Optionally, you can also specify a SIM PIN (if one is required).
-
If you selected the predefined Mollie or Clickatell services, you are required to specify the user name, password, originator, API ID, and protocol sending method used for the account. These should have been supplied to you by your account provider. When ready, click Save. You returned to the dialog box shown in Figure 15-12.
-
Right click the providers in the list and use the Move up and Move down options to control a provider's position in the list. Providers are tried in the order they appear in the list. Hence, the first account is tried and, on failure, the second one, and so on.
-
When ready, click Close to leave the dialog.
While Unicode is supported in text messages, there are a number of restrictions of which you should be aware. In the case of locally installed modems, messages are sent to the modem using the 7-bit GSM 3.38 alphabet. Any unsupported characters in the original message are replaced by a question mark (?) character. In the case of an external service provider, it is recommended that you consult your service provider for information about multi-byte character set support. In the case of both locally installed modems and external service providers, text messages are limited to 160 characters.
15.9 Creating Helpdesk Reports
If you experience problems with the use or operation of RUEI, you can contact Customer Support. However, before doing so, it is strongly recommended that you create a Helpdesk report file of your system. To do so, select System, then Maintenance, and then Helpdesk report. Note that the creation of the Helpdesk may take some time. When completed, you are then prompted to specify a location to which the file should be downloaded.
This file contains extended system information that is extremely useful to Customer Support when handling any issues that you report.
Important:
The generated file contains software proprietary information. Do not attempt to modify its contents.15.10 Working in Session Debug Mode
By default, internal system errors are reported within the user interface with the following generic error message:
An internal system error has occurred. Please contact the Administrator with the error details.
However, if you want to obtain more detailed information about the error, you can enable Session debugging, by do the following:
-
Select the Session debug option from the Help menu. The dialog shown in Figure 15-15 appears.
Note:
The Session debug option only appears in the Help menu if you are logged in as a RUEI Administrator user. -
Check the Enable debugging check box to specify that debugging mode should be enabled. When ready, click Save.
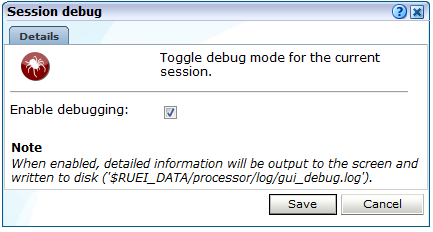
When enabled, a detailed error message is reported. In addition, the message (and its corresponding diagnostics information) is appended to the indicated log file. Note that this setting only applies to your current session.
Note:
It is recommended that the session debugging facility is enabled when reporting errors to Customer Support.15.11 Managing the E-Mail Configuration
As explained in Section 2.3, "Using the Mailing Facility", RUEI can send automatic E-mails of requested reports. This facility uses the information specified during the initial configuration phase (described in the Oracle Real User Experience Insight Installation Guide). However, this configuration can be changed by selecting System, then Maintenance, and then E-mail setup. The dialog shown in Figure 15-16 appears.
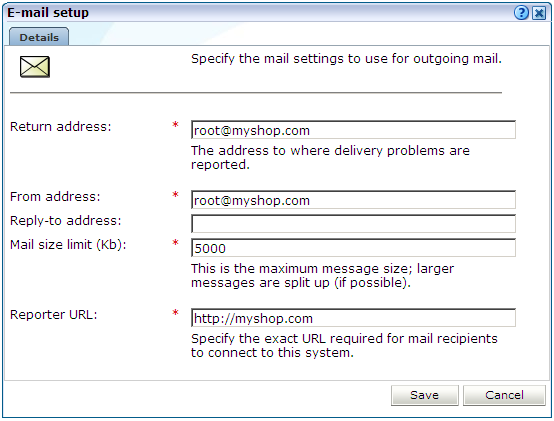
The fields shown in Figure 15-16 are explained in Table 15-5.
Table 15-5 E-mail Setup Fields
| Field | Description |
|---|---|
|
Return address |
Specifies the E-mail address to which failed or problem E-mails are reported. It is strongly recommended that this an address that is regularly checked. |
|
From address |
Specifies the address the recipient sees in their mail client. |
|
Reply-to address |
Specifies the address that users can click within an E-mail to reply to an E-mail. If this is not specified, the From address setting is used. |
|
Mail size limit |
Specifies the maximum message size (in kilobytes) allowed for E-mails. Note that if an E-mail contains reports that exceed this limit, the system will try to split up the reports into individuals E-mails to overcome this limitation. Reports that are too large to be sent individually are not sent, and the user is informed of the problem. The default mail size limit is 5000 Kb. |
|
Reporter URL |
Specifies the exact URL required for E-mail recipients to connect to the Reporter system. Typically, this is the same URL used by RUEI users to access the Reporter system. |
15.12 Resetting the System
If you experience unexplained problems, you can restart processing to ensure that it is operating properly and synchronized. Note that selection of this option will result in a temporary delay in data availability and monitoring.
In the last resort, you can remove all collected data from the system. Alternatively, you can reset all parameters (such as created users and environment parameters) to their out-of-the-box default values.
To reset the system, do the following:
-
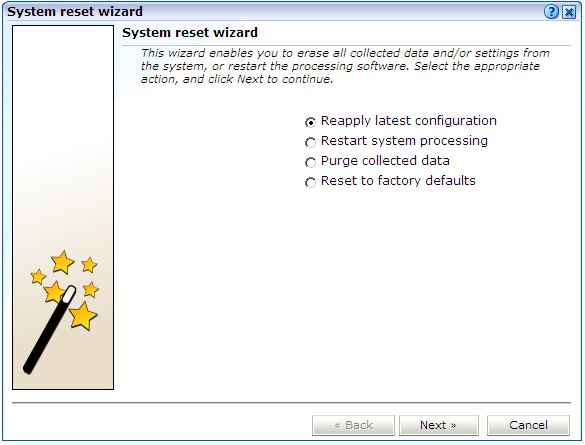
Select System, then Maintenance, and then System reset. The dialog shown in Figure 15-17 appears.
-
Select the required option. These are explained in Table 15-6.
Table 15-6 System Reset Options
Option Description Reapply latest configuration
Ensures that any configuration changes (such as modifications to the
ruei.confconfiguration file) take immediate effect. This is the default.Restart system processing
Reactivates system processing.
Purge collected data
Removes all collected data from the system.
Reset to factory defaults
Removes all collected data and SSL keys, and reset all system parameters to their default values.
When ready, click Next.
Caution:
The Purge collected data and Reset to factory defaults options are irreversible. All collected data will be erased. In the case of Reset to factory defaults, all system settings will also be returned to their original state. Therefore, a complete initial configuration (and the definition of theadmin user password using the set-admin-password.sh script) will be required before you have access to the Reporter interface. If you have previously created a backup (described in Section 15.6, "Creating and Restoring Configuration Backups"), you can restore this backup after initial configuration. This initial configuration procedure is described in the Oracle Real User Experience Insight Installation Guide.15.13 Customizing Data Translations
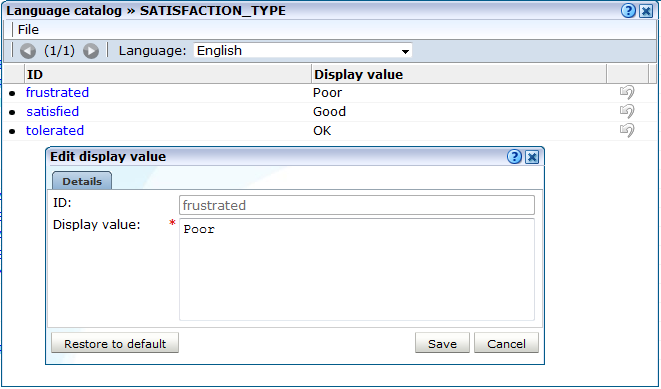
It is possible to customize the data items (such as Data Browser group and field names) in order to meet your specific requirements. It is recommended that you only use this facility if you have a sound knowledge of how RUEI catalogs work.
To customize the data translations used in your deployment, do the following:
-
Select Configuration, then General, then Advanced settings, and then Data translation. A catalog list appears.
-
Click the appropriate data item. The dialog shown in Figure 15-18 appears.
-
Specify your preferred translation. Note that you can click Restore to default to reset the item to its factory default. When ready, click Save.