4 Working With the Session Diagnostics Feature
This chapter explains the use of the session diagnostics feature. This provides a powerful means for Application Managers and IT technical staff to perform root-cause analysis of operational problems. It supports session performance breakdown, including the impact of failing pages and hits on sessions, the full content of each failed page, and the relationship between objects, page views, and sessions. Diagnostics for web services is also available to investigate failed function calls. Note that suite URL diagnostics must be individually enabled in order to make them available. This is described in Section 3.2.5, "Suite URL Diagnostics for Problem Analysis".
4.1 Introduction to Session Diagnostics
When problems are identified, the session diagnostics feature offers a means to drill-down into RUEI's rich data structure and both assess the impact of the problem on your web site's visitors and web service clients, and obtain direct insight into possible causes.
Important:
In order to replay complete user sessions, session recording must be enabled. This is described in Section 13.10, "Controlling Replay Policies".In addition to the information described above, RUEI also offers the opportunity to track exactly what error messages visitors to the monitored web site receive, and when. With this ability to recreate application failures, you can accurately and immediately eliminate annoying and problematic parts of your web pages.
Understanding Session Reporting
Information about user sessions is reported within the session diagnostics feature as user records. It is important to understand that information is reported using a resolution of five minutes. The properties associated with it, such as IP address and user ID, are effectively snapshots taken at the end of the 5-minute period. Note that while the value of these properties can potentially change during the 5-minute period, it is their values at the end of the period that are reported.
To locate the diagnostics information you require, do the following:
-
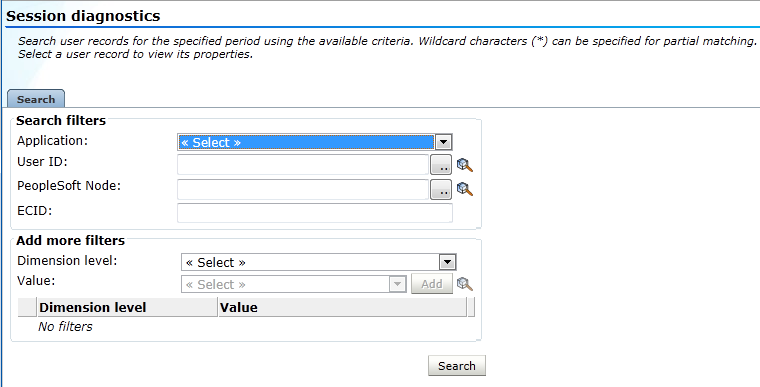
Select Browse data, and select the group from which you want to start, for example All sessions. Diagnostics information is available for the groups shown in Table 4-1, as well as the suite-specific groups (such as Oracle E-Business Suite and Siebel). Click the required diagnostics option (for example, Session diagnostics). Note the name of the option reflects the selected group. A diagnostics panel similar to the one shown in Figure 4-1 appears.
-
Use the Calendar controls (described in Section 2.6, "Using the Calendar") to select the required period. The selected viewing range must be a single day (or less). If you attempt to search outside this limit, an error is reported. The availability of replay content is determined by the associated Collector retention policies (described in Section 13.9, "Defining Collector Data Retention Policies") and Session diagnostics retention setting (described in Section 12.10.1, "Defining Reporter Retention Policies").
-
Use the search facility to locate the required user record(s). The specific criteria available depends on the selected group. The available generic search criteria are shown in Table 4-1. Note that additional dimensions are also available for suite-specific data groups.
Be aware that only the first 100 items are listed within the session window. You can use the Next and Previous controls to scroll through the session list. The Exit diagnostics icon returns you to your position within the Data Browser immediately before you entered the session diagnostics feature. Note that at least one search filter is required.
Table 4-1 Diagnostics Search Criteria
Data Browser Group All sessions Failed pages Failed URLs Service tests Slow URLs Slow functions Failed functions User flow activity User flow completion Application name
•
•
•
Beacon name
•
Client IP address
•
•
•
•
•
Client network
•
ECID
•
•
Object delivery
•
•
•
Object URL
•
•
Page delivery
•
Service delivery
•
•
Service name
•
•
•
User flow name
User ID
•
•
•
•
Optionally, you can specify additional search criteria using the Add more filters facility. As with the primary search criteria, the additional search filter options depend on the selected group. Be aware that all criteria specified for the search must be met for matched user records to be reported. Note that the use of wildcards is supported for all fields.
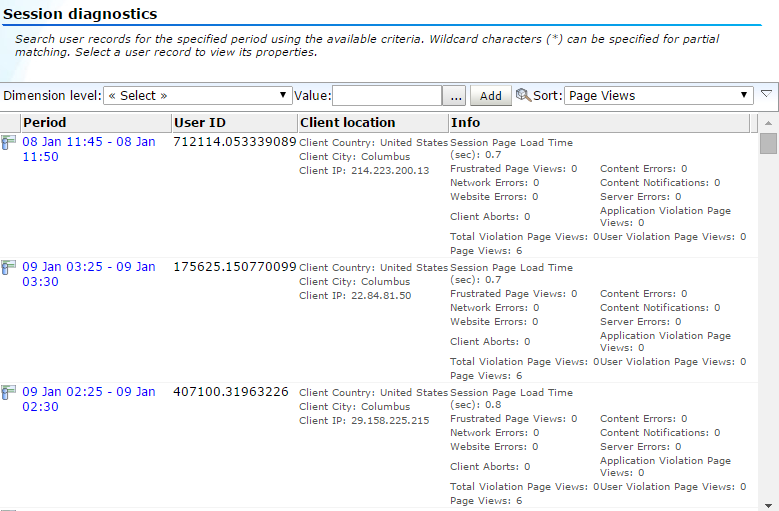
For a number of diagnostics groups, you can also specify the order in which matched user records are reported through the Search result order facility. When ready, click Search. The results of the search are shown in the main part of the window. An example is shown in Figure 4-2.
-
Use the controls in the toolbar at the top of the window to scroll between result pages. The total number of sessions found and the number of pages is displayed beside the page controls, for example "Found 43478 item(s), showing page 1/435".
Use the Sort menu to change the sorting of the results. A maximum of 100 user records are listed per page. You can select a specific user record from the displayed list by clicking it.
Optionally, you can use the Dimension level and Value menus to apply additional filters to the displayed list. When ready, click Add. The options available within the Dimension level menu depends on the selected group.
Note that the use of the Export session option within the user record context menu shown in Figure 4-2 is described in Section 4.4, "Exporting Full Session Information".
When performing Session diagnostics on a URL based group, for example Slow URLs, failures or slow requests are listed instead of sessions. When selected, its associated session is displayed.
-
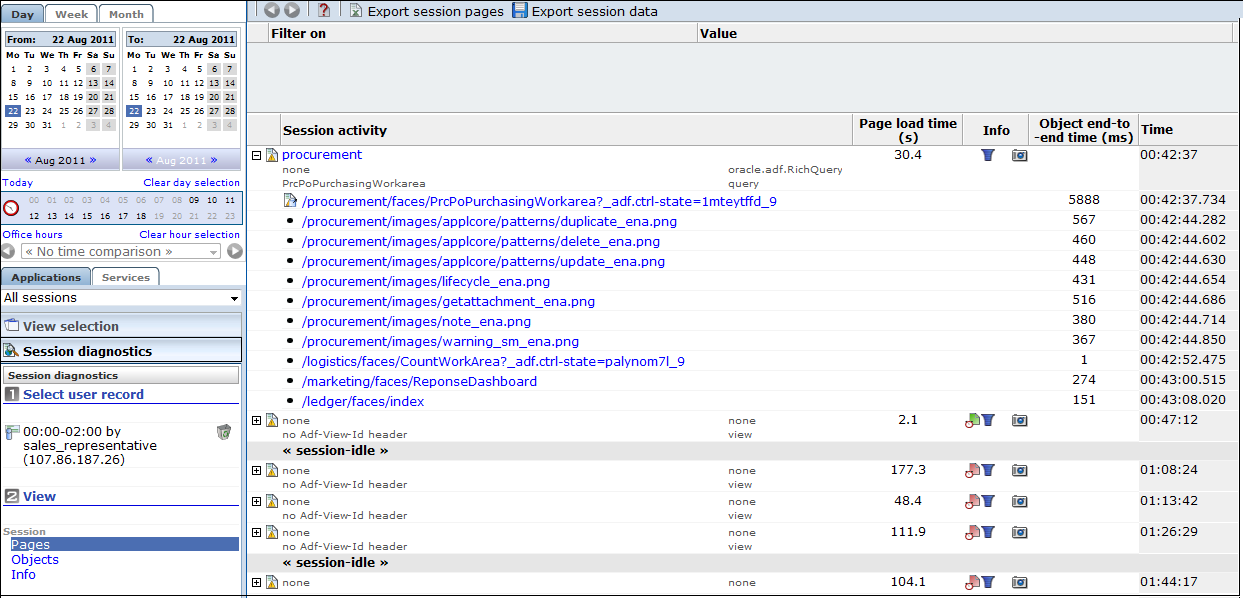
After selecting a user record, the View part of the panel in the left-hand side of the window allows you to view information about the selected user record. Use the Pages, Object, and Info items under the Session part to view information concerning specific aspects of the selected user record. An example is shown in Figure 4-3.
Session pages are grouped so that when expanded their associated objects can be viewed. The overview shows the pages and actions (and their times) recorded within the selected user record. Icons indicate slow or failed objects, page loading satisfaction, whether the pages are key pages, and whether replay content for them is available. The use of the Replay viewer is described in Section 4.2, "Replaying User Sessions".
Note you can use the Include/Exclude spurious objects icon within the toolbar to control whether hits not directly associated with a reported page are included in its displayed list of objects. This facility is particularly useful in the identification of problem objects that have an extremely long load time. Normally, these objects would not have associated pages and, therefore, would not be listed in the session page report.
The Export session pages command button allows you to export a summary of the currently selected user record to Microsoft Excel. The use of this facility is explained in Section 4.3, "Exporting Session Pages to Microsoft Excel".
-
You can click the Pages or Objects option under the View part of the panel to review a summary of pages viewed by the visitor or the objects within them. Clicking an item within the displayed list opens a window with detailed property information.
An example of page properties is shown in Figure 4-4.Figure 4-4 Example Page Properties Dialog
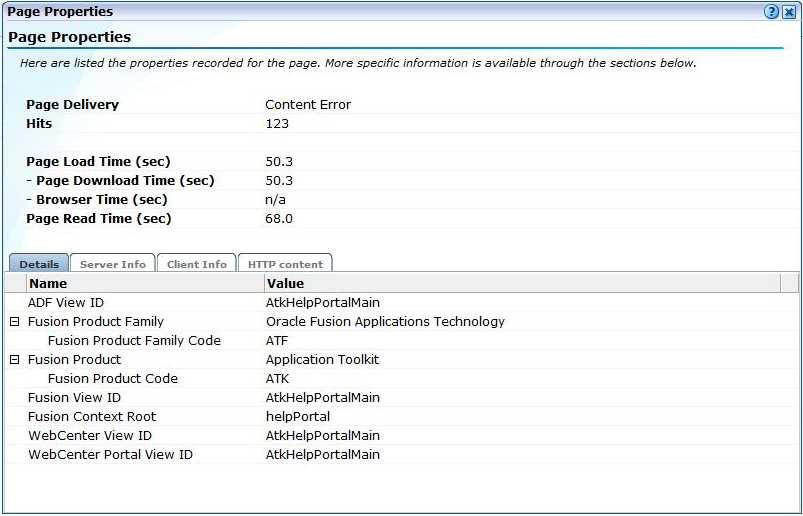
Description of ''Figure 4-4 Example Page Properties Dialog''
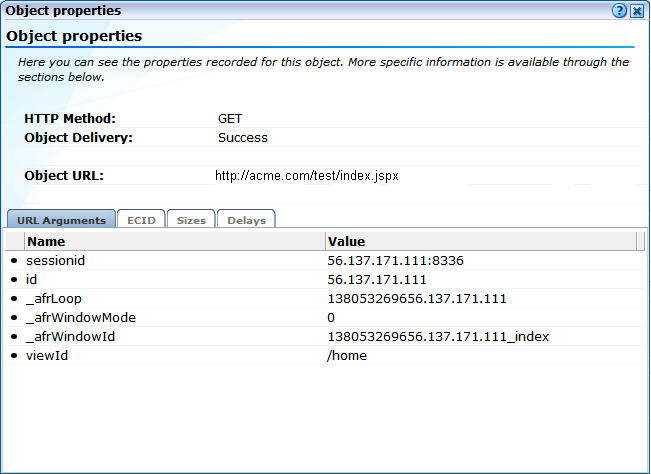
An example of object properties is shown in Figure 4-5.
Figure 4-5 Example Object Properties Dialog
Description of ''Figure 4-5 Example Object Properties Dialog''
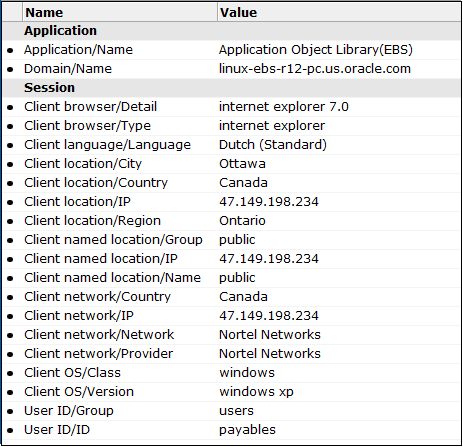
Within the displayed history, the full content, as well as the underlying HTTP code of the messages received by the server and client are also available. Be aware that the reported contents are subject to the currently defined masking options for HTTP protocol items. When available, the ECIDFoot 1 is shown for objects. When relevant, Forms client and server information, as well as client submitted POST messages, is also shown. Detailed application and session-related information about the page or URL is available via the Info option. An example is shown is shown in Figure 4-6.
Note that suite-related information (where relevant) is also shown.
-
When ready, you can click the Remove icon beside the selected user record. You are returned to the diagnostics window shown in Figure 4-2. From here, you can select and drill down into other user records.
Masking Sensitive Information Within the Session Diagnostics Feature
As mentioned earlier, the availability of information (such as header or URL information) within the session diagnostics feature can be controlled through the appropriate HTTP protocol item masking facility. This is described in Section 13.9, "Defining Collector Data Retention Policies".
Web Services in Session Diagnostics
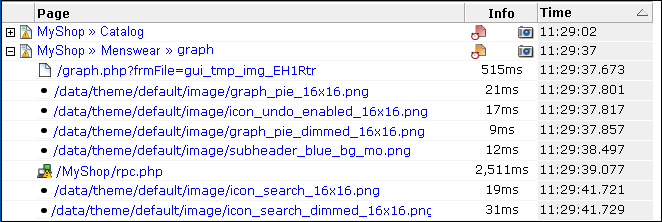
If you have defined a web service which overlaps in the same session as an application, it is reported as part of the session page information. An example is shown in Figure 4-7.
Figure 4-7 Example Web Service Call in Session Diagnostics
Description of ''Figure 4-7 Example Web Service Call in Session Diagnostics''
Note that a web service call can only reported as part of a page, and not as individual page.
User IDs Within User Flow Diagnostics
Within the user flow diagnostics group, two additional user IDs are reported. These are explained in Table 4-2.
4.2 Replaying User Sessions
When available, you can click the Replay icon beside a viewed page to replay the complete user session. This provides the opportunity to review each page viewed by the visitor during the session, together with any reported error messages. An example is shown in Figure 4-8.
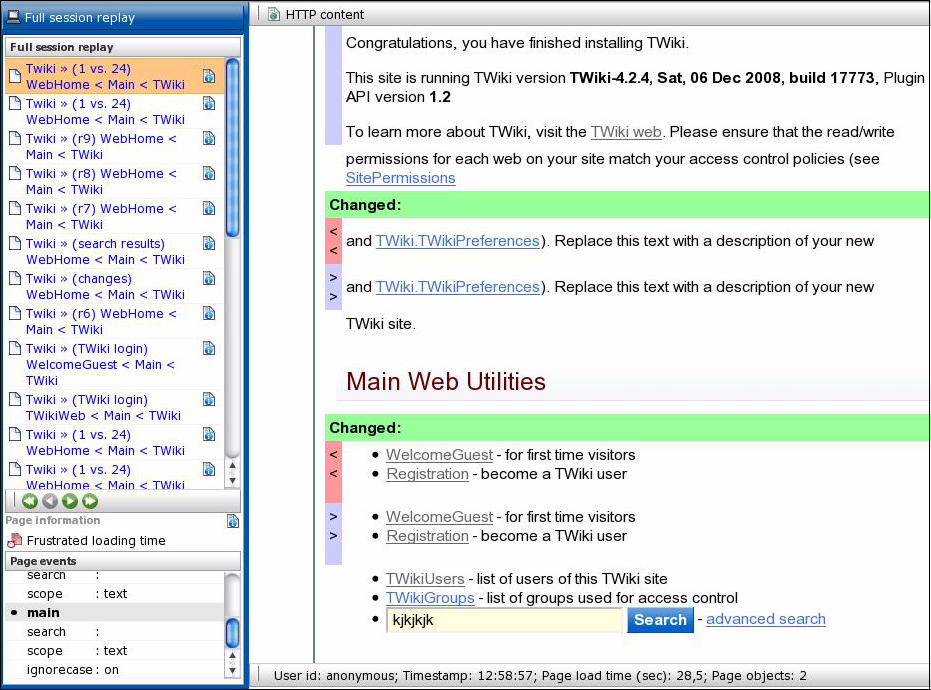
The replay details are shown in a new window which is the same size as the main window. Note that if selected by clicking the Replay icon for a page within a selected user record, the displayed page history starts from the point of the selected page.
The controls below the page listing allow you to navigate through the page history. The Page information section indicates the currently highlighted page's loading satisfaction, whether it is key page, and whether it contains an error.
If a viewed page contained HTTP form elements, these and the visitor replies are reported in the Page events panel. Unnamed elements are reported as "NO_NAME_number" (where number is incremented for each unnamed element). Hidden form elements are also reported. Be aware that the replies made by a visitor to form elements is derived from the request body of the next page in the session page view history. Therefore, if the visitor switched context to another page between the request and response pages, the user response cannot be extracted and reported.
The status bar at the bottom of Figure 4-8 provides information about the session user ID, each page's recorded timestamp, loading time, number of objects and (in the case of static pages) an indication that reported pages are retrieved from the live source (such as the application server).
The HTTP content command button on the toolbar allows you to view the actual request and response content of the currently selected page. An example is shown in Figure 4-9.
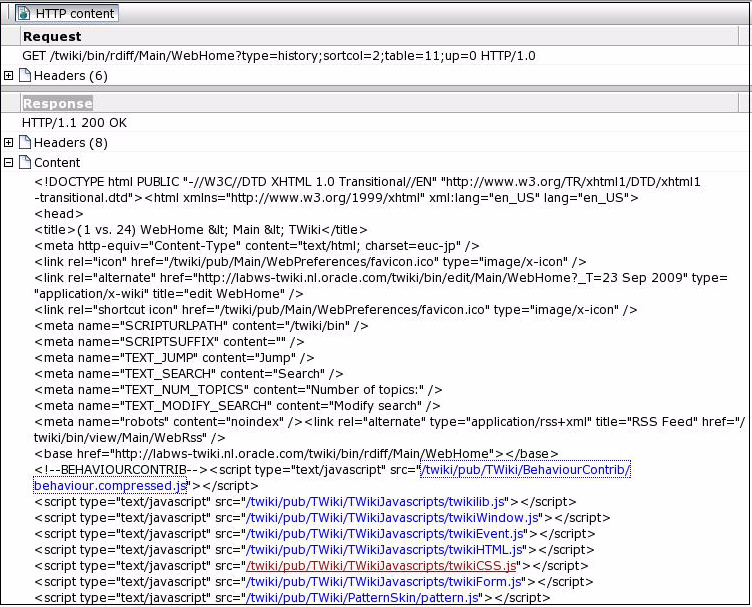
Note that external JavaScript files can also be viewed by clicking the link within the page content. The reported content of these files is retrieved from the live source (for example, an application server).
If no Replay icon is available beside a page in the displayed viewing history, this indicates that the page's content is not available. This can be because the information is expired due to data storage constraints, or because the viewed page was a static page. In the case of the latter, you can still view the static page's content by highlighting the page immediately before or after the static page in the viewing history, and via this page, view the static page's content.
Be aware that the reported content for the objects on a static page is retrieved from the live source. Hence, if the live source is not available for any reason, the page's content may not be correctly reported. In addition, data masking and JavaScript execution rules are not applied to any page contents retrieved from the live source. The page contents are shown "as is". Note that if a static page was cached at the client, an earlier complete page fetch for any session is used for the preview. Therefore, depending upon the configuration of the monitored web site, this may have been modified since the visitor actually viewed the page. For example, a page listing current stock market prices. When live source data is reported, this is indicated in the Replay status bar.
JavaScript Execution Within the Replay Viewer
Pages viewed by visitors can contain inline JavaScript code. The application definition facility allows you to specify how execution of this JavaScript code should be handled within the replay facility. This is fully described in Section 7.3.22, "Controlling JavaScript Replay Execution". In addition, be aware that suites (such as Siebel and PeopleSoft) have preconfigured JavaScript execution rules that optimize their reporting within the Replay viewer.
Applications that make use of a Rich Internet Application (RIA) framework (such as Ajax) may have reduced replay capability.
4.3 Exporting Session Pages to Microsoft Excel
You can export a summary of the pages within the currently selected session to Microsoft Excel. To do so, do the following:
-
Select the required session using the procedure described earlier. Click the Export session pages command button. Depending on how your browser is configured, you are either prompted to specify the tool with which to open the file directly (by default, Microsoft Excel), or it is immediately saved to the defined default location.
-
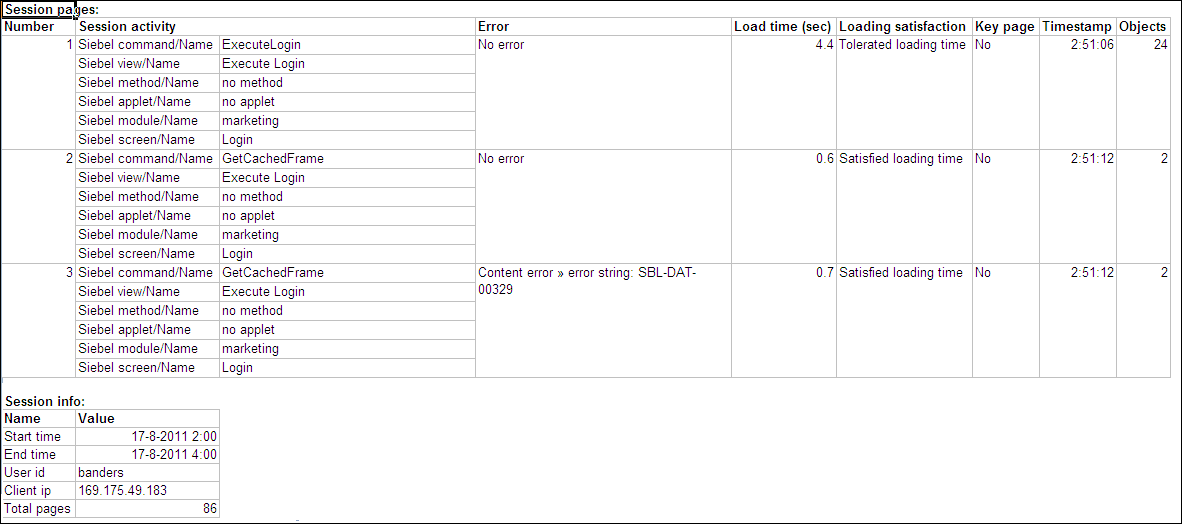
Within Microsoft Excel, you can view and edit the generated file. An example is shown in Figure 4-10.
Figure 4-10 Example Microsoft Excel Session Pages Export
Description of ''Figure 4-10 Example Microsoft Excel Session Pages Export''
The exported page view history and session summary can be used to compile sets of real-user sessions. For example, to be used as the basis for testing or performance analysis.
Controlling Row Creation and Ordering
Be aware that the rows (and their order) that appear in the Microsoft Excel export are based on the currently selected Session Diagnostics dimensions template. This is described in Section 4.5, "Controlling Dimension Listing Within Session Diagnostics".
4.4 Exporting Full Session Information
In addition to viewing session information, you can also export complete session contents to external utilities for further analysis or integration with other data. For example, this offers the opportunity to use complete real-user sessions as the basis for test script generation. Test platforms, such as Oracle Application Testing Suite (ATS), can easily be configured to generate automated test scripts for an application's most commonly encountered usage scenarios.
In addition, this facility can also be used to support powerful root-cause analysis. Complete user session information can be provided to application or operations specialists to help identify unusual or difficult to isolate issues. Sensitive information within the exported data is masked according to the actions defined in the HTTP protocol item masking facility. This is described in Section 13.6, "Masking User Information".
To export session information, do the following:
-
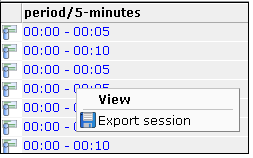
Locate the required session and select the Export session option from its context menu. This is shown in Figure 4-11.
Alternatively, within the session details page, click the Export session data command button. In either case, a dialog appears prompting you to confirm exportation of the selected session.
It is important to understand that the exported data may contain sensitive information. It is recommended that you carefully review the session's contents to ensure that sensitive information has been correctly masked. To confirm export of the selected session, click Yes.
-
Depending on how your browser is configured, you are either prompted to specify the location to which the zip file should be saved, or it is immediately saved to the defined default location.
In order for the session export files to be created correctly, you should ensure that:
-
The exported session is not older than the Full Session Replay (FSR) setting (as described in Section 13.9, "Defining Collector Data Retention Policies").
-
The URL prefix masking setting is specified as "Complete logging" (as described in Section 13.10, "Controlling Replay Policies").
In addition, it is recommended that you verify the exported content files (described in the following section) are present before attempting to import an exported RUEI session into an external utility.
Understanding the Structure of the Exported Data
The exported session zip file contains the following files:
-
data.tab: contains the direct (raw) hit information for the selected session extracted from the Collector log file. -
page.tab: contains the direct (raw) page information for the selected session extracted from the Collector log file. -
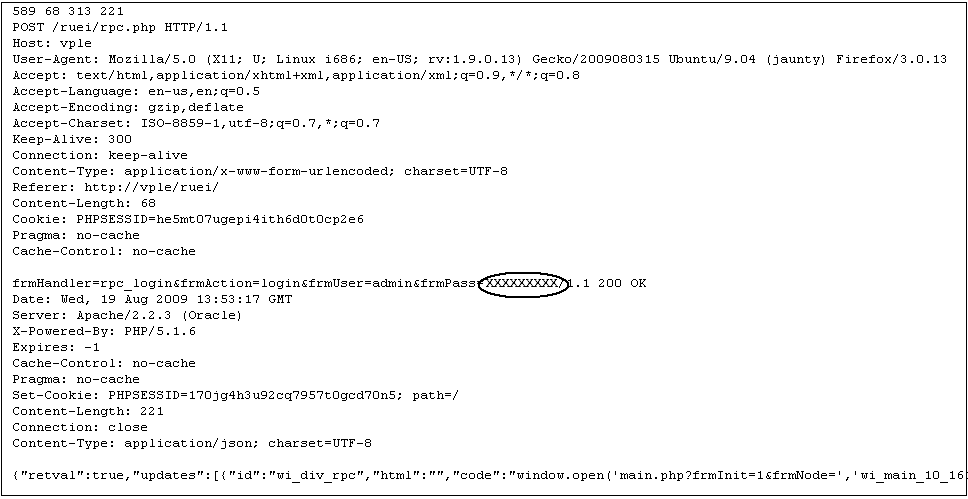
content_hitno.tab: contains the complete (raw) content information for the indicated hit. There is a file for each hit within thedata.tabfile that has content. For example, if the third and sixth hits had content available for them, two files would be created:content_3.tabandcontent_6.tab. An example of a hit file is shown in Figure 4-12.Figure 4-12 Example Hit Information File
Description of ''Figure 4-12 Example Hit Information File''
The first line within the file (in this case, 589 68 313 221) contains four integers that indicate respectively the length (in bytes) of the request header, the request body, the response header, and the response body. In addition, note how the user's password has been masked in the file.
Viewable versions of the files cited in the hit file are also available under the
content_viewerdirectory. This means that data transferred with chunked encoding can be immediately viewed. Note that the samehitnoas in thedata.tabfile is used in their file naming. -
index.html: allows developers and other interested parties outside RUEI to view and analyze session details as they would appear within the Session diagnostics feature, with access to source, page and object details, and element identification.
Note:
The log files used as the basis for creating exported session files are also used internally by RUEI. The format and contents of these files is subject to change without notice.Note:
Within Internet Explorer, depending on your security settings, you may receive a warning that ActiveX controls have been disabled when opening a session export file.4.5 Controlling Dimension Listing Within Session Diagnostics
The values of specific page, action, and custom dimensions are displayed within the Session activity part of the Session Diagnostics window. If necessary, mouseover text is available for each reported value to view its associated dimension level. An example is shown in Figure 4-13.
Figure 4-13 Example Session Diagnostics Dimension Listing
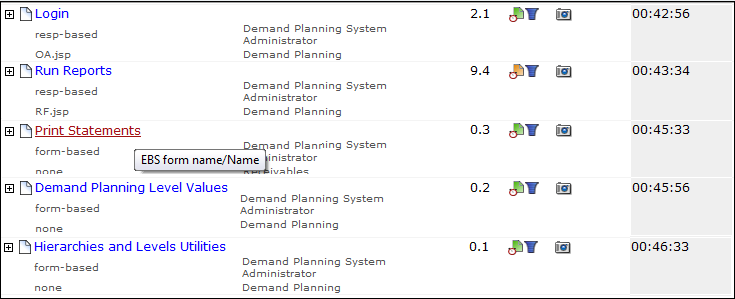
Description of ''Figure 4-13 Example Session Diagnostics Dimension Listing''
The specific dimensions, and their order, reported for applications and suites are controlled via templates. There are two kinds of template: system and user. System templates are provided with the product installation. The only modification that can be made to them is the order of the listed dimensions. Note that system templates can only be modified by an Administrator, and any changes made to them will apply to all system users. User templates can be modified by individual users to meet their own requirements. Users must be authorized to access the Session Diagnostics before they can modify their templates.
Modifying Dimension Templates
To modify a dimension template, do the following:
-
From the System menu, select Preferences, and then Session display. The dialog shown in Figure 4-14 appears.
Figure 4-14 Edit Dimension Listing Dialog
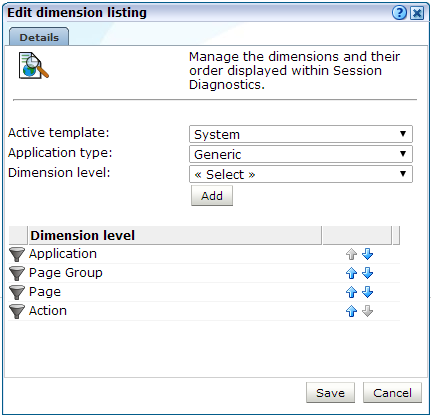
Description of ''Figure 4-14 Edit Dimension Listing Dialog''
-
Use the Active template menu to select whether you want to modify a system or user template.
-
Use the Application type menu to select whether you want to modify the template for generic (that is, applications that are not suite-based applications) or for a specific suite type. If the latter, you will need to specify the suite type.
-
In the case of user templates, you can use the Dimension level menu to select the additional dimension that you want reported in the Session activity section. When ready, click Add.
-
For both system and user templates, you can use the Move up and Move down controls to modify the order in which dimensions should be listed.
Understanding how Templates are Applied
Each page view reported by Session Diagnostics has an associated application type. This is used to automatically load the appropriate dimension template. Any changes you make to a user or system template are automatically applied to an open Session Diagnostics window.
4.6 Configuring Clickouts to External Tools
The URL diagnostics group (described in Section 3.2.2, "Problem Analysis Groups"), the suite diagnostics groups (described in Section 3.2.5, "Suite URL Diagnostics for Problem Analysis"), and Session Diagnostics (described in Section 4.1, "Introduction to Session Diagnostics") support clickout from selected functional URLs and certain dimensions to external diagnostics utilities. The supported external utilities are shown in Table 4-3.
| Utility | Description |
|---|---|
|
Depending on your installed Oracle Enterprise Manager middleware and application management packs, the following options can be used:
|
|
|
Oracle Business Transaction Management (BTM) is a utility that brings real-time visibility to business transactions. It enables organizations to identify and resolve transaction errors, failures, and bottlenecks, or respond quickly to prevent an isolated problem from turning into a global outage. Options:
|
|
|
EBS |
Refers users to the server overview or user search facility within the EBS plug-in. Options:
|
|
Siebel |
Refers users to the server overview or user search facility within the Siebel plug-in. Options:
|
|
JD Edwards |
Refers users to the JD Edwards EnterpriseOne Server Manager Console, providing information on all user activity associated with the session user. Options:
To use this facility, the JSESSIONID cookie must be logged in RUEI as a plain cookie. To ensure this setting is correct:
|
|
Searches the Oracle Customer Services' web site (My Oracle Support) for relevant information about specific reported errors. For example, ORA-12154 or SBL-UIF-00271. Option:
Use of this facility requires a working My Oracle Support registration. Further information is available at the following location: https://support.oracle.com/CSP/ui/flash.html |
Footnote 1 An ECID is a request header used to track requests as they move through the Oracle Application Server architecture. It is especially useful for diagnostics purposes.
Supported Earlier Versions
Table 4-4 shows the clickout options available for earlier supported versions of Oracle Enterprise Manager.
Table 4-4 Clickout Options for Supported Earlier Versions
Configuring Clickout Functionality
To configure access from within RUEI to these utilities, do the following:
-
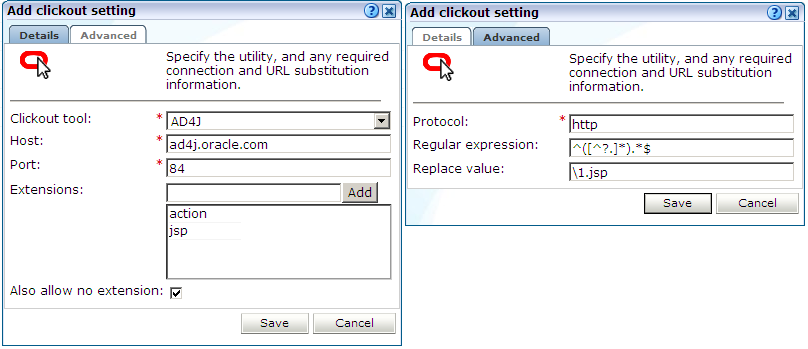
Click the Configuration tab, then General, then Advanced settings, and then Clickout settings. Note that this option is only available to Administrators. Click Add new item or an existing external utility definition. A dialog similar to the one shown in Figure 4-15 appears.
-
Use the Clickout tool menu to select the external utility whose interface you want to configure. The supported utilities are shown in Table 4-3. Note that the other fields available within the dialog depend on the selected utility.
-
Use the Host field to specify how the selected external utility should be reached. This should not include the protocol scheme (such as
http://). For example,ruei-camm.oracle.com. -
Use the Port field to specify the required port number. Only one port number can be specified. A wildcard character (*) cannot be specified.
-
Use the Extensions entry field to specify the object file extensions for which clickout should be available. Use the Add button to specify additional extensions. You can also use the Also allow no extension check box to specify whether hits with no associated file extensions should have clickout availability.
-
Click the Advanced tab, and use the Protocol field to specify whether HTTP or HTTPS is used for connection to the selected utility. By default, HTTP is used.
-
Use the Regular expression and Replace fields to specify the parts of the URL passed to the external application that should be replaced. Further information on the use of regular expressions is available from Knowledge Base articles within the My Oracle Support web site. This is available at the following location:
https://support.oracle.com/CSP/ui/flash.html
When ready, click Save. Any changes made to these settings are applied immediately.
Application and Suite Configuration
For each required application, specify the functional URLs that support clickout. This is described in Section 7.3.21, "Controlling Reporting Within the Problem Analysis Group".
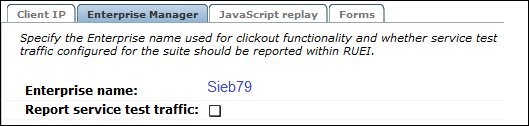
For Siebel suites the Enterprise name must be specified as part of a suite's configuration in order for clickout functionality to be available. This is described in Section 10.1, "Working With Suites".
The defined Enterprise name can be located by selecting the appropriate suite, then clicking the Advanced tab, and then the Enterprise Manager tab. An example is shown in Figure 4-16.
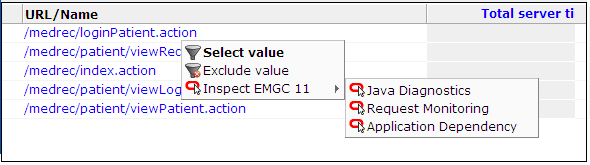
Access to Clickout Functionality
Clickout functionality for Data Browser items is available via the item's context menu. The exact options available to you depend on the Data Browser group, the selected dimension, and the defined clickout settings. An example is shown in Figure 4-17.
4.7 Monitoring Business Applications
The creation and monitoring of business application targets within Oracle Enterprise Manager offers Application Performance Management (APM) capabilities to maximize the performance and availability of your business-critical applications. These are managed targets that provide an intuitive representation of the relationship between your applications and business transactions and the underlying IT infrastructure. The RUEI-monitored components that comprise these business applications provide information across the enterprise, and facilitate central monitoring of their structure, status, availability, dependencies, and performance.
Footnote Legend
Footnote 1: The ECID is used to track requests as they move through the Oracle Fusion Middleware architecture. This is especially useful for diagnostic purposes.