A Box Plot provides a capsule summary of metric values for each value of a selected String attribute.
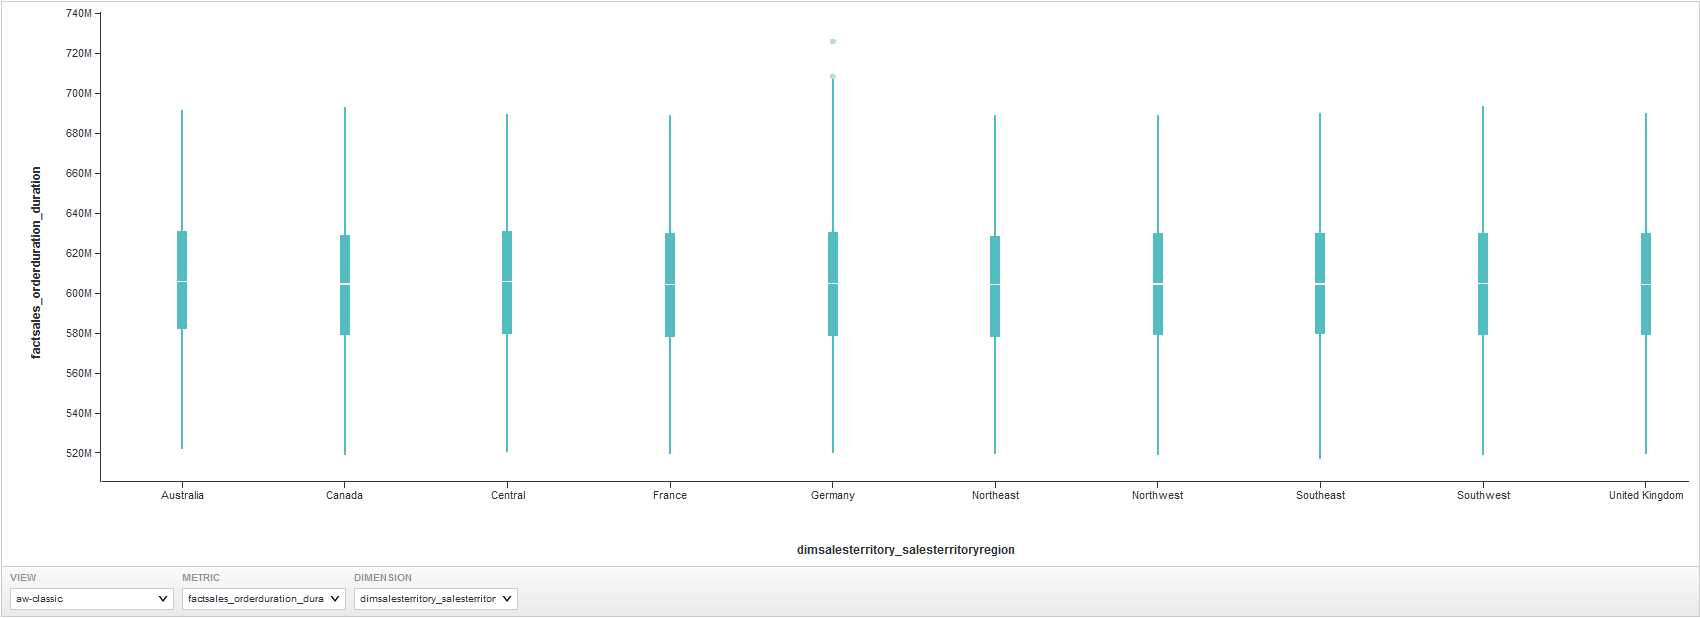
For example, you can show a summary of the values for sales cycle duration plotted by region, as above.
For each dimension value, the
Box Plot displays a box showing:
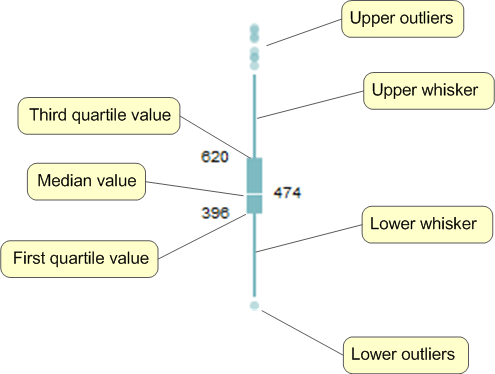
- First and third quartile metric values for that dimension value
- Median metric value for that dimension value
- Upper and lower whisker
lines.
To calculate the end points of the whisker lines, Big Data Discovery first gets the difference of the third and first quartile values, then multiplies it by 1.5.
For the lower whisker line, it then subtracts the resulting value from the first quartile value. The lower whisker line also cannot extend past the absolute minimum value.
For the upper whisker line, it adds the value to the third quartile value. The upper whisker line also cannot extend past the absolute maximum value.
- Any outlier values that fall above or below the whisker line end points. The chart always includes the single lowest outlier and single highest outlier in order to show the full range of values.
