A Parallel Coordinates Plot displays the values of several metrics for each value of a single grouping dimension.
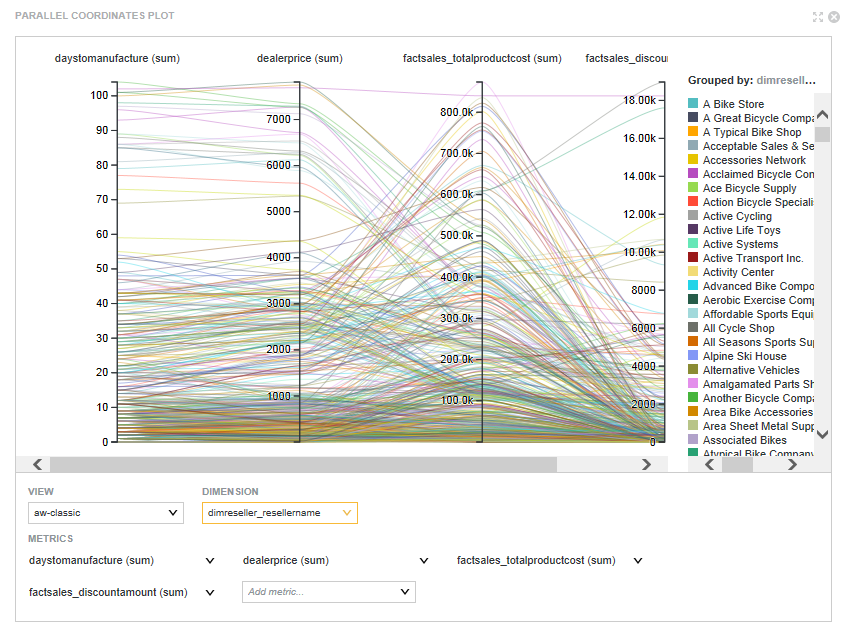
On the chart:
- Each metric is represented by a vertical axis.
- Each dimension value is
represented by a colored line, which crosses each metric axis based on the
metric value for the dimension value.
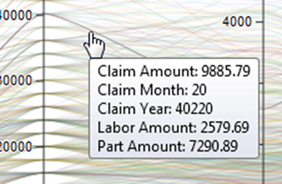
To focus on the metric values for a specific dimension value, hover the mouse over either a specific line or a specific entry in the chart legend.
The line for that dimension value is highlighted, and the rest of the lines grayed out. A tooltip displays listing the metric values.
For example, a Parallel Coordinates Plot could display the average price, average rating, number of cylinders, and average mileage for each value of car model.
