6. Reports
This chapter deals with the various BIP reports that are available for the Credit Appraisal Management origination process. The reports that are available are:
- Horizontal / Vertical Analysis Report
- Benchmarks Report
To generate any of these reports go to Task tab, Under Origination menu, choose Reports. A list of reports in Origination module will be displayed. You can choose to View or Print the report on clicking of the particular report.The selection options that you specified while generating the report a printed at the beginning of every report.
This chapter contains the following topics:
- Section 6.1, "Generating Horizontal or Vertical Analysis Reports "
- Section 6.2, "Generating Benchmark Reports"
- Section 6.3, "Pipeline Analysis Report"
6.1 Generating Horizontal or Vertical Analysis Reports
You can compare the financial ratios with previous Quarter / year using ‘Horizontal or Vertical Analysis Report’ screen. The system will allow you to select the customer no, financial year, Quarter / Year and the type of the comparison like compare with previous quarter, last year quarter and previous year.
You can invoke this screen by typing ‘ORRFACTR’ in the field at the top right corner of the Application tool bar and clicking the adjoining arrow button.
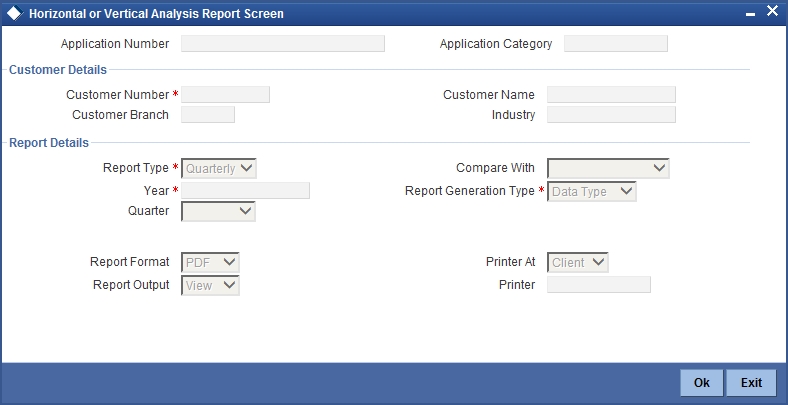
You can enter the following in this screen:
Customer Details
Customer Number
Specify the customer number whose financial ration needs to be compared. The adjoining option list displays all the accounts maintained in the system. Select the appropriate one.
Customer Name
The system will display the customer name. whenever you select customer number.
Customer Branch
The system will display the customer branch. whenever you select customer number.
Industry
The system will display the customer industry. whenever you select customer number.
Report Details
Report Type
Specify the type of the report from the drop-down list and the available options are:
- Quarterly
- Yearly
Year
Specify the financial year which is taken for the report generation.The adjoining option list displays all the years maintained in the system. Select the appropriate one.
Quarter
Specify the quarter which is taken for the report generation from the drop-down list and the available options are:
- Quarter1
- Quarter2
- Quarter3
- Quarter4
- All
Compare With
Select the option with which report can be compared from the drop-down list and the available options are:
- Previous Quarter
- Next Quarter
- Last Year Quarter
- Previous Year
- Last 2 years
- Last 3 Years
Report Generation Type
Select the type report generation from the drop-down list and the available options are
- Data Type
- Graph Type
Report Format
Select the format of the report from the drop-down list and the available options are:
- HTML
- Excel
- RTF
Report Output
Select the output of the report from the drop-down list and the available options are:
- View
- Spool
Printer At
Specify the printer at from the drop-down list and the available options are:
- Client
- Server
Printer
Specify the printer name. The adjoining option list displays all the printers maintained in the system. Select the appropriate one.
6.2 Generating Benchmark Reports
You can compare the financial ratios with predefined benchmark ratios using ‘Benchmark Report Screen’ screen. The system will allow you to select the customer number, financial year and the type of the comparison like compare with Quarter1/Quarter2/Quarter3/Quater4/Last year etc.
You can invoke this screen by typing ‘ORRBENCH’ in the field at the top right corner of the Application tool bar and clicking the adjoining arrow button.
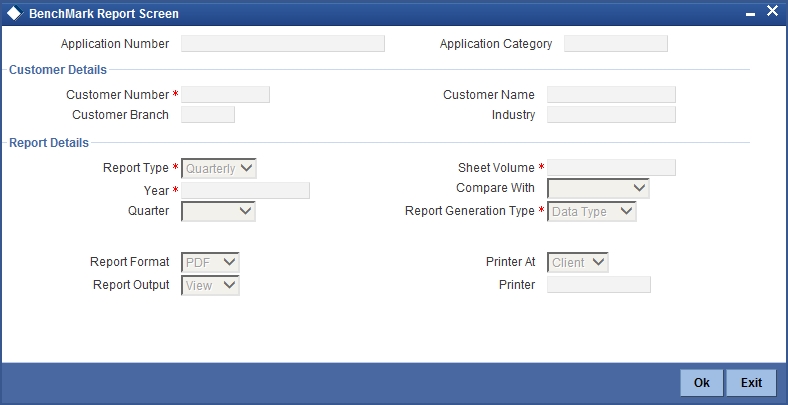
You can enter the following in this screen:
Customer Details
Customer Number
Specify the customer number whose financial ration needs to be compared. The adjoining option list displays all the customer numbers maintained in the system. Select the appropriate one.
Customer Name
The system will display the customer name. whenever you select customer number.
Customer Branch
The system will display the customer branch. whenever you select customer number.
Industry
The system will display the customer industry. whenever you select customer number.
Report Details
Report Type
Select the type of the report from the drop-down list and the available options are:
- Quarterly
- Yearly
Year
Specify the financial year which is taken for the report generation.The adjoining option list displays all the years maintained in the system. Select the appropriate one.
Quarter
Select the quarter which is taken for the report generation from the drop-down list and the available options are:
- Quarter1
- Quarter2
- Quarter3
- Quarter4
Sheet Volume
Specify the sheet volume of the report.The adjoining option list displays all the sheet volumes maintained in the system. Select the appropriate one.
Compare With
Select the option with which report can be compared from the drop-down list and the available options are:
- Previous Year
- Last 2 Years
- Last 3 Years
Report Generation Type
Select the type report generation from the drop-down list and the available options are
- Data Type
- Graph Type
Report Format
Select the format of the report from the drop-down list and the available options are:
- HTML
- Excel
- RTF
Report Output
Select the output of the report from the drop-down list and the available options are:
- View
- Spool
Printer At
Select the printer at from the drop-down list and the available options are:
- Client
- Server
Printer
Specify the printer name. The adjoining option list displays all the printers maintained in the system. Select the appropriate one.
6.3 Pipeline Analysis Report
This section contains the following topics:
- Section 6.3.1, "Generating Pipeline Analysis Report"
- Section 6.3.2, "Financial Ratio Analysis Report"
- Section 6.3.3, "Questionnaire Report"
- Section 6.3.4, "External Agency Analysis"
- Section 6.3.5, "Exposure Analysis Report"
6.3.1 Generating Pipeline Analysis Report
The application provides a facility to generate analytical reports based on comparison of the qualitative factors, quantitative factors, and risk factors on the pipeline facilities of prospective customers. Based on these pre-defined analytical reports, the reviewer or approver can analyse each individual pipeline facility and approve or reject the facilities accordingly. The following pipeline facility analysis reports are pre-defined in the application:
- Financial Ratio Analysis Report: This report is generated based on the financial ratios and financial statements maintained by the bank.
- Questionnaire Report: This report is generated based on the questionnaires maintained by the bank, the credit score, and grade which are computed based on the answers provided by the prospective customers.
- External Agency Report: This report is generated based on the external agency grades and scores.
- Exposure Analysis Report: This report analyses exposure on pipeline opportunities / tasks. This analysis includes exposure on currency, customer, and sector level exposure.
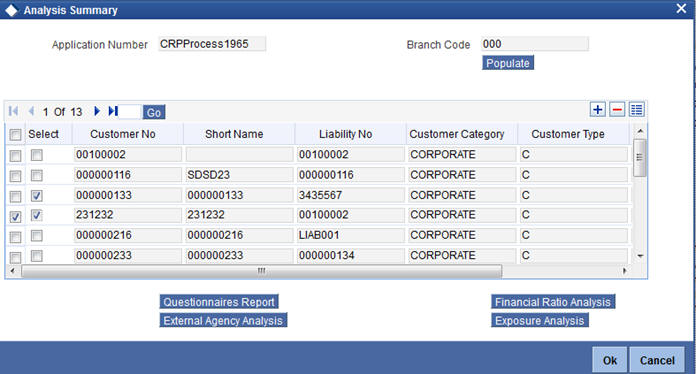
To view these reports, invoke the ‘Analysis Summary’ screen.
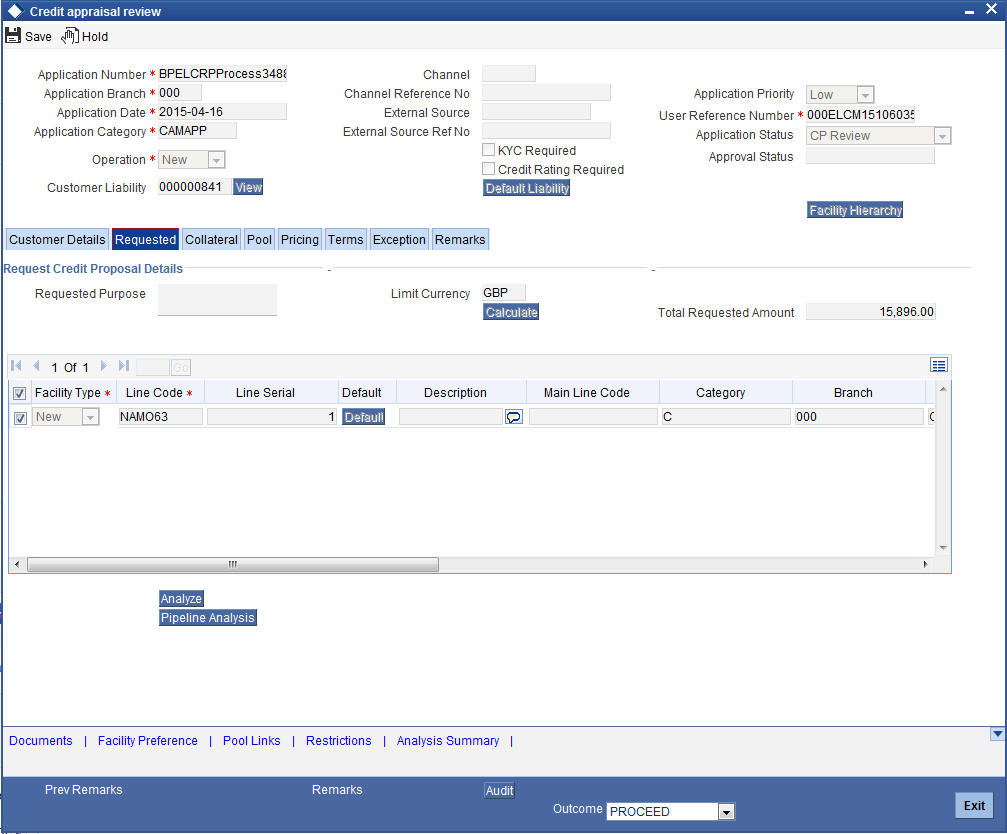
This screen is available as a button as a part of the Credit Appraisal Management process and can be invoked during the following stages of the Credit Appraisal Management process.
- Credit Recommendation and Review (ORDLPREV)
- Approval (ORDLPAPR)
To process the pipeline analysis data, click the ‘Pipeline Analysis’ button available in the ‘Requested Tab’ at the ‘Credit Recommendation and Review’ stage and the ‘Approval’ Stage. You can subsequently generate the pipeline analysis reports by clicking the ‘Analysis Summary’ button.
The following details are displayed in this report:
Application Number
The system displays the application reference number of the prospective customers.
Branch Code
The system displays the branch code from the adjoining option list.
On the click of the ‘Populate’ button the system populates the list of pipeline facilities and the corresponding prospective customer details. This button is applicable only for generating the Questionnaire Report for specific customers. For the remaining reports, you need not click this button. The following details are populated on clicking this button:
Select
Select a customer or customers based on which the questionnaires report is generated.
Customer Number
The system displays the identification number of the prospective customer.
Customer Name
The system displays the customer name of the prospective customer.
Liability Number
The system displays the liability number of the prospective customer.
Category
The system displays the category of the customer such as corporate and so on.
Type
The system displays the type of customer.
Balance Sheet Size
The system displays the balance sheet size which is classified based on the amount range.
To view the reports click any one of the following buttons:
- Financial Ratio Analysis Report
- Questionnaires Report
- External Agency Analysis Report
- Exposure Analysis Report
Details on the each of these reports are provided in the subsequent sections.
6.3.2 Financial Ratio Analysis Report
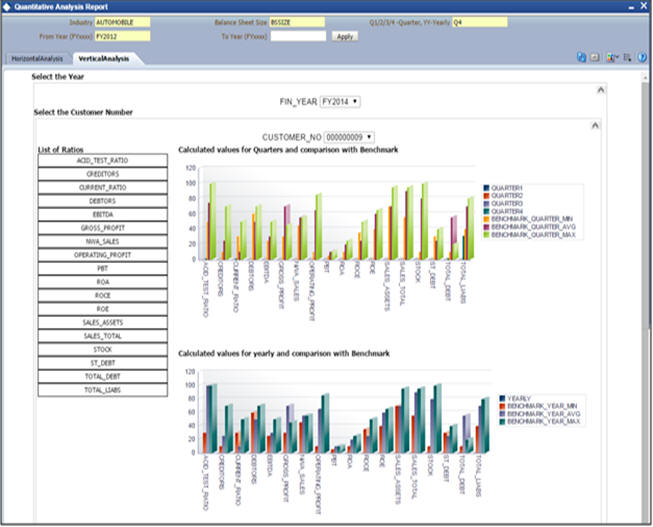
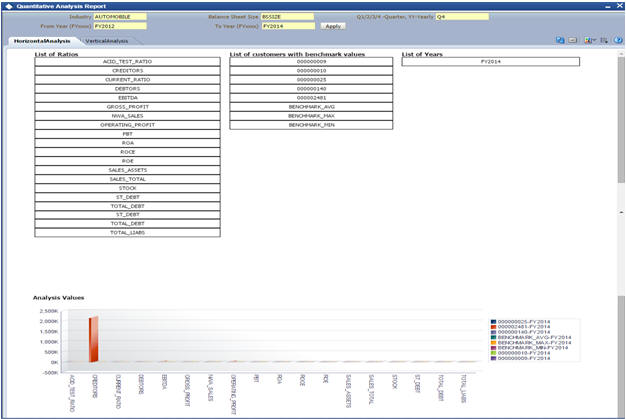
The Financial Ratio Analysis Report is a financial ratio comparison report generated for selected prospective customers. The financial ratios calculated from the balance sheet are compared and a report is generated. This report includes financial ratios like liquidity ratio, asset or liability ratio and so on. The reports compare financial ratios between prospective customers across quarters and across years. It also provides a comparison between the customer’s financial ratio against the benchmark ratios maintained by the bank. The inputs for this reports are the financial ratio data, prospect customers data, and financial years, on the basis of which the report is generated.
You can define the rules to maintain the financial ratios, which are taken as an input from the balance sheet, cash flow statements or statement of retained earnings. These rules can be defined in the ‘Credit Ratio Maintenance’ (ORDRATMT) screen.
For more information on this screen, refer to the section ‘Credit Ratio Maintenance’ in the Origination Maintenances User Manual.
The financial statements of the prospective customers, like balance sheet, cash flow statement and so on, are uploaded at the application entry or the credit enrichment stage. Subsequently, the financial ratios are computed based on the template maintained.
Click the ‘Financial Ratio Analysis’ button appearing in the ‘Analysis Summary’ screen during the following stages in the Credit Appraisal Management process:
- Credit Recommendation and Review (ORDLPREV)
- Approval (ORDLPAPR)
The report consists of the two sections which are as follows:
Header Section
Column Name |
Description |
Industry |
Displays the industry name |
From Year |
Displays the starting year |
To Year |
Displays the ending year |
Balance Sheet Size |
Displays the size of the balance sheet |
Quarter |
Displays the financial quarter for which the data is being displayed. |
Tabular Section
Column Name |
Description |
Financial Year |
Displays the financial year |
Financial Quarter |
Displays the financial quarter for which the data is being displayed. |
Financial Ratio |
Displays the name of the financial ratio. |
Customer Number |
Displays the customer number of the customer whose data is being displayed. |
Customer Name |
Displays the name of the customer. |
Value |
Displays the ratio value of the customer. |
You can filter your report data as per the following search parameters:
- Industry
- Balance Sheet Size
- Financial Quarter
- Financial Year
These filters can be modified by the user as per the business requirement.
Note
When balance sheet size is not captured as a part of the report, then the system will show only the uploaded details. The benchmark details will not generated in the report.
As mentioned earlier there are two types of graphical reports that are generated:
- Comparison between prospective customers across quarters and years.
- Comparison between customer’s financial ratios and the benchmark ratios.
6.3.3 Questionnaire Report
The pipeline facilities of a prospective customer can be approved or rejected by the bank based on the analysis of the qualitative factors. The application allows you to generate a qualitative report based on the questionnaires, the answers provided by the customer to the questionnaires and the subsequent grades and scores.
The questions, possible answers, and the corresponding scores are maintained in the Rule Maintenance screen (ORDRULMT). The questions are defaulted during the credit analysis stage which allows you to capture answers from the prospective customer.
For more information on the Rule Maintenance Screen refer to the section ‘Maintaining Credit Rating Rules’ in the Origination Maintenance User Manual.
In the ‘Analysis Summary’ screen, on the click of the ‘Populate’ button the system populates the list of pipeline facilities and the corresponding prospective customer details. This button is applicable only for generating the Questionnaire Report for specific customers. You can click two or more customers by clicking the ‘Select’ check box to generate a questionnaires comparison report. You can alternatively, deselect the ‘Select’ check box and generate a questionnaires report for all customers for a specific application number.
Click the ‘Questionnaire Report’ button in the ‘Analysis Summary’ screen to view the questions, answers provided by the customer and the assigned score. This comparison report can be generated to compare the score between two prospective customers or more than two prospective customers.
The following fields are populated in this report:
Comparison between 2 Customers
Header Section:
The header contains the customer number.
Tabular Section
Column Name |
Description |
Question - Category |
Displays the category of the question |
Questionnaire |
Displays the description of the question. |
Customer A |
Displays the answers of customer A. |
Score A |
Displays the score of customer A. |
Customer B |
Displays the answers of customer B. |
Score B |
Displays the score of customer B. |
Comparison on more than 2 Customers
Header Section:
The header contains the customer number.
Tabular Section
Column Name |
Description |
Customer Number |
Displays the customer number. |
Application Number |
Displays the application number of the customer. |
Question Category |
Displays the category of the question. |
Questionnaires |
Displays the description of the question. |
Customer Answer |
Displays the answers of customer. |
Score |
Displays the score of customer. |
6.3.4 External Agency Analysis
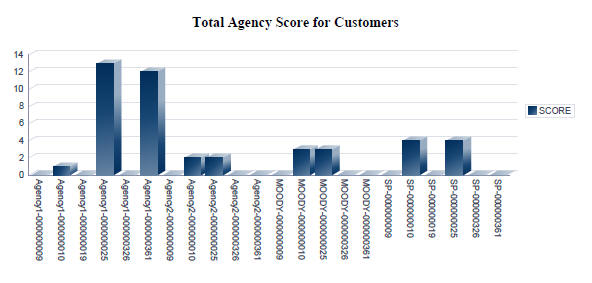
Another qualitative factor based on which the pipeline facilities of prospective customers can be analysed, are the grades and scores provided by external agencies. The external agency grades and scores are captured during the Credit Recommendation and Review Stage of the Credit Appraisal Management process. Click the ‘External Agency Analysis Report’ to view the list of prospective customers whose facilities are awaiting approval, which is grouped based on the customer’s score and the customer’s credit rating grade provided by an external agency. This report displays the following data:
Header Section:
The header contains the customer number.
Tabular Section
Column Name |
Description |
Application Number |
Displays the application number of the customer. |
Customer Number |
Displays the customer number. |
Agency Code |
Displays the agency code of the customer. |
Score |
Displays the agency score of customer. |
Facility Amount |
Displays the line amount. |
There are two types of graphs generated:
Comparison of all pipeline applications based on the customer score provided by the external agency.
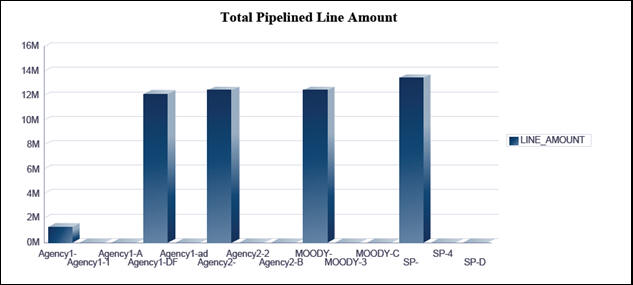
Comparison of the calculated grades and scores for each customer is displayed in a graphical format.
6.3.5 Exposure Analysis Report
In the ‘Exposure Analysis Report’ the pipeline facilities are grouped under the same exposure type such as currency, customer, and sector. This report provides an overall summary of facilities belonging to a specific exposure type. Click the ‘Exposure Analysis Report’ button in the ‘Analysis Summary’ screen during the following stages in the ‘Credit Appraisal Management’ process, to generate the Exposure Analysis Report:
- Credit Recommendation and Review (ORDLPREV)
- Approval (ORDLPAPR)
You can generate the following exposure reports as part of the pipeline facility analysis:
- Overall Exposure v/s Sanction Amount v/s Utilization
- Summary of Pipeline Facilities
- Summary of Expiring Facilities within the next 6 months
6.3.5.1 Overall Exposure v/s Sanction Amount v/s Utilization
This report displays the overall exposure and utilization of the exposure to which the pipeline facility belongs to. It also displays the sum of the facility amount which is sanctioned or approved for that specific exposure category
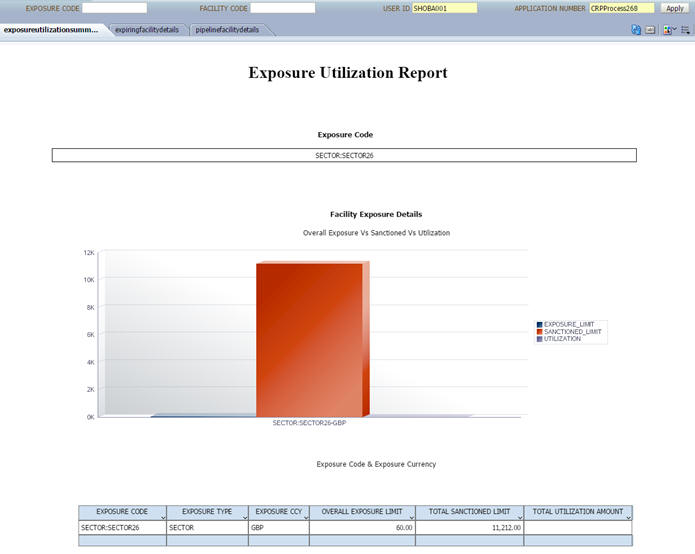
Header Section
Column Name |
Description |
Facility |
Displays the pipeline facility code |
User ID |
Displays the user ID of the user accessing the report. |
Exposure Code |
Displays the exposure code. |
Application Number |
Displays the application number of the facility. |
Tabular Section
Column Name |
Description |
Exposure Code |
Displays the code of the exposure |
Exposure Type |
Displays the exposure type. |
Overall Limit |
Displays the overall limit of the exposure. |
Total Utilization Amount |
Displays the utilization of the exposure |
Total Sanctioned Limit |
Displays the sanction limit. |
Exposure Currency |
Displays the exposure currency |
6.3.5.2 Summary of Pipeline Facilities
This report displays the list of pipeline facilities which are falling on the selected pipeline facility’s exposure category
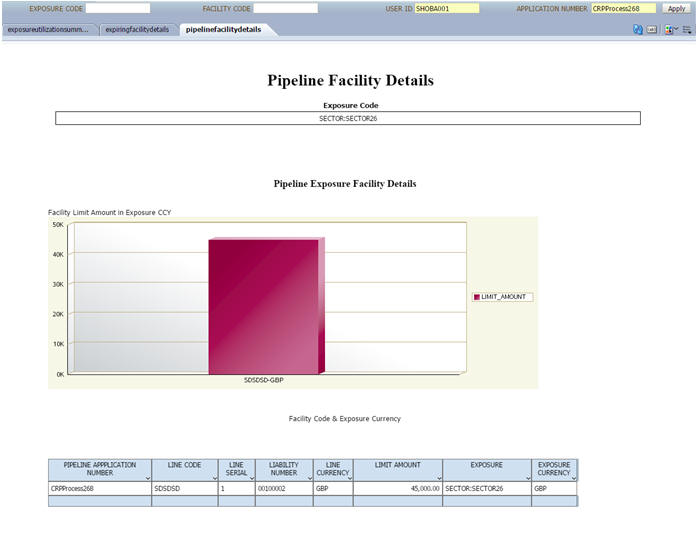
facility’s exposure category.
In this report, the following fields are populated:
Header Section
Column Name |
Description |
Facility |
Displays the pipeline facility code |
User ID |
Displays the user ID of the user accessing the report. |
Exposure Code |
Displays the exposure code. |
Application Number |
Displays the application number of the facility. |
Tabular Section
Column Name |
Description |
Pipeline Application Number |
Displays the application number of the facility. |
Line Code |
Displays the line code. |
Line Serial |
Displays the serial number of the line code. |
Liability Number |
Displays the liability number of the line. |
Line Currency |
Displays the currency of the line. |
Limit Amount |
Displays the amount of the line. |
Exposure |
Displays the type of exposure. |
Exposure Currency |
Displays the exposure currency. |
6.3.5.3 Summary of Expiring Facilities within the next 6 months
This report displays a list of facilities, falling on the selected pipeline facility’s exposure category which would expire within a span of 6 months. This enables you to analyse the list of facilities belonging to a specific exposure category, which may expire in the near future.
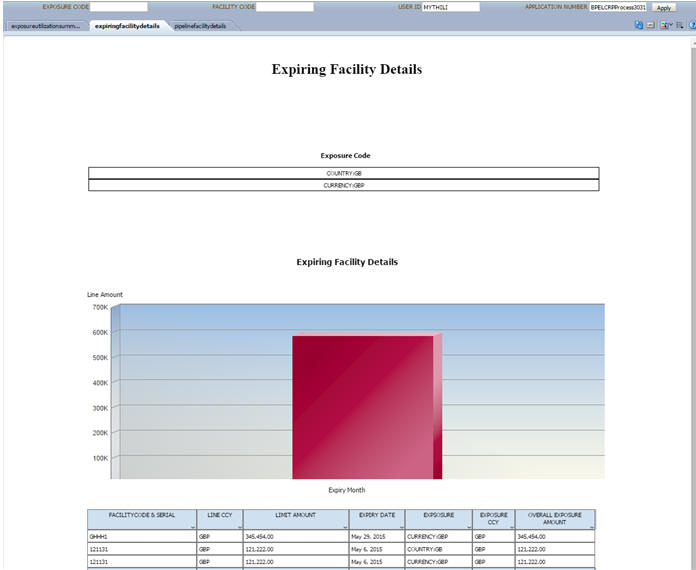
In this report, the following fields are populated:
Header Section
Column Name |
Description |
Facility |
Displays the pipeline facility |
Exposure Code |
Displays the exposure code |
Application Number |
Displays the application number of the pipeline facility. |
User ID |
Displays the User ID of the user accessing the reports. |
Tabular Section
Column Name |
Description |
Facility Code and Serial Number |
Displays the pipeline facility code with the serial number. |
Line Currency |
Displays the facility line currency |
Limit Amount |
Displays the facility limit amount |
Expiry Date |
Displays the expiry date of the facility. |
Exposure- Country |
Displays the country of exposure for the pipeline facility. |
Exposure - Currency |
Displays the currency of exposure for the pipeline facility. |
Overall Exposure Amount |
Displays the total exposure amount. |