2. Customer Economic Dependency Analysis Reports
2.1 Introduction
As a part of the Credit Appraisal Management Process, the system provides the facility to capture the customer’s economic dependency details like supplier details, lender details, borrower details and so on. These details are maintained in the ‘Customer Economic Dependency Details’ screen (ORDCEDM). Based on the customer’s dependency details maintained in the ‘Customer Economic Dependency Details’ screen (ORDCEDM), you can generate reports to analyse the customer’s economic dependency. For more information these maintenance screens, refer to the Origination Maintenance User Manual.
This chapter contains the following topic:
2.2 Customer Economic Dependency Analysis Reports
This section contains the following topics:
- Section 2.2.1, "Generating Customer Economic Dependency Analysis Report"
- Section 2.2.2, "Supplier Concentration Report"
- Section 2.2.3, "Consumer Concentration Report"
- Section 2.2.4, "Lender Concentration Report"
- Section 2.2.5, "Borrower Concentration Report"
- Section 2.2.6, "Share Holder Contribution Report"
- Section 2.2.7, "Guarantor Concentration Report"
- Section 2.2.8, "Share Holding Concentration Report"
- Section 2.2.9, "Entity Relationship Dependency Report"
- Section 2.2.10, "Applicant Overall Dependency Report"
- Section 2.2.11, "Applicant Dependency Report"
- Section 2.2.12, "Entity Overall Dependency Report"
- Section 2.2.13, "Currency Level Overall Dependency Report"
- Section 2.2.14, "Country Level Overall Dependency Report"
2.2.1 Generating Customer Economic Dependency Analysis Report
To generate Customer Dependency Analysis reports, you can invoke the ‘Customer Economic Dependency Report’ screen by typing ‘ORRECODP’ in the field at the top right corner of the Application tool bar and clicking the adjoining arrow button.
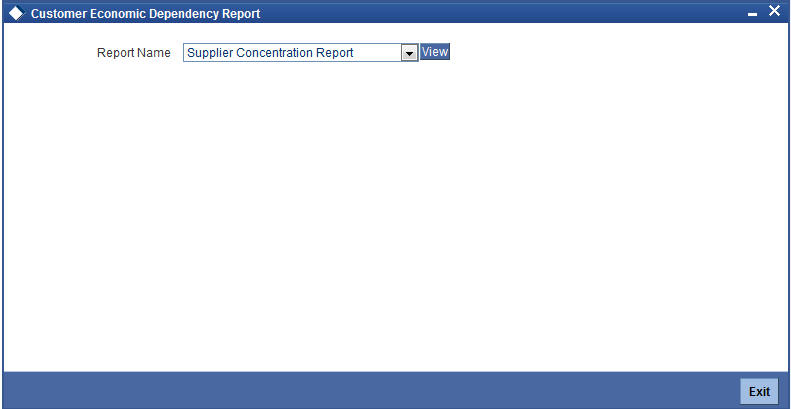
Select an appropriate report category from the drop down list in the ‘Report Name’ field and click the View button to view the report under each reporting category. There are 13 reporting categories provided in this screen. Details on each reporting category is provided in subsequent sections.
2.2.2 Supplier Concentration Report
In this reporting category, the following reports are displayed:
- Supplier Dependency Report
- Supplier Contribution Report
- Supplier Trending Report
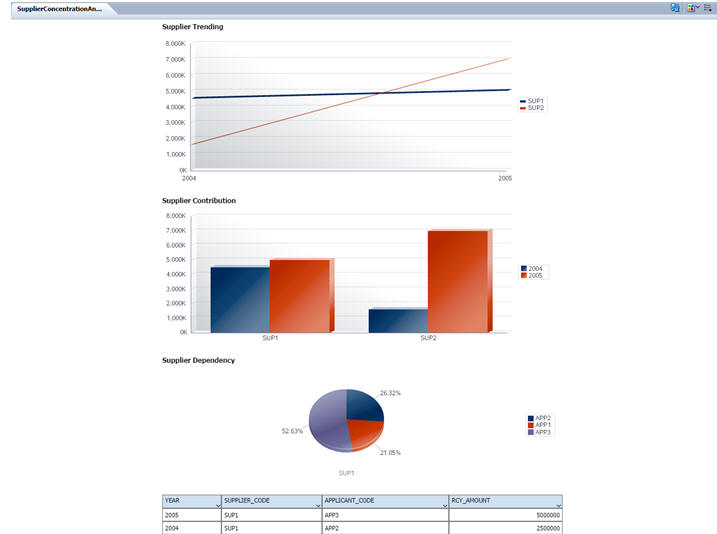
2.2.2.1 Supplier Dependency Report
This report displays the number of bank customers who are dependent on the selected supplier and their corresponding contribution percentage is also displayed. This report is displayed as a pie chart. You can filter the reporting criteria on the basis of the following search parameters:
- Supplier Code
- Supplier Name
- Entity Exposure Type
The pie chart displays the contribution of the selected supplier across all of the bank’s customers in the current year.
2.2.2.2 Supplier Contribution Report
This report displays the overall contribution of all suppliers with respect to the bank’s customers for a particular year. This report is displayed as a bar chart plotted against the contribution of raw materials across all of the bank’s customers.
2.2.2.3 Supplier Trending Report
This trend analysis report displays the contribution of suppliers over a period of time across all of the bank’s customers.This report displays the contribution of suppliers to the bank’s customers over the period of 5 years which include the current year, the performance of last 2 years, and forecast for the next two years.
2.2.3 Consumer Concentration Report
In this reporting category, the following reports are displayed:
- Consumer Dependency Report
- Consumer Contribution Report
- Consumer Trending Report
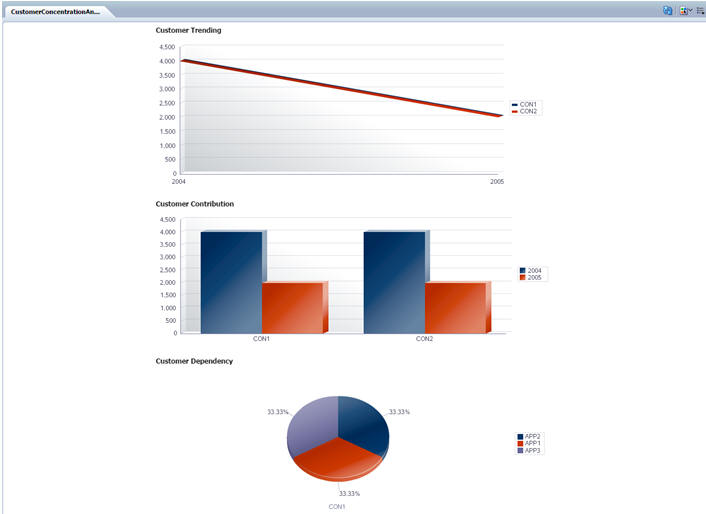
2.2.3.1 Consumer Dependency Report
This report displays the number of bank customers who are dependent on the selected consumer and their corresponding contribution percentage is also displayed. This report is displayed as a pie chart. You can filter the reporting criteria on the basis of the following search parameters:
- Customer Code
- Customer Name
- Entity Dependency Type
The pie chart displays the total customer revenue contribution of the selected customer across the bank’s customers for the current year.
2.2.3.2 Consumer Contribution Report
This report displays the percentage of overall contribution with respect to all customers/consumers who are supporting the bank’s customers. This bar chart is plotted against the total revenue contribution of the consumer across the bank’s customers for the current year.
2.2.3.3 Consumer Trending Report
This report displays the contribution of the consumer over a period of time across all of the bank’s customers. This trend analysis report displays the contribution of the consumer’s revenue for bank customers over the period of 5 years which include the current year, the performance of last 2 years, and forecast for the next two years.
2.2.4 Lender Concentration Report
In this reporting category, the following reports are displayed:
- Lender Dependency Report
- Lender Contribution Report
- Lender Trending Report
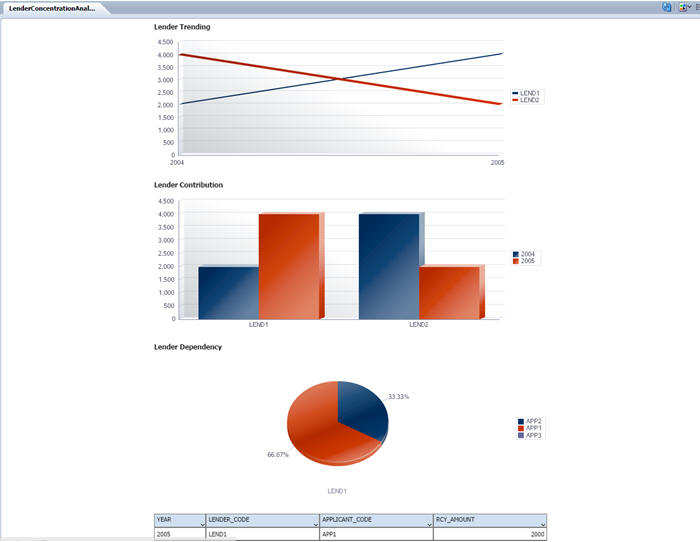
2.2.4.1 Lender Dependency Report
This report displays the number of bank customers who are dependent on the selected lender and their corresponding contribution percentage is also displayed. This report is displayed as a pie chart. You can filter the reporting criteria on the basis of the following search parameters:
- Lender Code
- Lender Name
- Entity Dependency Type
The pie chart displays the contribution of the lender across the bank’s customers for the current year.
2.2.4.2 Lender Contribution Report
This report displays the percentage of overall contribution with respect to lenders who are supporting the bank’s customers. This bar chart is plotted against the total contribution, that is the total debt outstanding amount of the lender across the bank’s customers for the current year.
2.2.4.3 Lender Trending Report
This report displays the contribution of the lender over a period of time across all of the bank’s customers. This trend analysis report displays the contribution or the total debt outstanding amount of the lender over the period of 5 years which include the current year, the performance of last 2 years, and forecast for the next two years.
2.2.5 Borrower Concentration Report
In this reporting category, the following reports are displayed:
- Borrower Dependency Report
- Borrower Contribution Report
- Borrower Trending Report
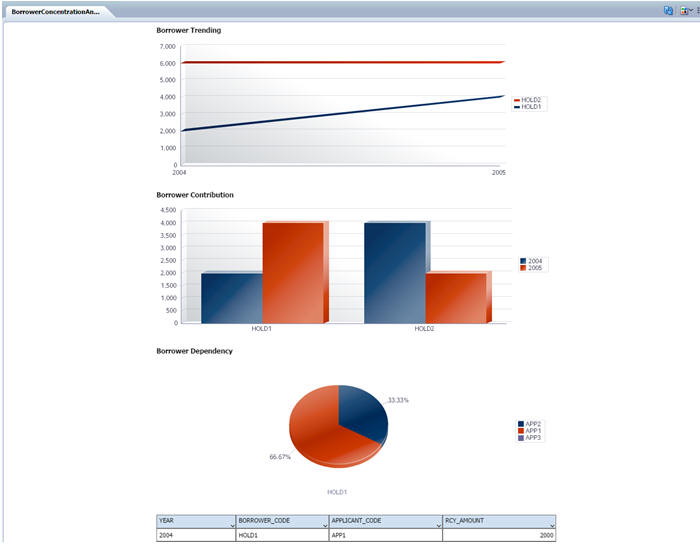
2.2.5.1 Borrower Dependency Report
This report displays the number of bank customers who have provided loan to the selected borrower and their corresponding contribution percentage is also displayed. This report is displayed as a pie chart. You can filter the reporting criteria on the basis of the following search parameters:
- Borrower Code
- Borrower Name
- Entity Dependency Type
The pie chart displays the contribution of the borrower across the bank’s customers for the current year.
2.2.5.2 Borrower Contribution Report
This report displays the percentage of overall contribution with respect to all borrowers who have borrowed loans from the bank’s customers. This bar chart is plotted against the total contribution, that is the total loan outstanding amount of the lender across the bank’s customers for the current year.
2.2.5.3 Borrower Trending Report
This report displays the contribution of the borrower over a period of time across all of the bank’s customers. This trend analysis report displays the contribution or the total loan outstanding amount of the borrower over the period of 5 years which include the current year, the performance of last 2 years, and forecast for the next two years.
2.2.6 Share Holder Contribution Report
In this reporting category, the following reports are displayed:
- Share Holder Dependency Report
- Share Holder Contribution Report
- Share Holder Trending Report
2.2.6.1 Share Holder Dependency Report
This report displays the number of bank customers who are dependent on the selected share holder and their corresponding contribution percentage is also displayed. This report is displayed as a pie chart. You can filter the reporting criteria on the basis of the following search parameters:
- Share Holder Code
- Share Holder Name
- Entity Dependency Type
The pie chart displays the contribution of the shareholder’s holding amount across the bank’s customers for the current year.
2.2.6.2 Share Holder Contribution Report
This report displays the percentage of overall contribution with respect to all shareholders who are supporting the bank’s customers. This bar chart is plotted against the total contribution, that is the total holdings amount of the share holder across the bank’s customers for the current year.
2.2.6.3 Share Holder Trending Report
This report displays the contribution of the share holder over a period of time across all of the bank’s customers. This trend analysis report displays the contribution of the share holder over the period of 5 years which include the current year, the performance of last 2 years, and forecast for the next two years.
2.2.7 Guarantor Concentration Report
In this reporting category, the following reports are displayed:
- Guarantor Dependency Report
- Guarantor Contribution Report
- Guarantor Trending Report

2.2.7.1 Guarantor Dependency Report
This report displays the number of bank customers who are dependent on the selected guarantor and their corresponding contribution percentage is also displayed. This report is displayed as a pie chart. You can filter the reporting criteria on the basis of the following search parameters:
- Guarantor Code
- Guarantor Name
- Entity Dependency Type
The pie chart displays the contribution of the guarantor holding amount across the bank’s customers for the current year.
2.2.7.2 Guarantor Contribution Report
This report displays the percentage of overall contribution with respect to all guarantors that are supporting the bank’s customers. This bar chart is plotted against the total contribution, that is the total guarantee amount of the guarantor across the bank’s customers for the current year.
2.2.7.3 Guarantor Trending Report
This report displays the contribution of the guarantor over a period of time across all of the bank’s customers. This trend analysis report displays the contribution of the guarantor over the period of 5 years which include the current year, the performance of last 2 years, and forecast for the next two years.
2.2.8 Share Holding Concentration Report
In this reporting category, the following reports are displayed:
- Holdings Dependency Report
- Holdings Contribution Report
- Holdings Trending Report
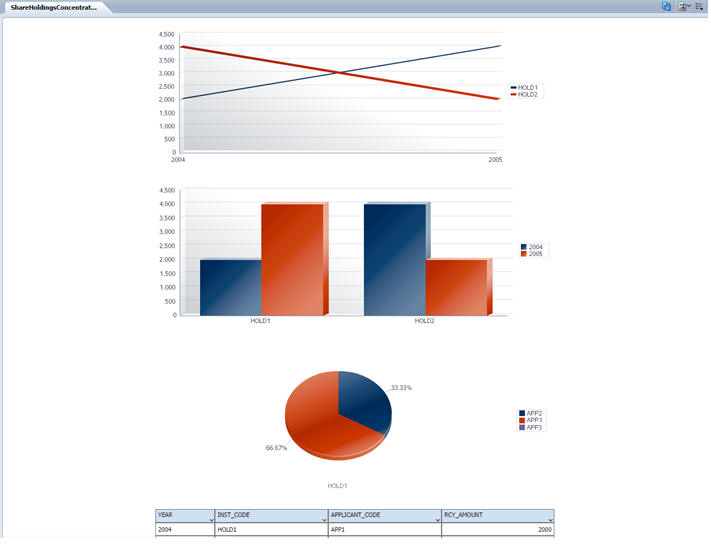
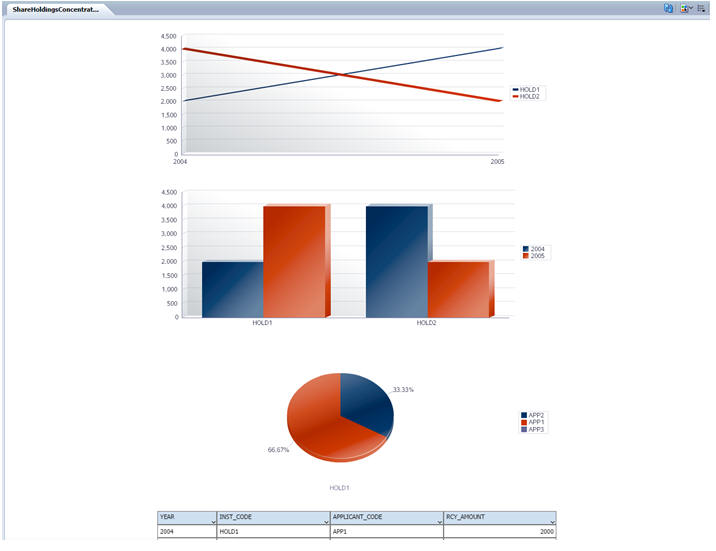
2.2.8.1 Holdings Dependency Report
This report displays the number of bank customers who are holding the selected customer’s shares and their corresponding contribution percentage is also displayed. This report is displayed as a pie chart. You can filter the reporting criteria on the basis of the following search parameters:
- Holdings Code
- Holdings Name
- Entity Dependency Type
The pie chart displays the contribution of the share holdings across the bank’s customers for the current year.
2.2.8.2 Holdings Contribution Report
This report displays the percentage of overall contribution with respect to all customers that are holding a specific share. This bar chart is plotted against the total contribution, that is the total holdings amount of share holdings across the bank’s customers for the current year.
2.2.8.3 Holdings Trending Report
This report displays the contribution of the customer/consumer over a period of time across all of the bank’s customers for a specific share holding. This trend analysis report displays the contribution of holdings over the period of 5 years which include the current year, the performance of last 2 years, and forecast for the next two years.
2.2.9 Entity Relationship Dependency Report
The ‘Entity Relationship Dependency Report’ provides the overall dependency of a vendor in various dimensions like supplier contribution, consumer contribution, lender contribution, borrower contribution, guarantor contribution, share holders contribution, and holdings contribution. You can filter your reporting criteria on the basis of the following search parameters:
- Entity Code
- Entity Name
2.2.10 Applicant Overall Dependency Report
The ‘Applicant Overall Dependency Report’ provides the overall dependency of an applicant requesting for a facility, in various dimensions like supplier contribution, consumer contribution, lender contribution, borrower contribution, guarantor contribution, share holders contribution, and holdings contribution. You can filter your reporting criteria on the basis of the following search parameters:
- Applicant Code
- Applicant Name

2.2.11 Applicant Dependency Report
The ‘Applicant Dependency Report’ provides the dependency of a specific applicant in various dimensions like supplier contribution, consumer contribution, lender contribution, borrower contribution, guarantor contribution, share holders contribution, and holdings contribution. You can filter your reporting criteria on the basis of the following search parameters:
- Applicant Code
- Applicant Name

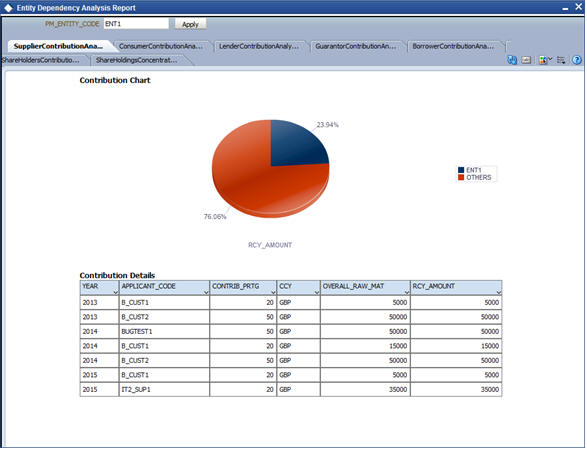
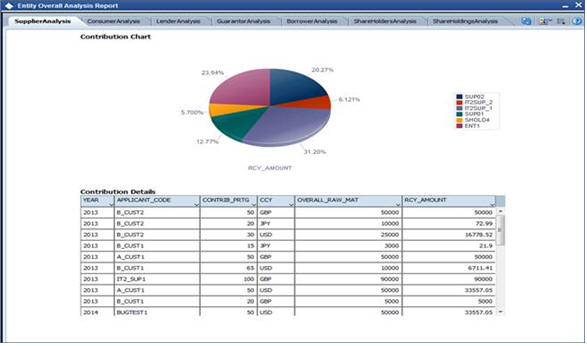
2.2.12 Entity Overall Dependency Report
The ‘Entity Overall Dependency Report’ provides the overall dependency of a specific entity or exposure (entity dependency such as AGRICULTURE_PRODUCTS and so on) in various dimensions like supplier contribution, consumer contribution, lender contribution, borrower contribution, guarantor contribution, share holders contribution, and holdings contribution. You can filter your reporting criteria on the basis of the following search parameters:
- Entity Dependency Type
- Entity Dependency Code
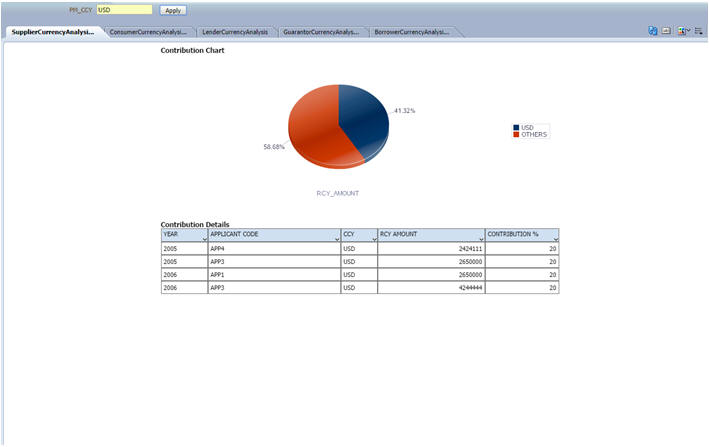
2.2.13 Currency Level Overall Dependency Report
The ‘Currency Level Overall Dependency Report’ provides the overall dependency on a specific currency like supplier currency, consumer currency, lender currency, borrower currency, or guarantor currency dependency with respect to a specific currency maintained at the bank level.
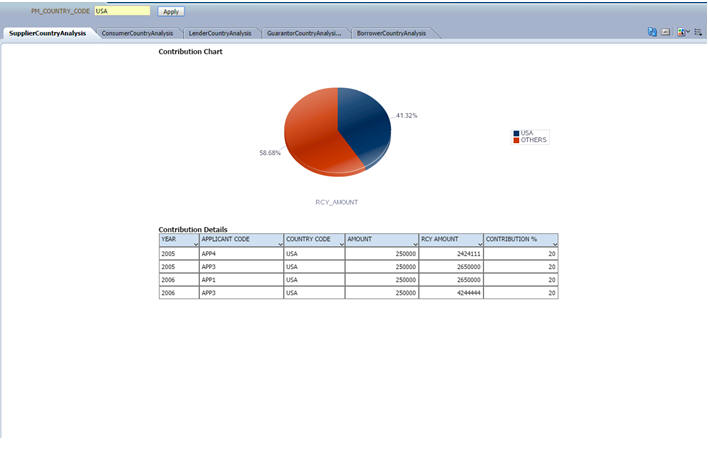
2.2.14 Country Level Overall Dependency Report
The ‘Country Level Overall Dependency Report’ provides the overall dependency on a specific country like supplier country, consumer country, lender country, borrower country, or guarantor country dependency with respect to a specific country maintained at the bank level.