| Oracle Agile Engineering Data Management Enterprise Integration Platform Administration Guide Release e6.2.0.0 E52568-02 |
|

 Previous |
 Next |
| Oracle Agile Engineering Data Management Enterprise Integration Platform Administration Guide Release e6.2.0.0 E52568-02 |
|
Previous |
Next |
The cryptographer tool allows encrypting a password string interactively, which can be copied into the clipboard. The encrypted string can then be pasted into the configuration file eai_ini.xml.
The cryptographer tool checks the wallet by every run and generates a new wallet if it does not exist in directory <eai.home>/wallet/private/eip.
|
Note: For further information please refer to the Enterprise Integration Platform Installation and Upgrade Guide > Basic Installation. |
The tool can be started with the script crypt.cmd (Windows) and crypt.sh (UNIX) in the bin directory.
|
Note: Please be aware that the encryption algorithm changed with the latest Enterprise Integration Platform version. If upgrading from an older version of the eai_ini.xml file, please encrypt the passwords again. |
The following startup options are available (you will get this by adding the -h option to the startup script):
Usage: Enterprise Integration Platform Cryptographer [-c <conf-dir>] [-h] [-p <props-file>]
Options:
-c | --conf-dir Specifies the configuration directory
-h | --help Shows this help
-p | --props-file Specifies the properties file
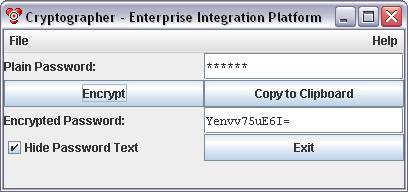
In order to encrypt a password, simply enter the password in the field Plain Password and click on the button Encrypt. The encrypted password will be displayed in the field Encrypted Password.
The button Copy to Clipboard allows copying the encrypted password to the OS clipboard. In case you do not want to see the plain password, just activate the toggle Hide Password Text. The button Exit closes the tool.
The encrypt tool allows encrypting a password string from the clipboard. The content of the system clipboard will be used and the encrypted result will also be copied to the system clipboard again.
The encrypt tool checks the wallet by every run and generates a new wallet if it does not exist in directory <eai.home>/wallet/private/eip.
|
Note: For further information please refer to the Enterprise Integration Platform Installation and Upgrade Guide > Basic Installation. |
The tool can be started with the script encrypt.cmd (Windows) and encrypt.sh (UNIX) in the bin directory.
|
Note: Please be aware that passing passwords on the command line is not supported anymore for security reasons. |
|
Note: Please be aware that the encryption algorithm changed with the latest Enterprise Integration Platform version. If upgrading from an older version of the eai_ini.xml file, please encrypt the passwords again. |
The following startup options are available (you will get this by adding the -h option to the startup script):
Usage: Enterprise Integration Platform Encrypt [-c <conf-dir> ] [-h] [-p <props-file> ]
Options:
| -c | --conf-dir | Specifies the configuration directory |
| -h | --help | Shows this help |
| -p | --props-file | Specifies the properties file |
The administrator tool can be used to view the content of the queue and the log trace of the Integration Platform.
The tool can be started with the script admin.cmd (Windows) and admin.sh (UNIX) in the bin directory.
The following startup options are available (you will get this by adding the -h option to the startup script):
Usage: Enterprise Integration Platform Administrator [-c <conf-dir>] [-h] [-p <props-file>]
Options:
| -c |--conf-dir | Specifies the configuration directory |
| -h | --help | Shows this help |
| -p | --props-file | Specifies the properties file |
|
Note: When connecting with multiple administrator tools to one EIP, please be careful when modifying the contents of the queues (Queue Viewer and Process Monitor), e.g. by deleting entries as the other users may try to operate on obsolete data. |
|
Note: Normally, all time values have a time zone appended. If it is missing, usually the local time zone applies. In case of times returned by a connector, the time zone usually reflects the local time zone on the server if not stated otherwise. |
On the tab Queue, click on Connect in order to connect to the Enterprise Integration Platform Server. After clicking on Refresh, you see the current content of the queue in the upper pane. Upon selecting a queue entry in the upper pane, you will see the content of the queue message (XML Data Object XDO) in the lower pane. Each state of an XDO (SENT, RECEIVED, ADD etc.) is stored as a separate version in the queue. Those different versions of an XDO may look different, e.g. if saved before transformation or after transformation.
The button Delete allows deleting the selected XDO message from the queue.
The button Cleanup deletes all XDO messages, where the "Processed" flag of all XDO versions in an XDO group (all XDOs with the same ID) is set to "yes".
The button Archive exports all XDO groups with "Processed" status "yes" into an archive file. The archive directory needs to be configured in the controller section of the configuration file. For each XDO group, one XML file is created with all XDO versions inside. The XDO ID will be used as the prefix for the archive file name.
The pull-down menu Filter Status allows selecting only certain XDO messages based on their status. The filter value ALL provides all messages (no filtering).
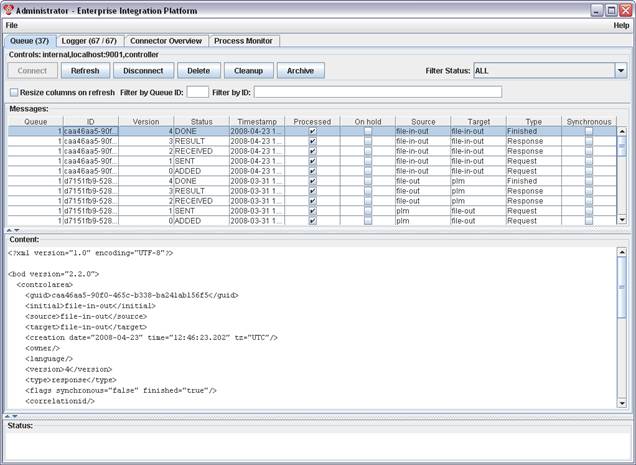
The button Disconnect closes the connection to the Integration Platform Queue.
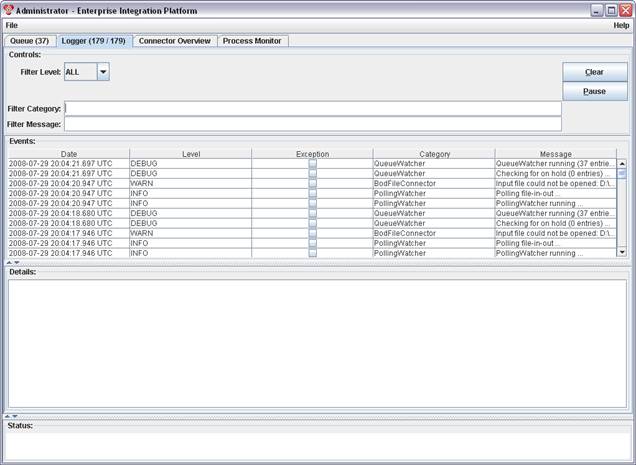
The Logger tab displays the current trace output of the Integration Platform. The log entries can be filtered and details of an entry can be shown in the lower pane.
The pull-down menu Filter Level allows displaying only a subset of the log entries based on the logging level value (level ALL provides all entries). The input fields Filter Category and Filter Message allow you to filter the entries based on entries in the Category and Message fields.
The button Clear deletes all entries in the trace list. The toggle button Pause/Resume allows you to turn off and on the logging output.
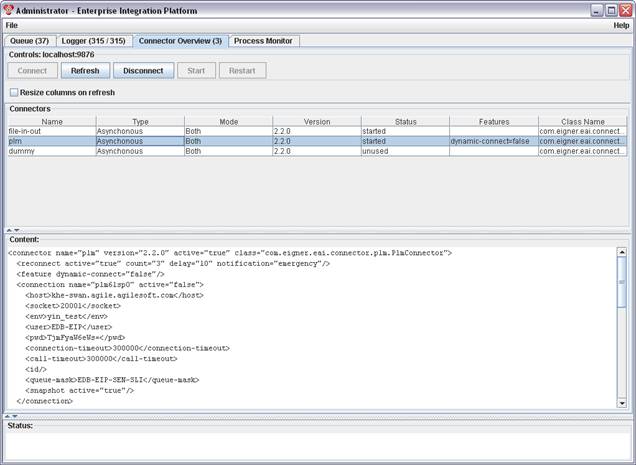
The Connector Overview tab shows a list of connector as configured in the configuration file eai_ini.xml. For each connector, following information is shown in the upper pane:
Name: Name of the connector as defined in the file eai_ini.xml
Version: Version of the connector
Status: Status of the connector (unused, initialized, started, stopped, reconnecting, error)
Features: provides a list of features supported by this connector, e.g. dynamic connect
Class Name: Name of the Java Class implementing this connector
The lower pane of the connector overview provides detail information of a connector after selecting a specific connector in the upper pane. It is not possible to modify configuration parameters here.
Following buttons are available here:
Connect: connects to the EIP server process
Refresh: retrieves the latest connector list and status from the EIP server process
Disconnect: disconnects from the EIP server
Start: starts up a connector that has the feature "dynamic connect" enabled and is not started yet
Restart: restarts a connector that has an error
The following connector states are possible:
| State | Description |
|---|---|
| initialized | Connector is initialized and ready to be started |
| unused | Connector is active, but not used in a workflow |
| started | Connector is started and ready to transfer data |
| stopped | Dynamic connector is stopped and waits for next transfer request |
| reconnecting | Connector is trying to reconnect to the system |
| error | Connector could not be started due to an error |
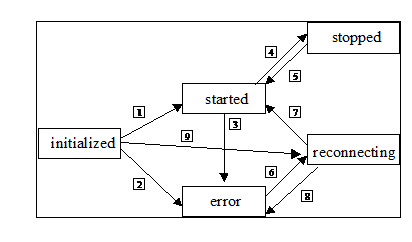
Following transitions between the different states are possible:
If starting succeeds:
If starting fails.
If an error occurs while running.
If the connector has the feature "dynamic connect" enabled and had been started before.
If the connector has the feature "dynamic connect" enabled and had been stopped before.
If reconnect is active and the number of reconnects has not been reached, or the Restart button has been pressed in the administrator's queue view.
If reconnect is active and reconnecting succeeds.
If reconnect is active and reconnecting fails.
If the Start button has been pressed in the administrator's queue view.
The EIP administrator provides a process monitor that shows more details about running and finished processes. This may be a big help when fixing and optimizing the business processes.
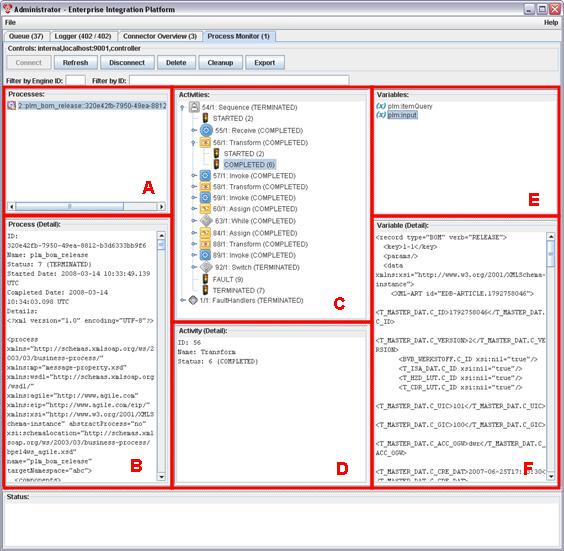
The "Process Monitor" tab in the Admin GUI shows following information:
| A) Processes | Shows all currently running and finished processes; It shows the name and the unique internal ID of the process |
| B) Process Detail | After selecting one specific process, the details of this process are shown here:
|
| C) Activities | After selecting one specific process, all activities are shown, which have already been executed until now (you will NOT see the whole process definition). For each activity you see:
|
| D) Activity Detail | After selecting one specific activity, the details of this activity are shown here. |
| E) Variables | After selecting a specific status of an activity (STARTED, COMPLETED) in block (C), you see the content of the variables as they were used and modified in the activity. |
| F) Variable Detail | After selecting one specific variable, the value/content of this variable is shown here. |
The following buttons are available in the process monitor:
Connect: connects to the EIP database.
Refresh: retrieves the latest process list, activities and variables the EIP database.
Disconnect: disconnects from the EIP database.
Delete: deletes the selected process incl. all related activities and variables from the database.
Cleanup: deletes all processes which have been processed from the database.
The Ping tool allows querying the server process of the Enterprise Integration Platform for its status.
The tool can be started with the script eipping.cmd (Windows) and eipping.sh (UNIX) in the bin directory.
The following startup options are available (you will get this by adding the --help option to the startup script):
Usage: Enterprise Integration Platform EipPing [-h] [-r <server> ] [-t <port> ]
Options:
| -h | --help | Shows this help |
| -r | --server | Server to connect to (localhost is default) |
| -t | --port | Port to connect to (9876 is default) |
The Ping tool may provide the following output:
Running Enterprise Integration Platform from C:\Agile\eip ...
--> Wrapper Started as Console
Launching a JVM...
Wrapper (Version 3.0.5)
[<date>] FORCE (EipPing) - Pinging on host     : localhost:9876
[<date>] INFO  (AdminClient) - Connected to: localhost/127.0.0.1
[<date>] FORCE (AdminClient) - Overall Status  : OK
[<date>] FORCE (AdminClient) - bpm (AC)        : started
[<date>] FORCE (AdminClient) - plm (AC)        : started
[<date>] FORCE (AdminClient) - erp (AC)     : initialized
<-- Wrapper Stopped
ERRORLEVEL: 0
|
Note: You may use the ERRORLEVEL (on Windows) or the result code of this script (on Unix) for an automated process that checks if the EIP is running properly. |
The Transformation tool is useful if you want to check if your customized XSL mapping files are working like expected. It uses the same transformation engine (XALAN) as used inside the Integration Platform and therefore provides the same transformation results.
The tool can be started with the script transform.cmd (Windows) and transform.sh (UNIX) in the bin directory.
The following startup options are available (you will get this by adding the --help option to the startup script):
Usage: Agile Commons Library Transformer [-c <conf-dir> ] [-h] -i <in> [-n] -o <out> [-p <props-file> ] -x <xsl>
Options:
| -c | --conf-dir | Specifies the configuration directory |
| -h | --help | Shows this help |
| -i | --in | Input XML file (REQUIRED) |
| -n | --plain | Plain output (unformatted) |
| -o | --out | Output XML file (REQUIRED) |
| -p | --props-file | Specifies the properties file |
| -x | --xsl | XSL file (REQUIRED) |
At the end of the trace output, you should see something like the following:
[<date>] FORCE (Transformer) - Input file : file:/C:/Agile/eip/tmp/bod_in.xml
[<date>] FORCE (Transformer) - XSL file   : file:/C:/Agile/eip/conf/axa_erp.xsl[
[<date>] FORCE (Transformer) - Output file: C:/Agile/eip/tmp/trans_test.xml
[<date>] FORCE (Transformer) - Transformation done in 0 h 00 min 03 s 395 ms
[<date>] FORCE (Transformer) - Transformer stopped.
The BPM Converter tool is useful to convert a Business Process Management data file (BPEL) into a HTML file. This HTML file shows the BPEL activity elements in a graph that can be displayed by the supported browsers (Internet Explorer, Netscape).
The tool can be started with the script bpmconvert.cmd (Windows) and bpmconvert.sh (UNIX) in the bin directory.
The following startup options are available (you will get this by adding the --help option to the startup script):
Usage: Agile BPM Suite BPM Converter [-c <conf-dir> ] [-h] -i <in> [-o <out> ] [-p <props-file> ]
Options:
| -c | --conf-dir | Specifies the configuration directory |
| -h | --help | Shows this help |
| -i | --in | Input BPM file (REQUIRED) |
| -o | --out | Output directory |
| -p | --props-file | Specifies the properties file |
At the end of the trace output, you should see something like the following:
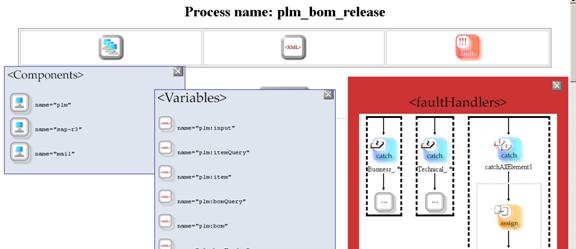
[<date>] FORCE (BPM Converter) - Input file : file:/C:/eip/conf/bpm/plm_bom_release.xml
[<date>] INFO (HtmlTransformer) - ******Here starts the BPEL-process ***********[
[<date>] INFO (HtmlTransformer) - Process element: components…
[<date>] INFO (HtmlTransformer) - Process element: replyElement7 || Element number: 323
[<date>] INFO (HtmlTransformer) - ******Here ends the BPEL-process **************
[<date>] INFO (HtmlTransformer) - Document written: C:/eip/data/html/plm_bom_release.html
[<date>] FORCE (BPM Converter) - Conversion done in 0 h 00 min 02 s 590 ms
|
Note: If you use the -out option to specify an alternative output directory, please make sure that the needed image files are copied. If you are using the standard ones, you may copy the directory <eai.home>/data/html/images. |
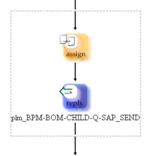
After you have converted a Business Process engine data file into a HTML file, you only have to open this HTML file in one of the supported browsers. A graph should be shown (as below) with the corresponding BPEL Activity Elements.
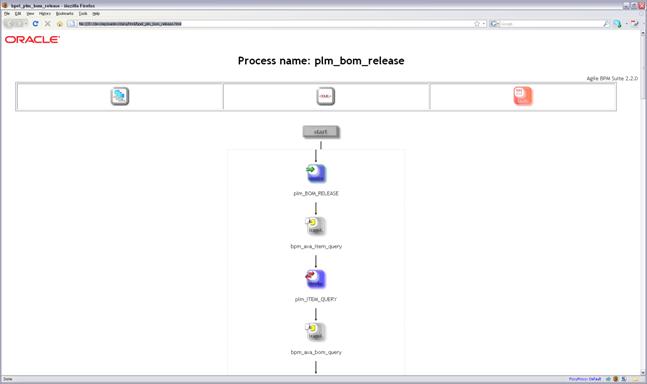
In the title of the browser window, the HTML file name is shown without its extension. It is the same name as the original BPEL file.
At the top of the graph, you will find the heading consisting of the process name. It is taken from the XML "process" element's attribute "name".
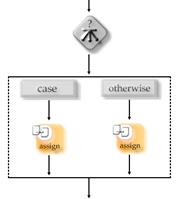
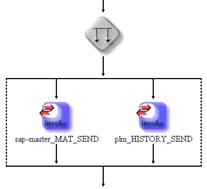
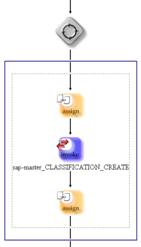
Almost all BPEL activity elements have their own button with their own icon.
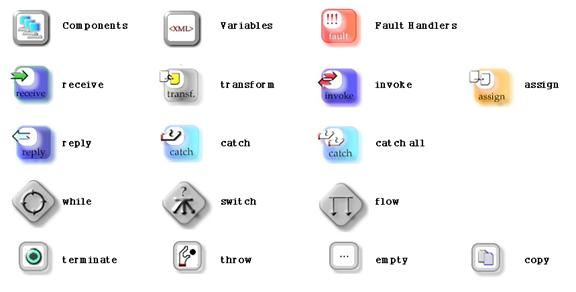
For more information left-click on an element. A tool tip window will show up in which further information such as attribute values or child elements can be displayed.
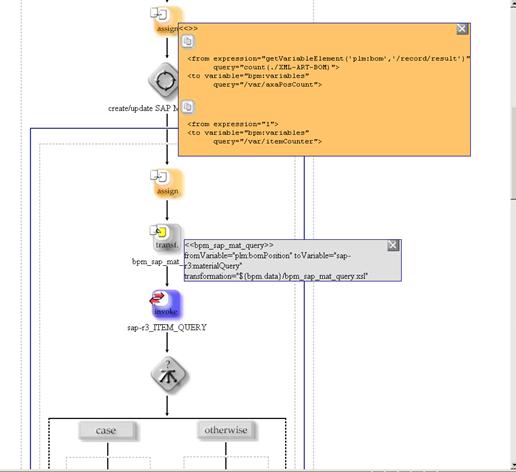
To keep the tool tip opened, just move the cursor during the mouse click. To position the tool tip window, first click at the desired location and then on the icon. There are two ways to close the tool tip window: either you click on the corresponding icon again, or click on the close button at the top-right corner of the window.


The start/end button represents the beginning/end of the real process. If you click on the start/end button, you are going to jump to the end/beginning of the graph.
Under the heading, you can find a frame within three icons: the components, the variables and the fault handlers. If you click on one of these icons, you will get a window with a detailed view.