FAQ - What is the Accounts Receivable Year View?
The Year View displays in bar chart or table the net debits and unallocated credits for an Accounts Receivable account per month for the last twelve months.
Also, a running (moving) average balance trendline shows a pattern in the account's average balance over the 12 month period.
Year View is available in Graph or Table format.
Year View Graph
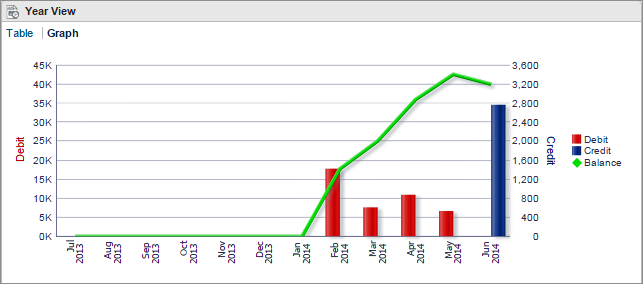
In the Year View graph, the Debits (in the red) and the Balance Trend Line (in green) use the left Debit vertical scale, whereas the Credits (in blue) use the right Credit vertical scale.
As default, the graph displays all items. To isolate items, toggle them from the legend at the right (select the item to toggle it on or off from the display). Examples of the individual items are below.