| Oracle® Retail Insights User Guide Release 16.0.202 E88945-01 |
|

 Previous |
 Next |
This chapter describes some of the reporting features of Oracle BI and Oracle Retail Insights. It also describes a number of considerations for creating Oracle Retail Insights reports.
The primary reference for Oracle BI users is the Oracle Fusion Middleware User's Guide for Oracle Business Intelligence Enterprise Edition. For more information, see that guide, particularly chapters about creating and formatting analyses, views, and dashboard pages.
The Retail Insights presentation model is designed in two different subject areas based on the reporting scenarios and analysis methods that Retail Insights supports:
Retail As-Is
Retail As-Was
A single instance of Retail Insights offers as-is and as-was analysis for the slowly changing dimensions Product and Organization. Slowly changing dimensions are dimensions with data that changes slowly, rather than changing on a time-based, regular schedule.
Although facts and dimensions appear similar across these subject areas, they are modeled differently in the Oracle BI repository. For example, Item or Subclass or Class might appear similar in all subject areas, but their sources and join conditions are different to support the appropriate method of reporting.
This type of reporting reflects the current nature of facts and dimensions as they are known to be true today. The performance of a dimension is tracked according to the current state of the dimension in a hierarchy without regard to time period.
If hierarchies have changed or items have been reclassified, as-is reporting shows history as if it had occurred under the current hierarchy or parent. Performance of the previous hierarchy or parent cannot be seen in as-is reporting.
See "Reclassification" in Chapter 5, "Dimensions and Attributes" for more information.
As-was reporting reflects the current values of transactions tied to a dimension value that was applicable at a former point in time. The performance of a dimension is tracked along the changes it has undergone in a hierarchy over a period of time. One of the effects of reclassification is that the presence of two hierarchies or parents makes it possible to compare an entity's performance before and after it undergoes this change.
In fact tables, all history is kept under the former hierarchy or parent, while all data after a reclassification is under the current hierarchy or parent.
Drilling allows you to see a particular report at a given level, and then view the same report at a lower level, to examine data at a finer level of granularity. This type of analysis makes well-defined hierarchies extremely important. Drill paths must be clear, and facts must add up between levels of aggregation. This requirement explains why changes to the position of an entity in the hierarchy are considered major.
Through Oracle Business Intelligence Enterprise Edition, Oracle Retail Insights provides capabilities to deliver contextual and actionable insight to retail business users. These capabilities and features can result in improved decision-making, better-informed actions, and more efficient business processes. Reporting capabilities of Oracle BI are featured in Retail Insights predefined (packaged) reports. You can also make use of these Oracle BI features in your own custom reports.
Retail Insights provides a number of levels of prompts, charts, tables, pivot tables, and graphics for each of its reports. You can further drill through and interact with various levels of Organization, Product, and Time hierarchies on these business objects and refine their data analysis. Retail Insights reports present intuitive access to information based on a user's role.
The following topics describe some interactive features used in Retail Insights reports.
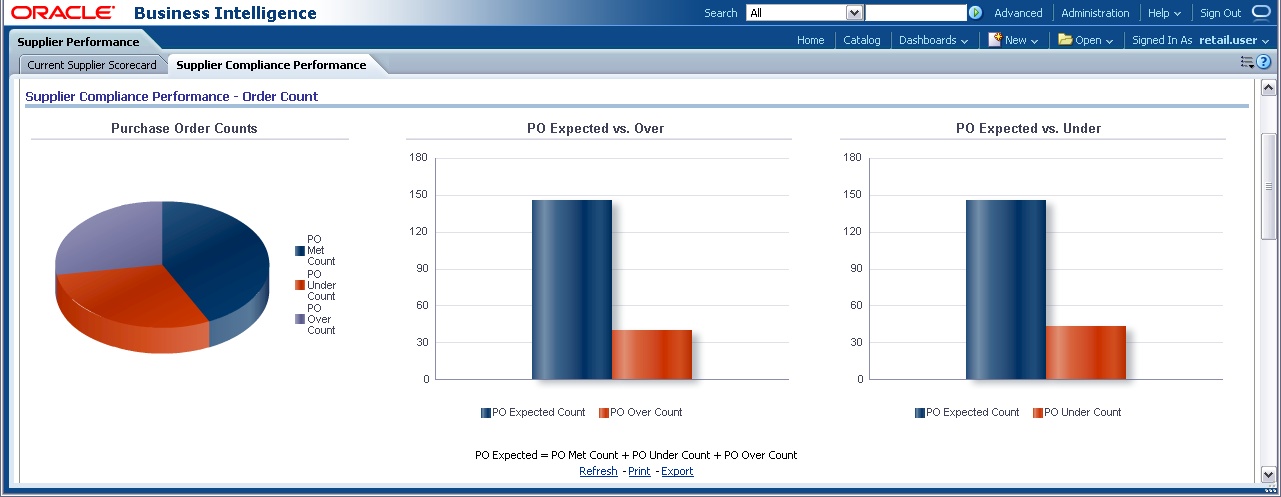
Various reports use interface features such as graphs and charts. For example, Supplier Compliance reports graphically represent various key performance indicators (KPI) related to purchase orders, which can help buyers to promptly assess the performance of a supplier.
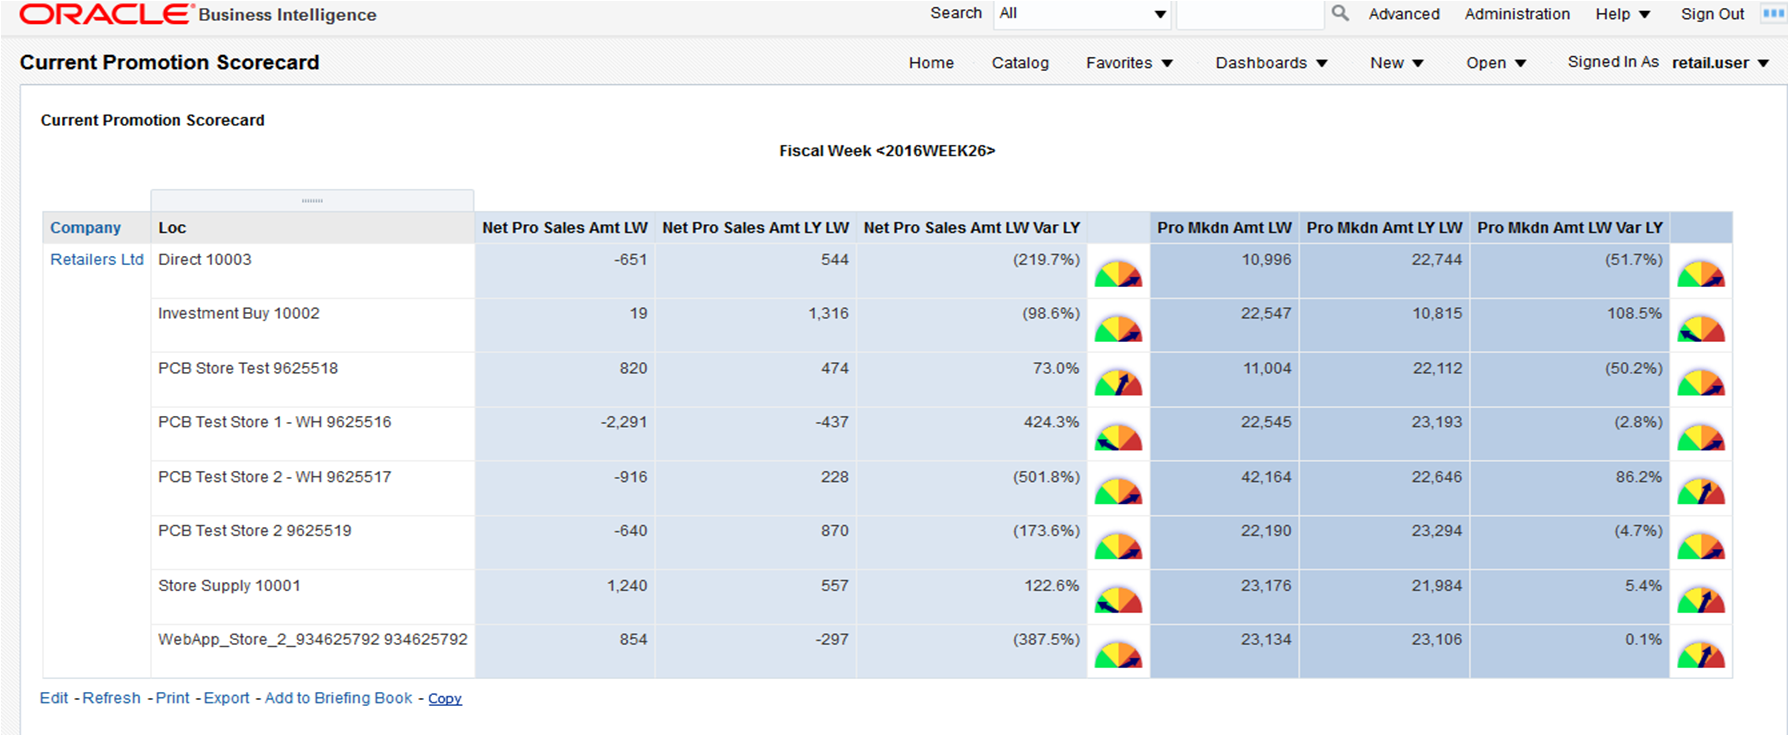
Reports such as Current Promotion Scorecard use gauges to represent the quality of KPI values. In the following example, profit and markdown variances are qualified with Oracle BI dial gauges, with an indicator that points to where the data falls within predefined limits.
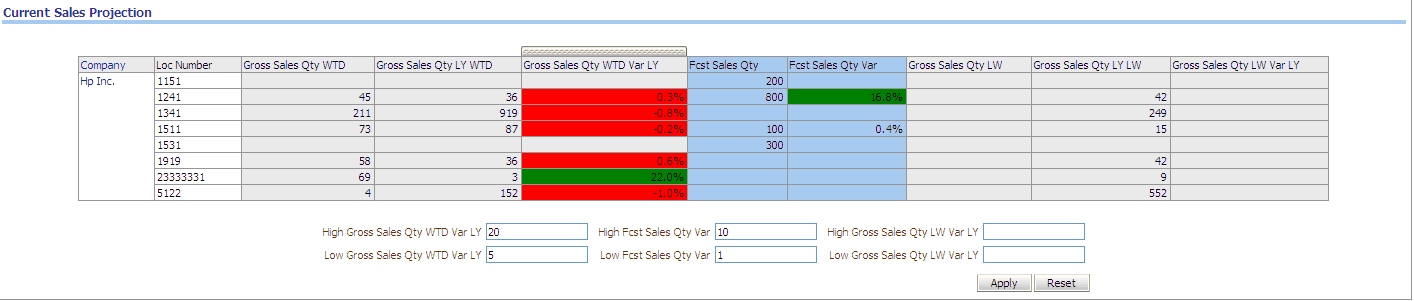
Some reports use conditional formatting to indicate the performance of predefined KPIs. For example, in the Current Sales Projection report, the thresholds are defined for the low and high gross sales quantity variances. The results are formatted based on these thresholds. Threshold amounts can be configured by users when executing these reports.
For example, when a user applies a high variance of 20 percent and a low variance of 5 percent for Gross Sales Qty WTF Var LY, the report cells for Metrics Gross Sales Qty WTD Var LY that have variances above 20 percent turn green in color, and those with variance less than 5 percent turn red.
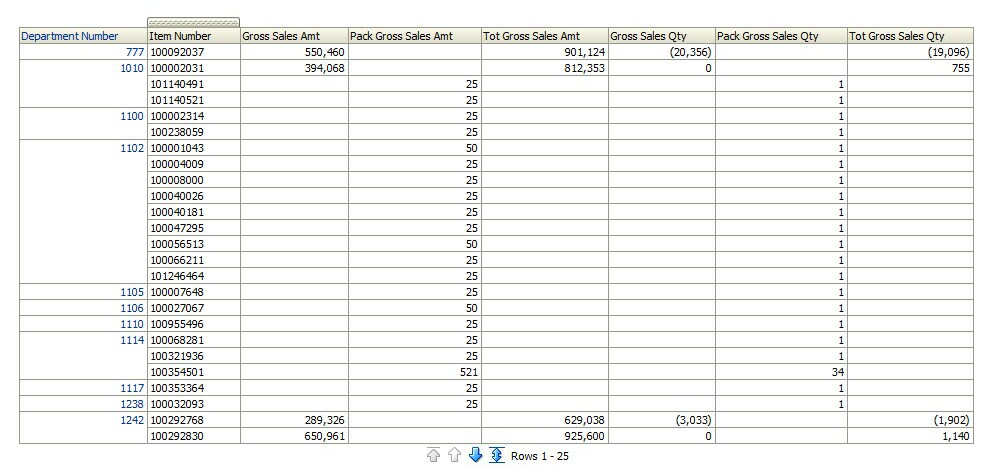
Retail Insights reports permit drilling on various attribute hierarchies. By default, reports display the results at the summary level or a preconfigured attribute level. The user can further move to a detailed level of analysis by drilling to focus on parts of the data set where problems are identified.
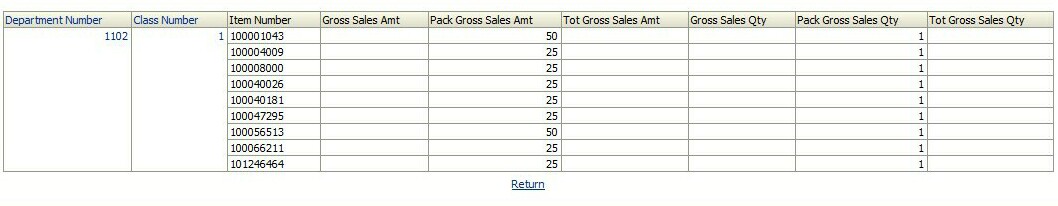
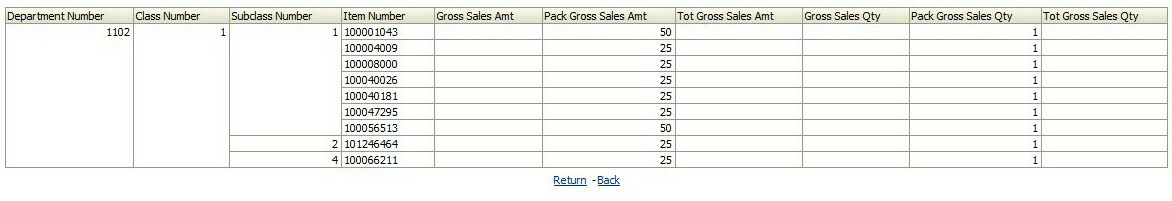
The following example demonstrates the drilling capability on the Sales Pack Performance report.
|
Note: There is no value in drilling below the transaction level for an item. The transaction level can be identified if "no level" appears at drilling, which means the previous level was the transaction level. |
Some Retail Insights reports use the guided navigation feature of Oracle BI, which allows you to navigate from one source report to other target reports, based on certain preconditions or data points on the source report. This helps a business user to inspect a complete logical workflow, and possibly determine the root causes of problematic key performance indicators.
The following reports are linked through guided navigation.
Table 4-1 Linked Reports
| Report Name | Navigate to Report |
|---|---|
|
Current MTD Sales and Inventory Scorecard |
Current Location Price Trend Current Loc WOS Warning |
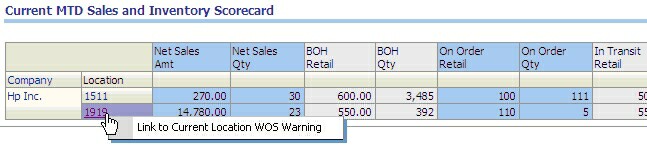
The Current MTD Sales and Inventory Scorecard report navigates to the Current Location Price Trend report based on user-configured net profit measures. For low profit yield items, a user can navigate to the Current Location Price Trend report.
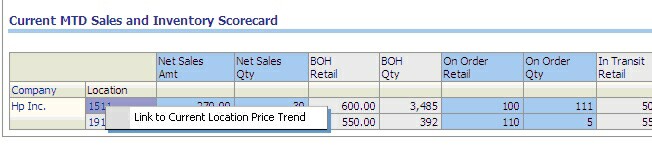
For high profitability products, the user has the option to navigate to the Current Location WOS Warning report.
For more information about extending the use of Oracle BI guided navigation features, see the Oracle Fusion Middleware User's Guide for Oracle Business Intelligence Enterprise Edition.
Retail Insights reports can be customized to render geographical maps, using spatial data managed by Oracle Spatial. These custom reports can help a user to visualize geographical data. For example, when analyzing comparable sales for a particular region, maps on such a report can provide additional topographic information about the location.
To use these features, you must load the topographic data about warehouses, stores, and other locations into Oracle Spatial, and then use Oracle MapViewer to create maps.
Oracle Retail Insights supports five currencies:
Local Currency
Document Currency
Global 1 Currency
Global 2 Currency
Global 3 Currency
During installation, these currencies are defined for your organization. You need to know how these currency mappings are used when you design reports. For example, currencies could be defined as follows:
Table 4-2 Currency Mapping
| Currency Mapping | Currency |
|---|---|
|
Document Currency |
EURO |
|
Global 1 Currency |
US |
|
Global 2 Currency |
CAD |
|
Global 3 Currency |
AUD |
Retail Insights includes a prebuilt prompt and a report (Daily Sales and Profit Analysis) that enables support for multiple currencies. All the amount metrics are defined to support these five types of currencies.
To use this functionality, in a report, follow these steps:
Create the report with required amount metrics.
Select the Advanced tab.
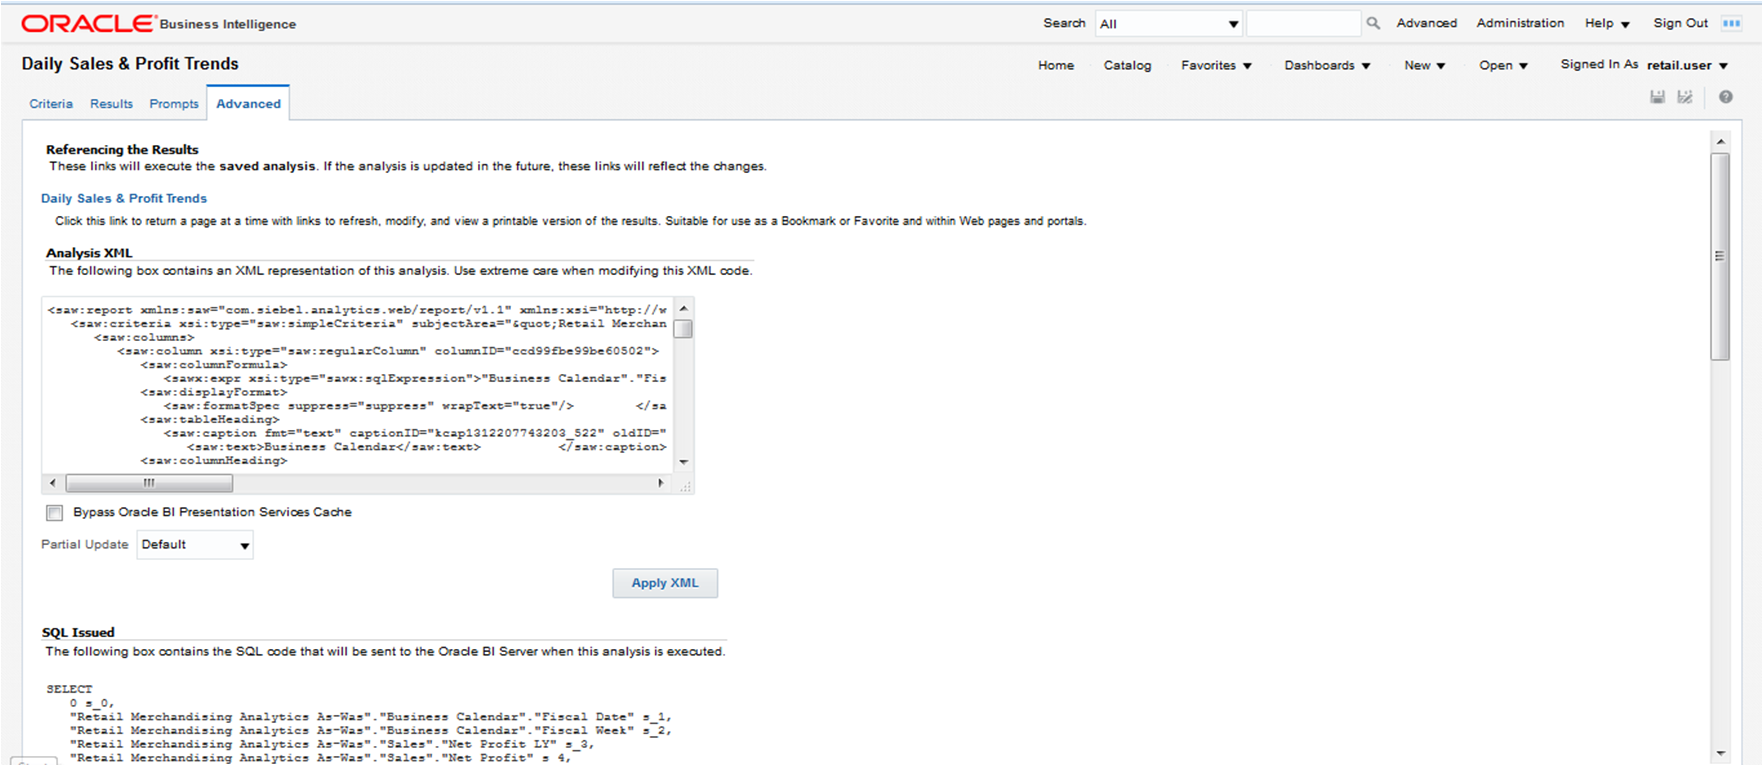
Under Advanced SQL Clauses, in the Prefix text box, add the following:
SET VARIABLE PREFERRED_CURRENCY = '@{Currency}';
At the top, select the check box Bypass Oracle BI Presentation Services Cache.
At the bottom, click Apply SQL.
Save the report.
Create a dashboard and add this report, along with the currency prompt (located in Shared Folders > Merchandising Analysis > RA As-Was Prompts).
The currency prompt has five currencies preloaded. Select the preferred currency, click Apply, and the metrics will be calculated accordingly to the currency selected.
|
Note: As of OBIEE 12.2.1, changing a variable prompt does not trigger an automatic refresh of report data. If the currency prompt is the only prompt in the dashboard, you may need to manually Refresh the dashboard from the options menu in the upper right corner. |
The following are additional considerations and suggestions for designing Oracle Retail Insights reports.
Planning and stock ledger reports cannot be created below subclass and week, because data for these fact areas have the lowest levels of subclass and week.
Comp and BOH (beginning on-hand) metrics are only supported at week level. You must also use a prompt or filter on week or a higher level of the time dimension.
For point in time reporting, you must have a prompt on an attribute of the time dimension.
When reporting on any transformation metrics, you must have a prompt or filter on the time calendar.
To compare as-is, as-was, and point in time results for the same report, create a single dashboard with these reports on three different pages. The same report cannot include both as-is and as-was results.
Wherever there are many-to-many relationships, you must have prompts or filters on one value to avoid double-counting. For example, there can be overlapping seasons, and the same items can belong to both seasons. If there is no filter or prompt on season, the items common to both seasons can be double-counted. Another example of this is an item list, where the same item can be in multiple item lists. A filter or prompt on item list will ensure that correct data is displayed.
Retail Insights does not store attribute values that do not have associated facts. For example, Retail Insights will not consume location lists that do not have any associated locations.
Customer Order Demand cannot be analyzed by the Fulfillment Channel.
Order Fulfillment cannot be analyzed by the Demand Channel.
Demand and Fulfillment analysis is not supported by Season Dimension.
Market Item and Retail Item side-by-side analysis is not supported.
Season Based reporting is not supported for Market Item and Consumer Reports.
Market Item reporting is only supported for the As-Is Subject area.
Users should not drill from Customer Segment to Customer, even though this drill path has been enabled in Oracle BI EE. Drilling may cause performance issues if the proper aggregates have not been created for Customer attributes.
When combining data from multiple facts which make use of different dimensions (for example, Inventory Position and Purchase Orders), go into the Advanced tab of the analysis and select the checkbox for Show Total value for all measures on unrelated dimensions. This is required to see results when a dimension is not present on some facts, such as viewing EOH Qty with Purchase Order Number and PO Ordered Qty.