| Oracle® Retail Insights User Guide Release 17.0 E95062-02 |
|

 Previous |
 Next |
Predefined reports are packaged with Retail Insights and available on several sample Oracle BI dashboards. You can use these packaged reports without modifications to begin reporting on your retail measures. You can also use these reports as foundations or examples for building your own custom reports. Each packaged report includes dashboard prompts, to allow a user to refine and focus the data in the report for the subset of the retailer's business measures that you need to investigate.
In addition to the predefined reports, Retail Insights includes a variety of predefined, fundamental metrics that are common throughout the retailing industry. Some of these are used in the packaged reports, and you can use any of the metrics in your own custom reports. See Chapter 6, "Metrics" for more information.
|
Notes: Before viewing reports, ensure that the Retail Insights nightly batch runs have completed successfully for the report subject area, so that you can analyze the most up-to-date data.Moving, removing, or re-ordering of the columns or prompts on any predefined report is not recommended as they have only been tested as they are currently configured. Make a copy of a report if you would like to modify it or re-use it elsewhere. |
Retail Insights offers pre-defined reporting in the following areas:
Merchandise Planning
The merchandising reports provide a high-level, organization-wide perspective for analyzing the effectiveness of merchandising strategies. The utilization of key performance indicators (KPIs) provides detailed analysis of various merchandising techniques to maximize profit, increase sales opportunities, and enhance product performance. The merchandising reports under the Merchandising Analysis dashboard analyze merchandise performance, profits, sales, and trends. These reports use metrics created for sales, cost, and pricing facts.
Evaluating Promotion Effectiveness
Reports under the Markdowns dashboard analyze the efficiency of merchandising promotions. The reports also compare the sales generated through promotion mechanisms, and break down markdown amount by various retail types.
Evaluating Comparable Store Performance and New Store Locations
The reports under the Merchandising Performance dashboard provide comparable store analysis information. These reports provide a measure of a retailer's sales strength by comparing this year's sales against last year's sales, using both total sales and comparable store sales.
You can use Customer Analysis reports to explore customer segmentations that can translate into promotion opportunities. These reports can help you to understand behavioral habits of a focused customer base, increase the relevancy of advertisements, and increase revenue from advertisement placements or other types of promotion events.
Market Basket Analysis is a data mining technique that outputs the correlations between various items in a customer's basket.
Market Basket Analysis reports help you to understand which items sell with which other items, including probability and profitability of market baskets. You can use these reports to plan promotions, optimize product placement, and support store planogram decisions. These reports can also help you to understand the statistical relationship between sales of different merchandise.
Promotion Effectiveness is the area of analysis that a buyer or merchandising planner uses to compare promotion strategies across the promotion hierarchy, as well as across the merchandising and organization hierarchies. For example, you might compare one promotion to another to evaluate total sales volume and profit amount across the two promotions.
Along with promotion (offer) redemption analysis, the merchandising planner can compare actual promotion results against the promotion forecast, down to the low level of promotion component and item level.
The packaged Retail Insights metrics are found under the different Retail As-Is and Retail As-Was subject areas.
See Chapter 4, "Creating and Modifying Reports" for more information about as-is and as-was analysis methods.
See the Oracle Retail Insights Implementation Guide for information about adding reports in different subject areas.
The rest of this chapter describes the reports that are packaged with Oracle Retail Insights, and the Retail Insights dashboards in the Oracle BI interface where you can find these reports. The report descriptions are organized according to the dashboards where you find them.
The Retail Insights dashboards contain a variety of report formats, each suited to the various roles in the retail organization, as well as the different areas of retailing business analysis.
Productivity Reports
Productivity reports focus on the overall monetary and meaningful contribution of a particular level of the merchandise or organization hierarchy. Productivity measures are frequently based on time or monetary considerations. For example, sales productivity measures focus on questions such as these:
How much does a particular store, employee, or process contribute to sales or profit?
How much profit does one particular item contribute as part of a department?
Trend Reports
Trend reports highlights distinct patterns or progressions in the retailer's data over time. These are typically presented to the user as bar or line graphs charting a measure over a selected time period.
Ranking Reports
Ranking reports sort or arrange information in a particular order at a given point in time, or over a selected time period (top sales, bottom performers, fast movers, and so on). Reports can be ranked either by sorting on one of the metrics (such as top 10 sellers based on sales amount), or through a filter on the report (such as weeks of supply greater than 5 or less than 2).
To Date Reports
These reports provide running totals for information up to and including the date selected.
Retail Insights consists of Retail Merchandise Insights dashboards and Retail Customer Insights dashboards.
Retail Merchandise Insights
The Retail Merchandise Insights dashboards are divided into these sections:
Flash Sales Summary
Markdowns
Merchandise Sales and Profit
Merchandise Performance
Merchandising Location Analysis
Financial
Retail Customer Insights
Retail Customer Insights provides the following dashboards:
Customer Analysis
Promotions
Market Basket Analysis
Customer Order
Consumer
Cluster
Wholesale
Table 3-1 lists all of the Retail Insights predefined reports. The table identifies the sections of the overview dashboard through which you access the reports, and the dashboards on which the reports appear. The table also indicates the types of analysis used in the reports.
Table 3-1 Predefined Retail Insights Reports - Sections, Dashboards, and Analysis Methods
The following sections highlight some of the reports and dashboards in more detail in order to explain key concepts or demonstrate the various report-building techniques available in Retail Insights.
The Merchandising Scorecard provides a high-level, organization-wide perspective for analyzing the effectiveness of merchandising strategies, allowing detailed analysis of various merchandising techniques to maximize profit, increase sales opportunities, and enhance product performance. The Merchandising Scorecard section contains the following dashboards of reports:
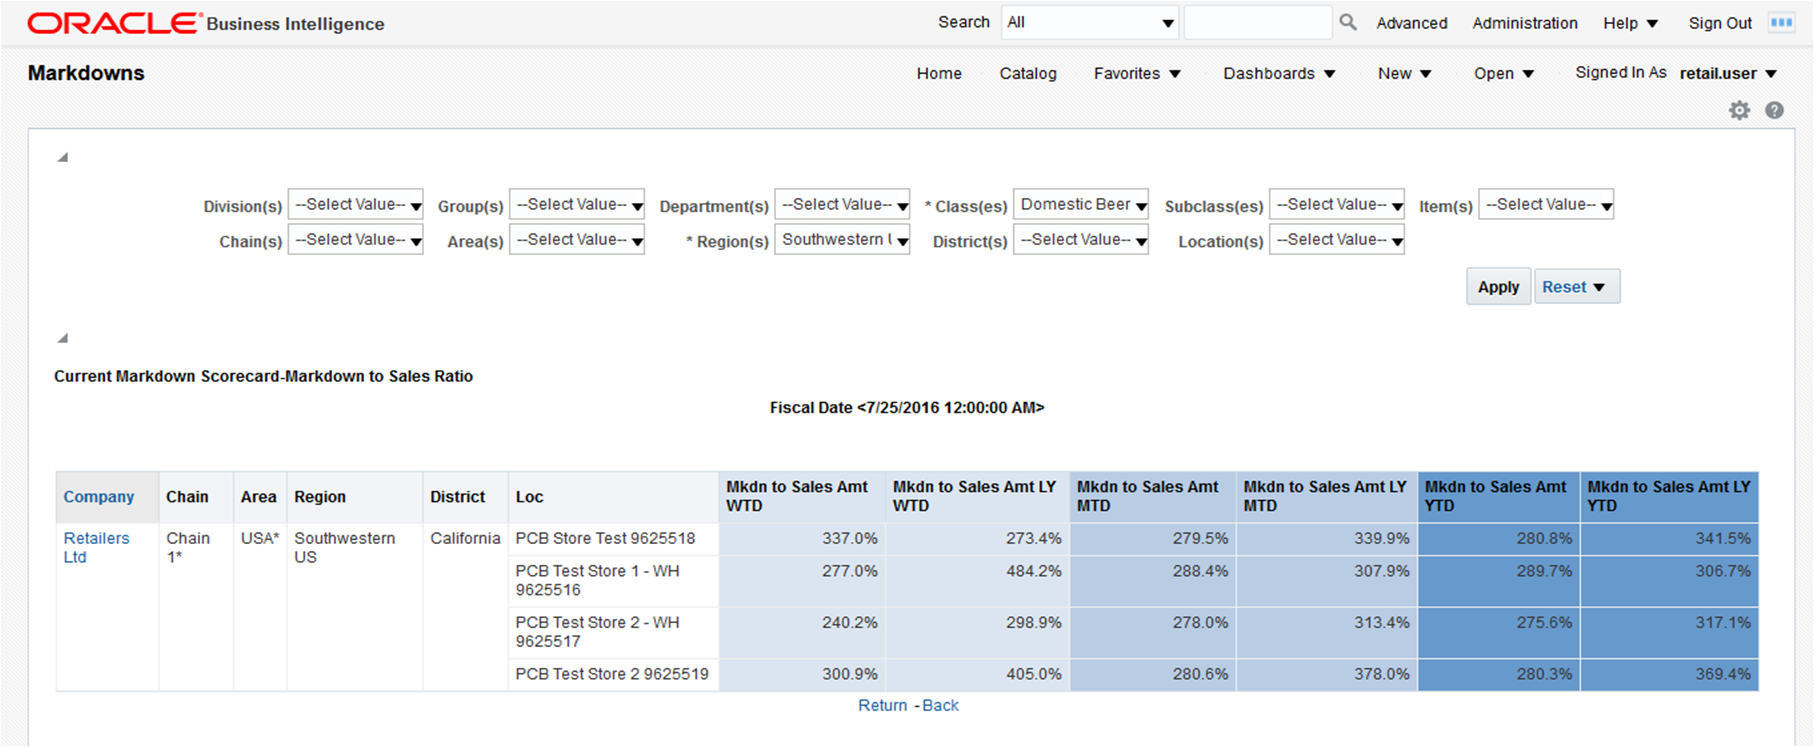
The Markdowns dashboard includes the following reports.
These reports provide markdown information, based on regular, promotion, and clearance retail types, compared to last year. Merchandising and finance executives can use this report to determine the effectiveness of markdown strategies. Buyers can identify items that have high variances of markdowns compared to last year, and possibly negotiate and evaluate the prices of such items with suppliers.
The following are the Current Markdown Scorecard reports.
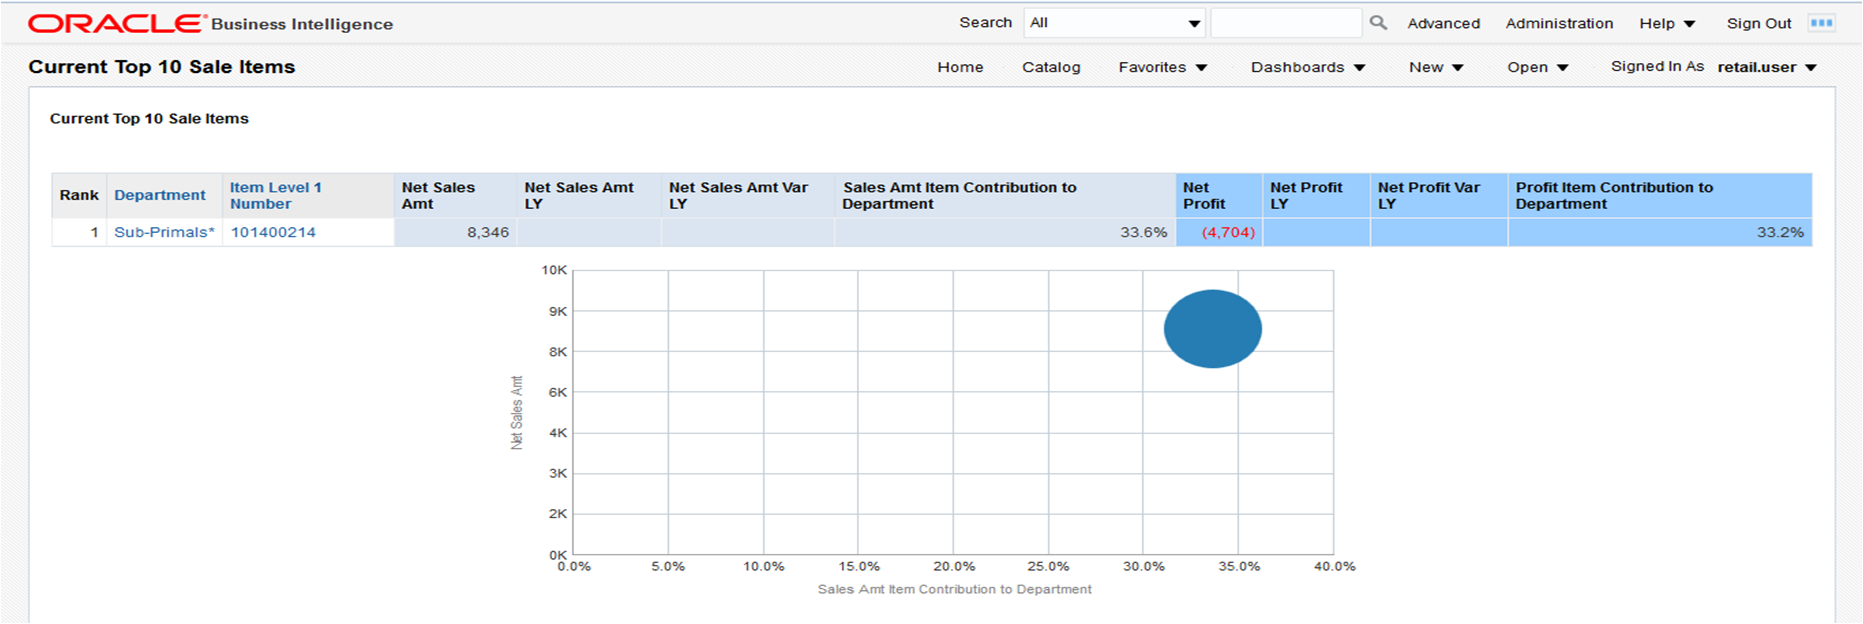
The Merchandising Sales and Profit dashboard includes the following reports.
This report shows the top ten selling items, ranked by sales amount, for a time period specified by the user. This report can be run periodically to review the merchandising strategies for a selected range of departments. The results of the report can be used by buyers to evaluate pricing and promotion strategies for key items.
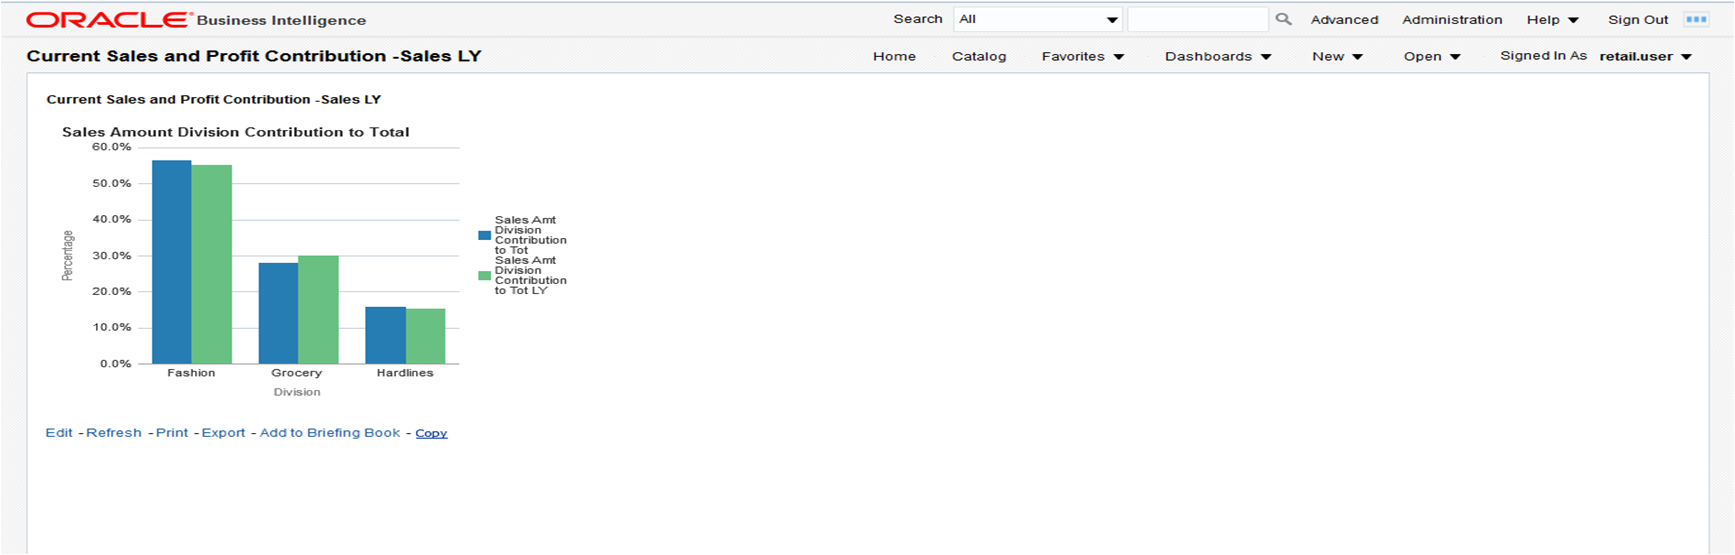
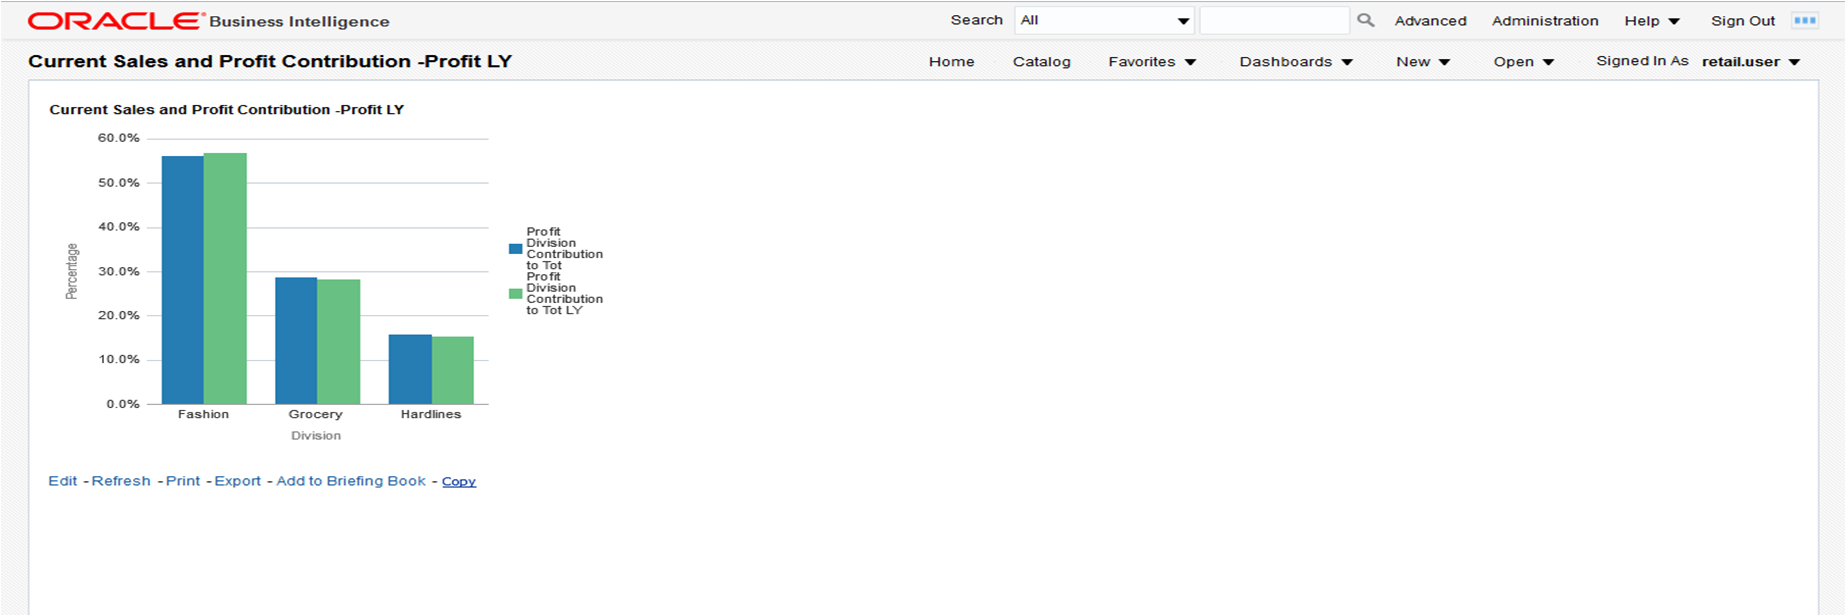
This report provides a view of sales and profit contribution across the organization by merchandising division. The report can be run monthly to compare the merchandising mix this year to last year by sales value. For the underperforming divisions in this report, merchandising executives can navigate to the Current Location Scorecard report to analyze division performance and profitability by location.
There are three subreports in this report:
Current Sales and Profit Contribution - Sales LY
This report displays the gross sales amounts for various divisions of a company. It also displays the sales contribution of each division this year and last year.
Current Sales and Profit Contribution - Profit LY
This report displays profit amounts for various divisions of a company. It also displays the profit contribution of each division this year and last year.
Current Sales and Profit Contribution - Total
This report displays gross sales, sales contribution percentages, gross profit, and profit contribution percentages for various divisions of a company.
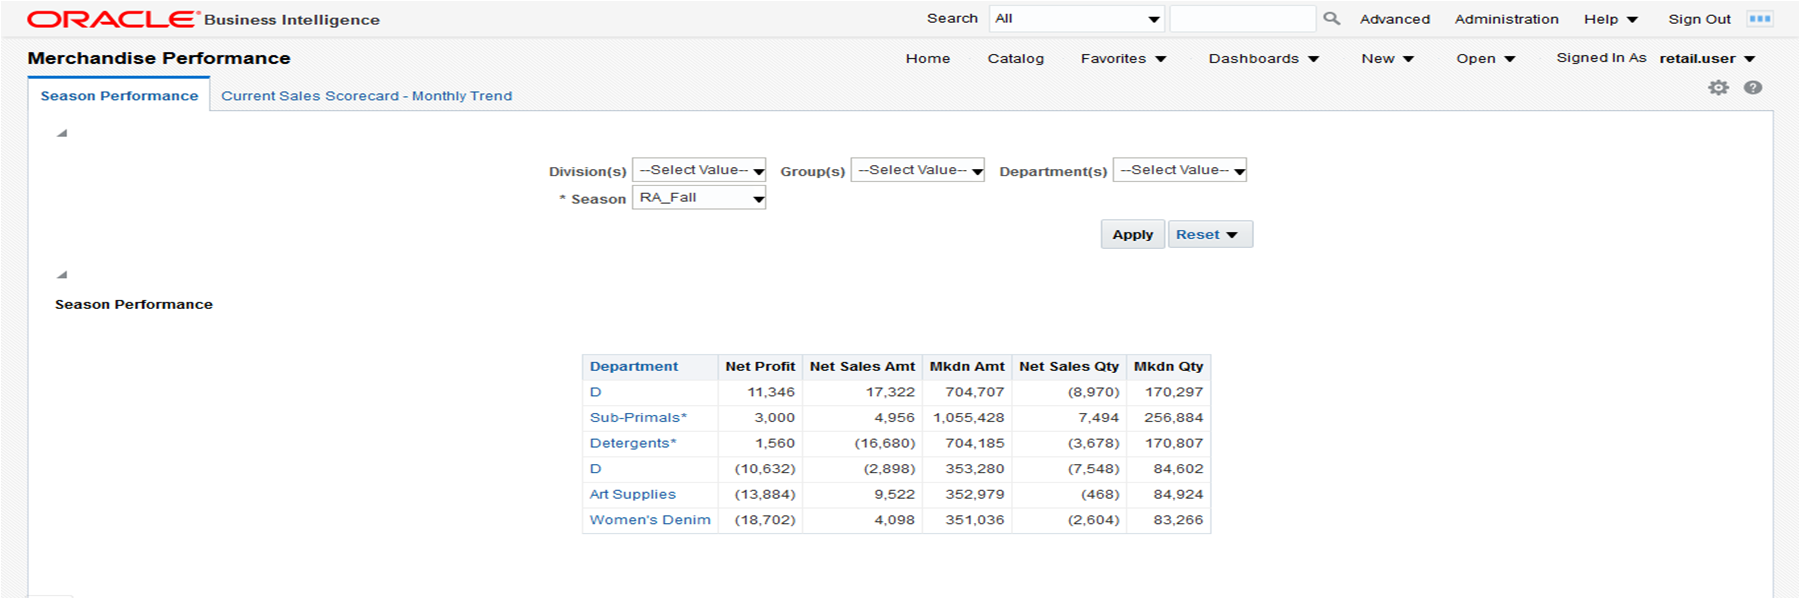
The Merchandise Performance dashboard includes the following reports.
This report displays performance across departments for a specified product season. Planners and buyers evaluating seasonal merchandise assortments can compare sales and profitability of items attached to specific seasons. Because product seasons do not have to align with the business calendar, this report offers an alternative view of performance of merchandise over time.
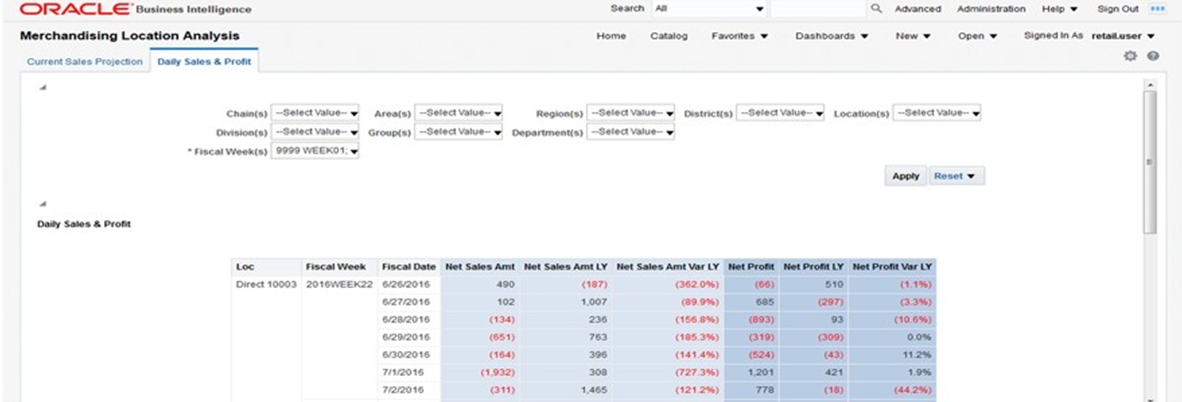
The Merchandising Location Analysis dashboard includes the following reports.
This report provides an organizational comparison of sales and profit trends compared to the same time period last year. Regional and store Managers can review this report daily to ensure that daily projections for their regions and locations are being met on high-traffic days.
This report displays actual sales quantities compared to forecast for the current week, broken down by location. This report can be run midweek by merchandising and planning executives who assess progress against forecast. For locations where variance from forecast is negative, an inventory control manager can see whether low inventory levels are affecting the performance compared to forecast.
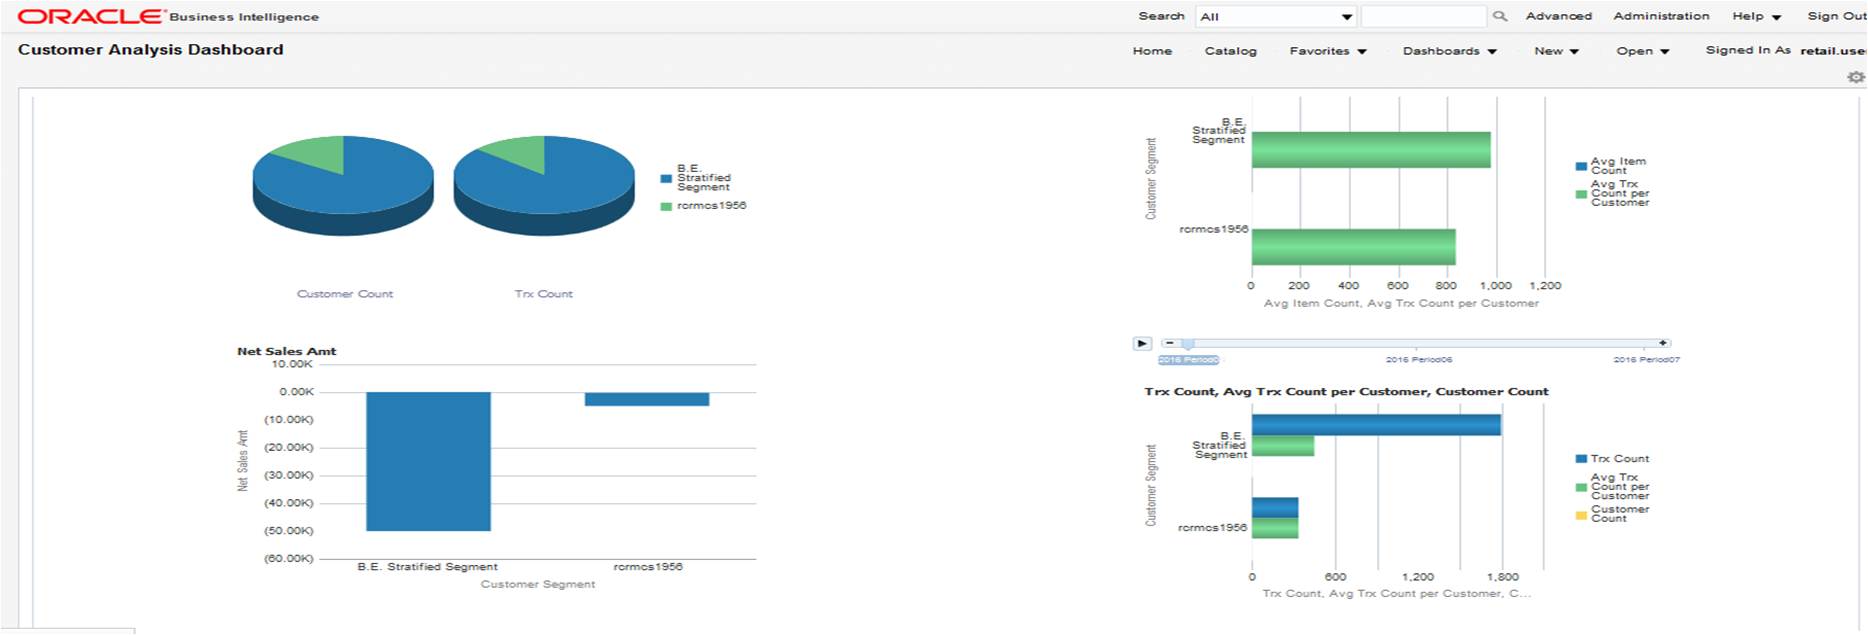
Marketing teams and promotion planners need to understand how the buying behavior of their customers varies across the customer base. Using the Customer Analysis dashboard, they can view customer behavior by demographics, RFM scores, customer segments, and more, using the following reports from the Customer Analysis dashboard.
This report displays sales performance by customer groups and will highlight customer groups that are most valuable to a retailer. It will also exhibit disparities in behavior of different customer groups. If all customer groups behave similarly, analysts may choose to market towards all customers in the same manner. If customer groups behave significantly different, analysts may choose to customize the retail experience for a specific customer group.
Retail Insights' data mining capabilities enable market basket analysis of which products may make effective bundles. This customer behavior information is gleaned from mining transaction history and correlating it with customer segment attributes to inform promotion strategies. The ability to understand the market basket affinities allows marketers to calculate, monitor, and build promotion strategies based on critical metrics such as customer profitability. Data mining also enables baseline calculations that are used to calculate lift for promoted products. That is, how much over the baseline did my sales increased when I promoted this category? Baseline metrics can be used by a buyer during category planning to establish expected sales for a category before promotions are added.
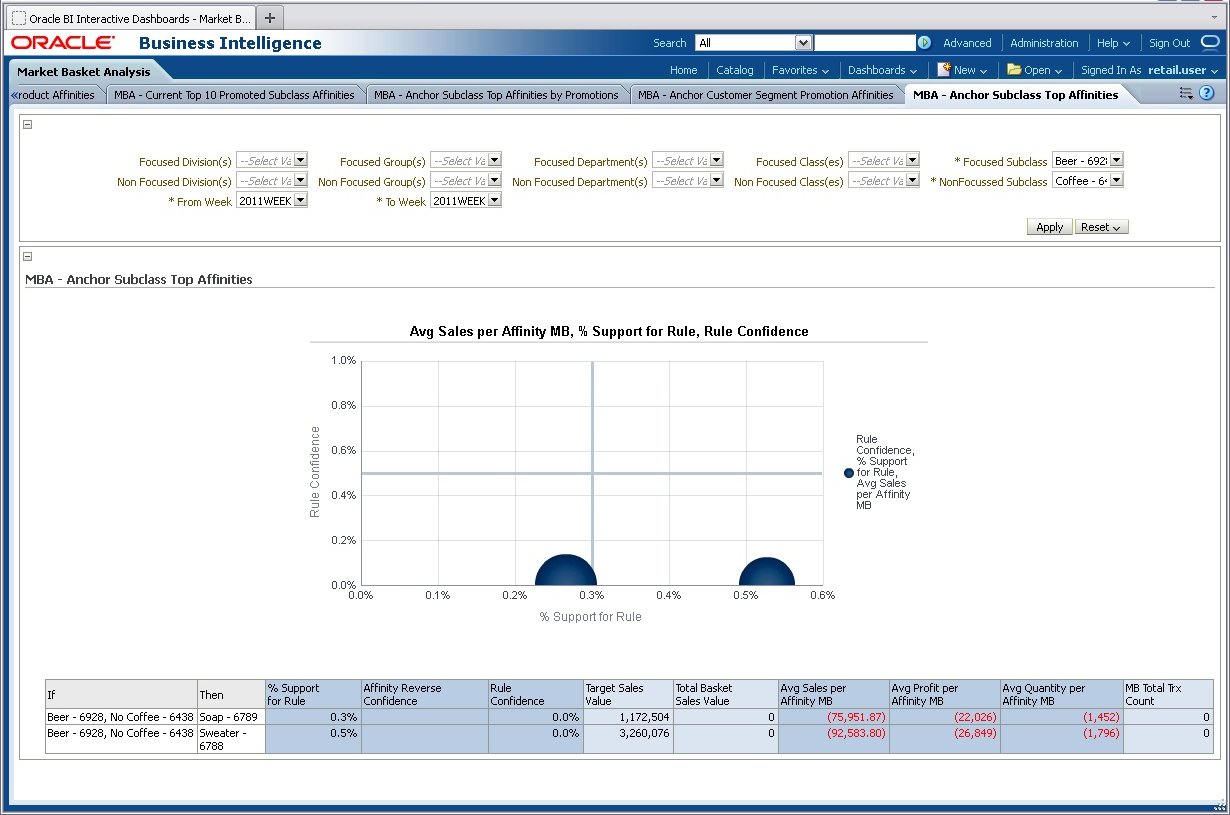
Market basket analysis uses a data mining technique to look for sales patterns between products within a given group of transactions. The output of that analysis provides a rule that defines the association found between products at the subclass, class, or department level of the merchandise hierarchy.
A rule consists of one to three antecedents (IF attribute) and a single consequent (THEN attributes). For example:
IF (milk) and (juice), THEN (cereal)
In other words, if a customer purchases an item from subclasses milk and juice, the customer will also purchase an item from subclass cereal. After a rule is defined, a user can use market basket analysis metrics to understand how strong the association is, using rule confidence and support. The probability that a customer will buy milk and juice is support, and the conditional probability that a customer will purchase cereal is confidence.
After users have identified selling patterns, they can begin to take action based on those patterns, as well as the needs and goals of their product category. Suppose that a merchant is tasked with bringing in more margin dollars to the cereal category. Armed with the association rule in the preceding example, the merchant might work with the dairy category on a milk promotion to increase sales of milk. This in turn increases sales of cereal, without sacrificing margin dollars on a cereal promotion. Note that this could require cross-category planning in some cases, depending on the affinities being studied. The Market Basket Analysis section contains the following dashboards of reports:
Market Basket Analysis Report Ranking
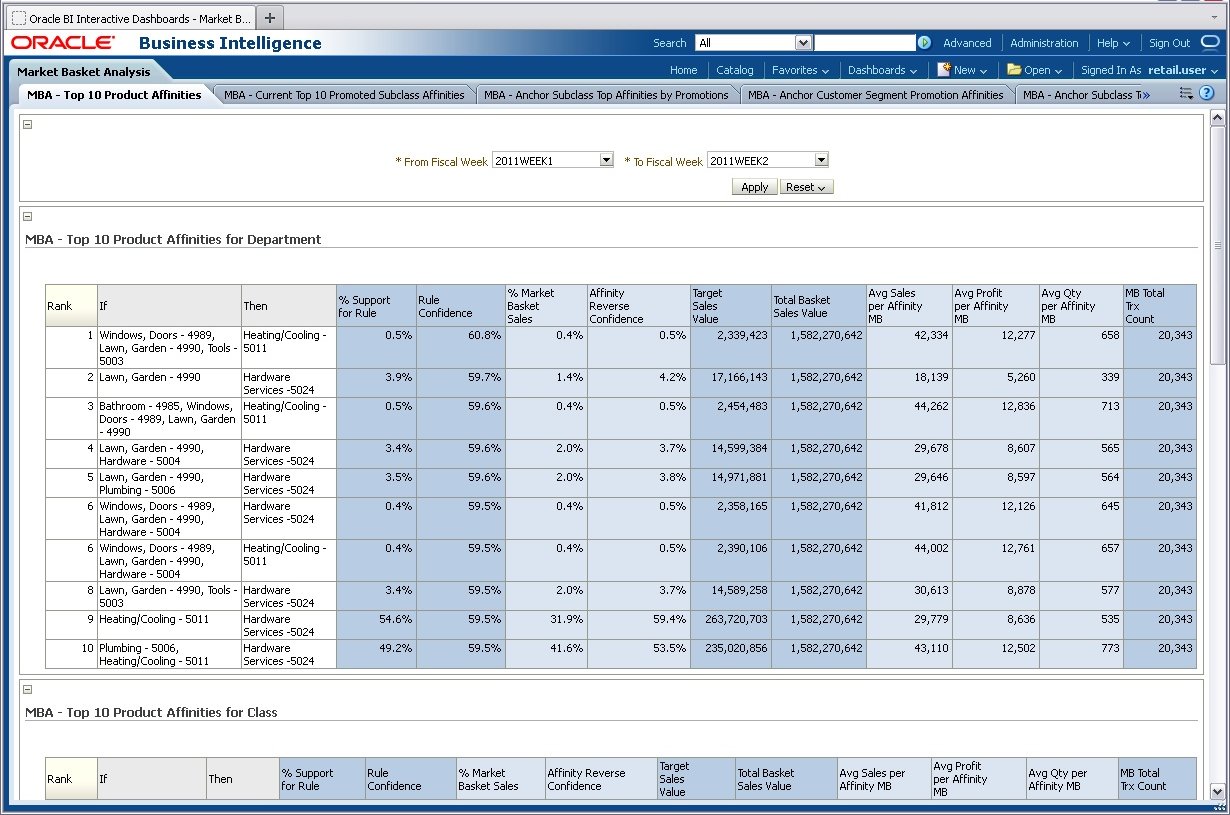
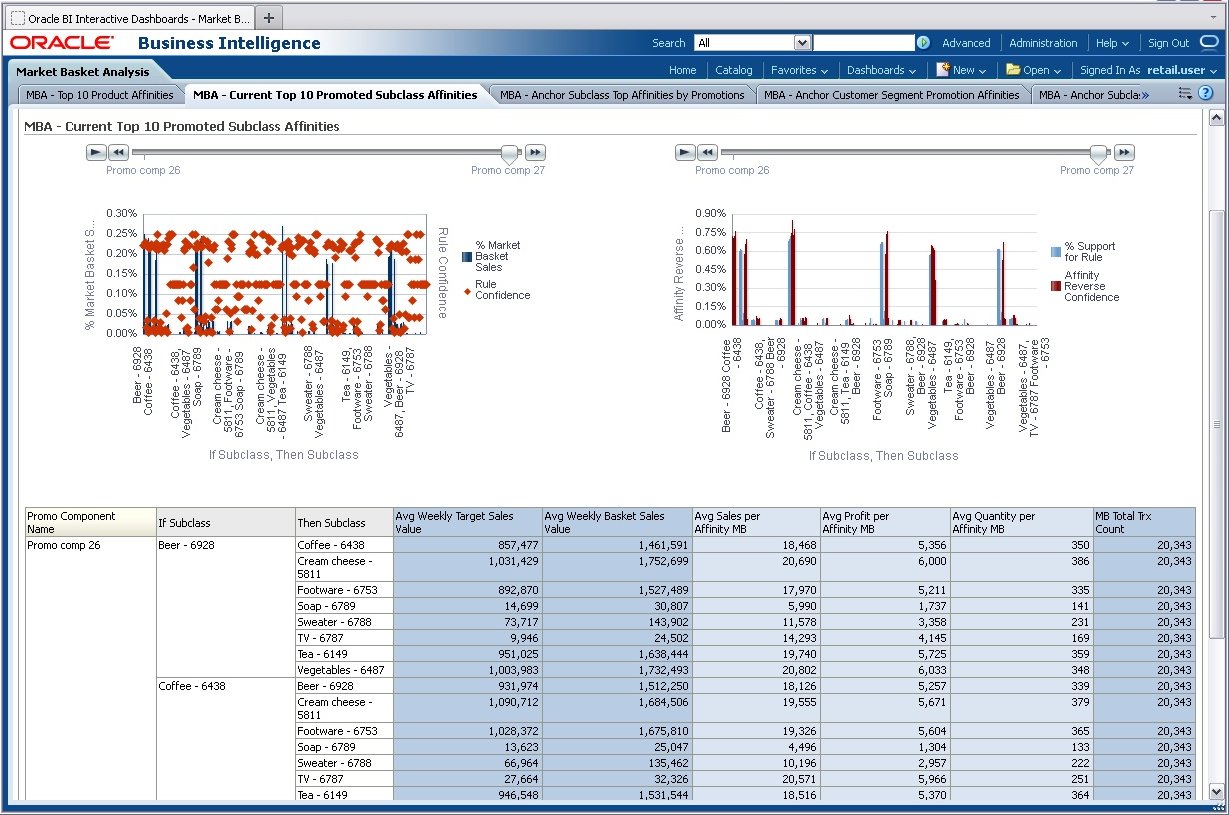
For the Top 10 Product Affinities and Current Top 10 Promoted Subclass Affinities reports, results are ranked from 1 to 10 in descending order of rule confidence. This provides the user an easy-to-understand visual representation of the strength of product affinities.
This report illustrates the affinity relationship that buying one item has on buying another item. Buyers, planogram analysts, merchandising executives, and marketing executives can run this report at the beginning of the week. Marketing analysts can capitalize on the reported product affinities to efficiently plan promotions. Planogram analysts can benefit from this report by using product affinities to create customer-friendly store planograms and catalog pages.
This report reveals the effect of promoting one subclass on the sales of another subclass. Category managers, merchandising executives, and marketing executives can run this report. This report can be helpful in planning future promotions, because reducing the price on some items might cause a boost in sales of related high-affinity items, without the need to also promote those items.
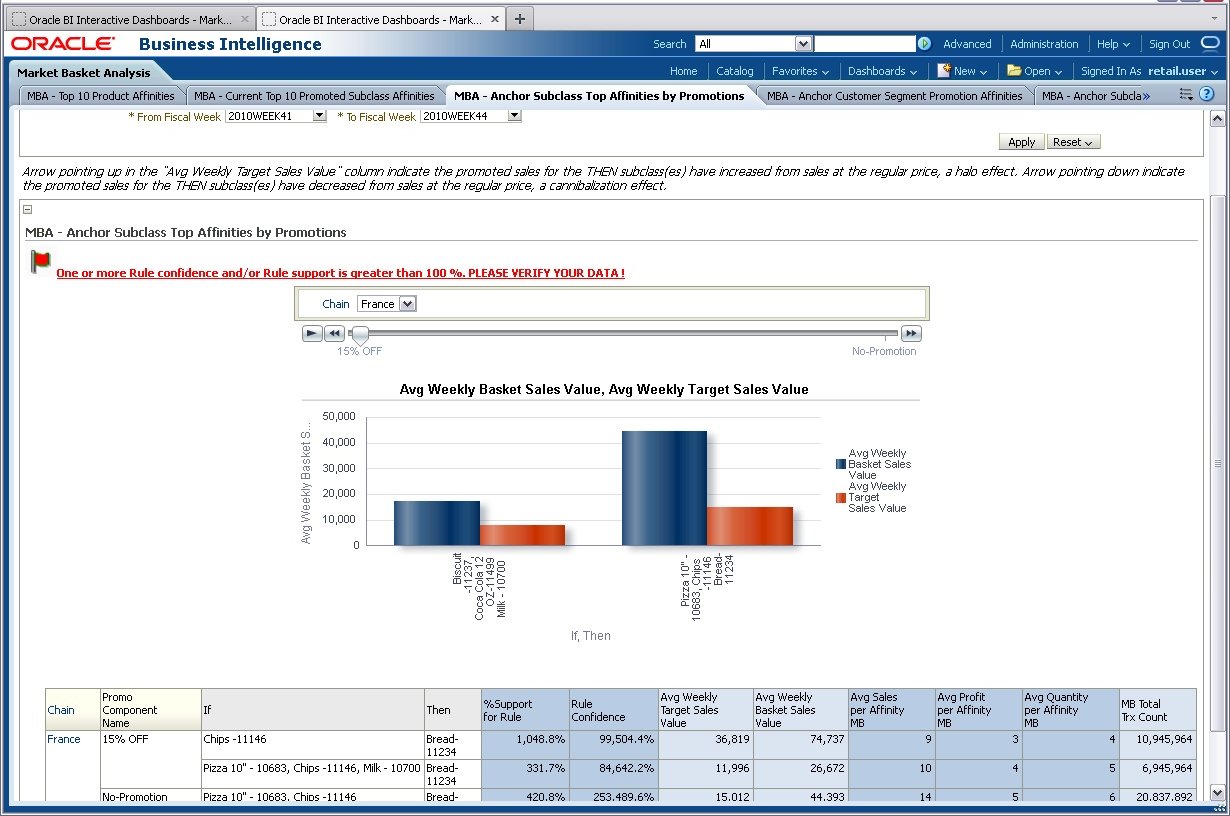
This report provides a view of how much a promotion on a specific subclass drives sales for another subclass. Merchandising and marketing executives can use this information to plan for promotions, because reducing the price on some subclasses may cause a boost in sales of related high-affinity subclasses, without the need to further promote those affinity subclasses.
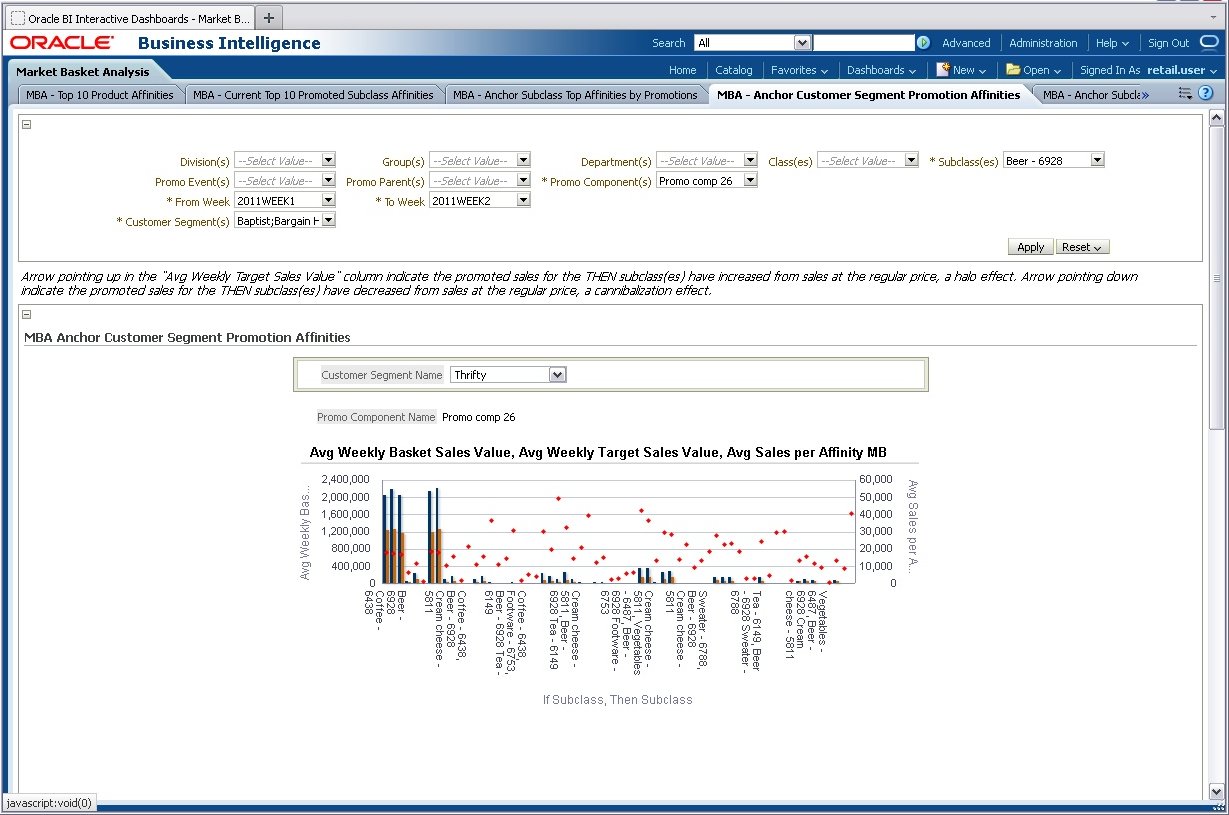
This report provides a view of subclass affinities by customer segment when subclasses are on promotion. Merchandising and marketing executives can use this information to explore customer segments that potentially translate into opportunities for promotions. It can also help in understanding customer habits, to increase the relevancy and potential revenue from different types of promotional events.
This report is run at the beginning of the week by buyers, merchandising executives, and marketing executives, to study the focus on a certain group of subclasses and their (positive or negative) affinities to buy another group of subclasses.
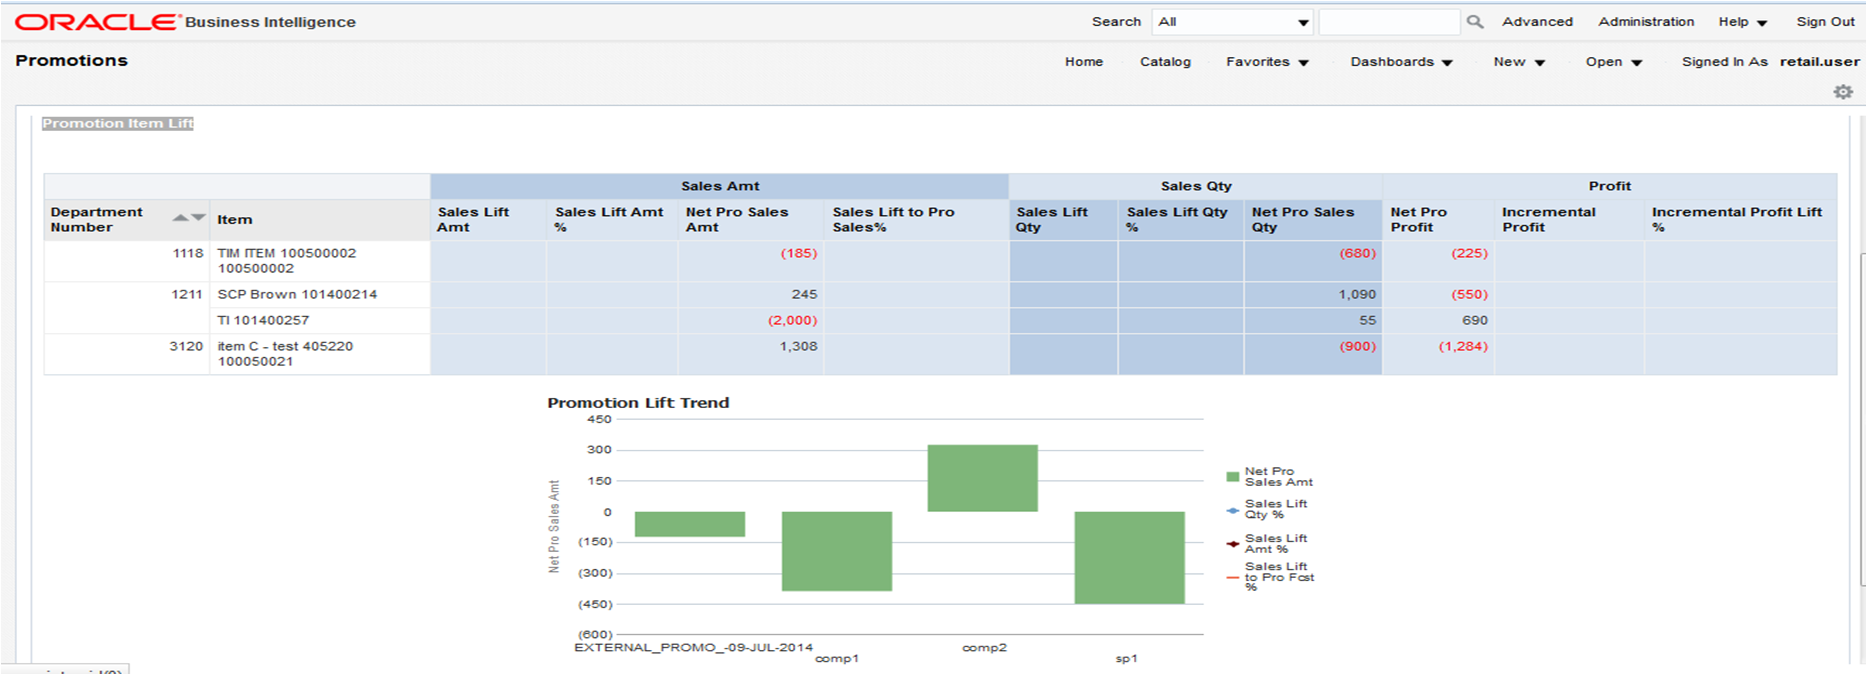
The Promotion dashboard includes the following reports:
This report displays which departments' items are driving sales within a single or multiple promotions. Analysts can use this report to determine which departments' items to promote in the future. They can also use this report to determine which departments' items to promote in advertising methods such as circulars.This report can be run by merchants including planners, buyers, and category managers, as well as financial analysts. Typicall, it will not be used by executive-level managers, because it is at a low granular level.Suppose that a promotion component has been executed across multiple different departments. This promotion component could be seasonal, which is why it would apply to multiple departments. At the end of the promotion component time period, merchants want to know how the promotion performed. They can run this report to determine if a specific department's items sold more often than another department's items. The results of this report can determine whether the same departments will be placed on promotion again, or if those departments did not yield enough sales to warrant a repeated promotion. If one department had more frequent sales, merchants may decide to put more items from that department on the next similar promotion.
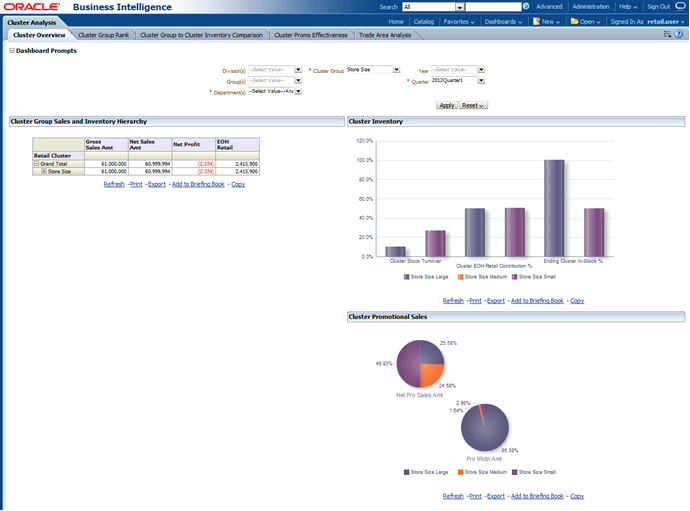
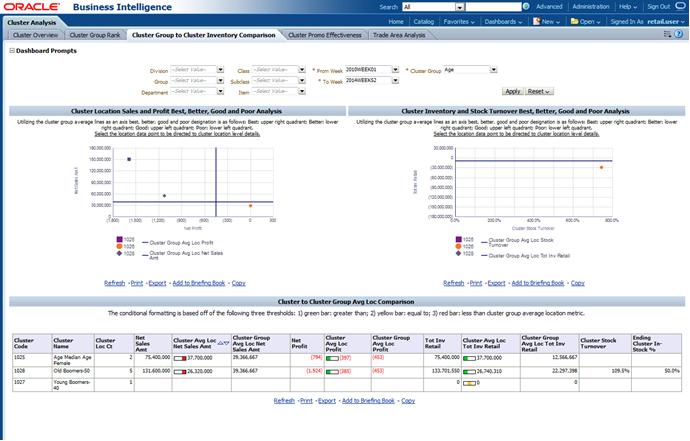
The Cluster dashboard includes the following reports:
This page provides a bird's eye view of a cluster group's performance in terms of sales, profit, inventory, and promotions for a quarter.
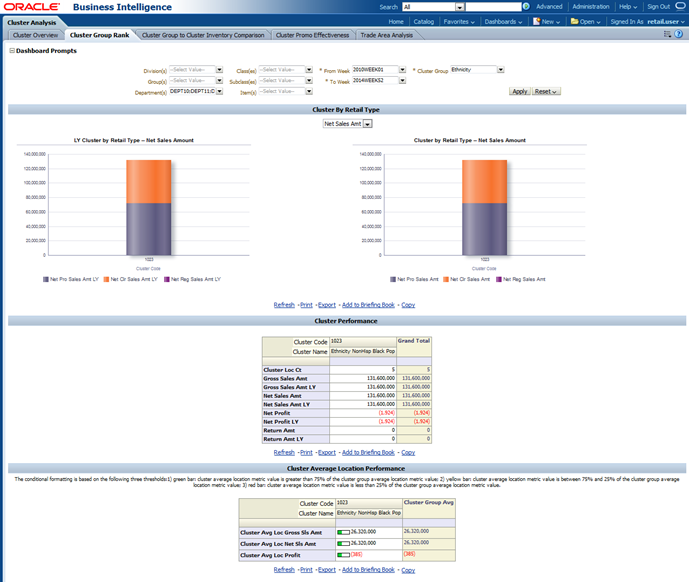
This report compares clusters within the same cluster group to one another. Depending on what the cluster was built for it may make sense to fall in a certain part of cluster rank. For example: a high volume cluster should have higher average location sales than a low volume cluster.
This report has a plethora of visualizations to show inventory investment in comparison to sales and profit performance. By comparing both investment and gains, one should be able to understand if they are investing in the correct locations (implicitly one would understand if they are investing in the right merchandise as clusters have a relationship to a merchandise node).
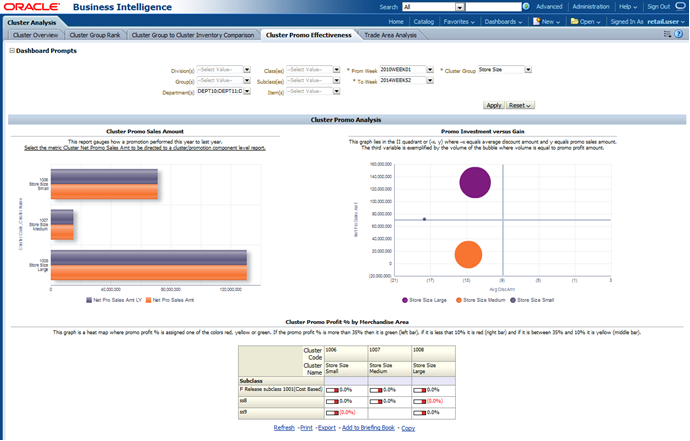
This page looks at promotion sales amount in several different ways: in comparison to profit, promotion savings and forecasted promotion sales amount. These reports combined, give one a good understanding of the effectiveness of their promotions by cluster.
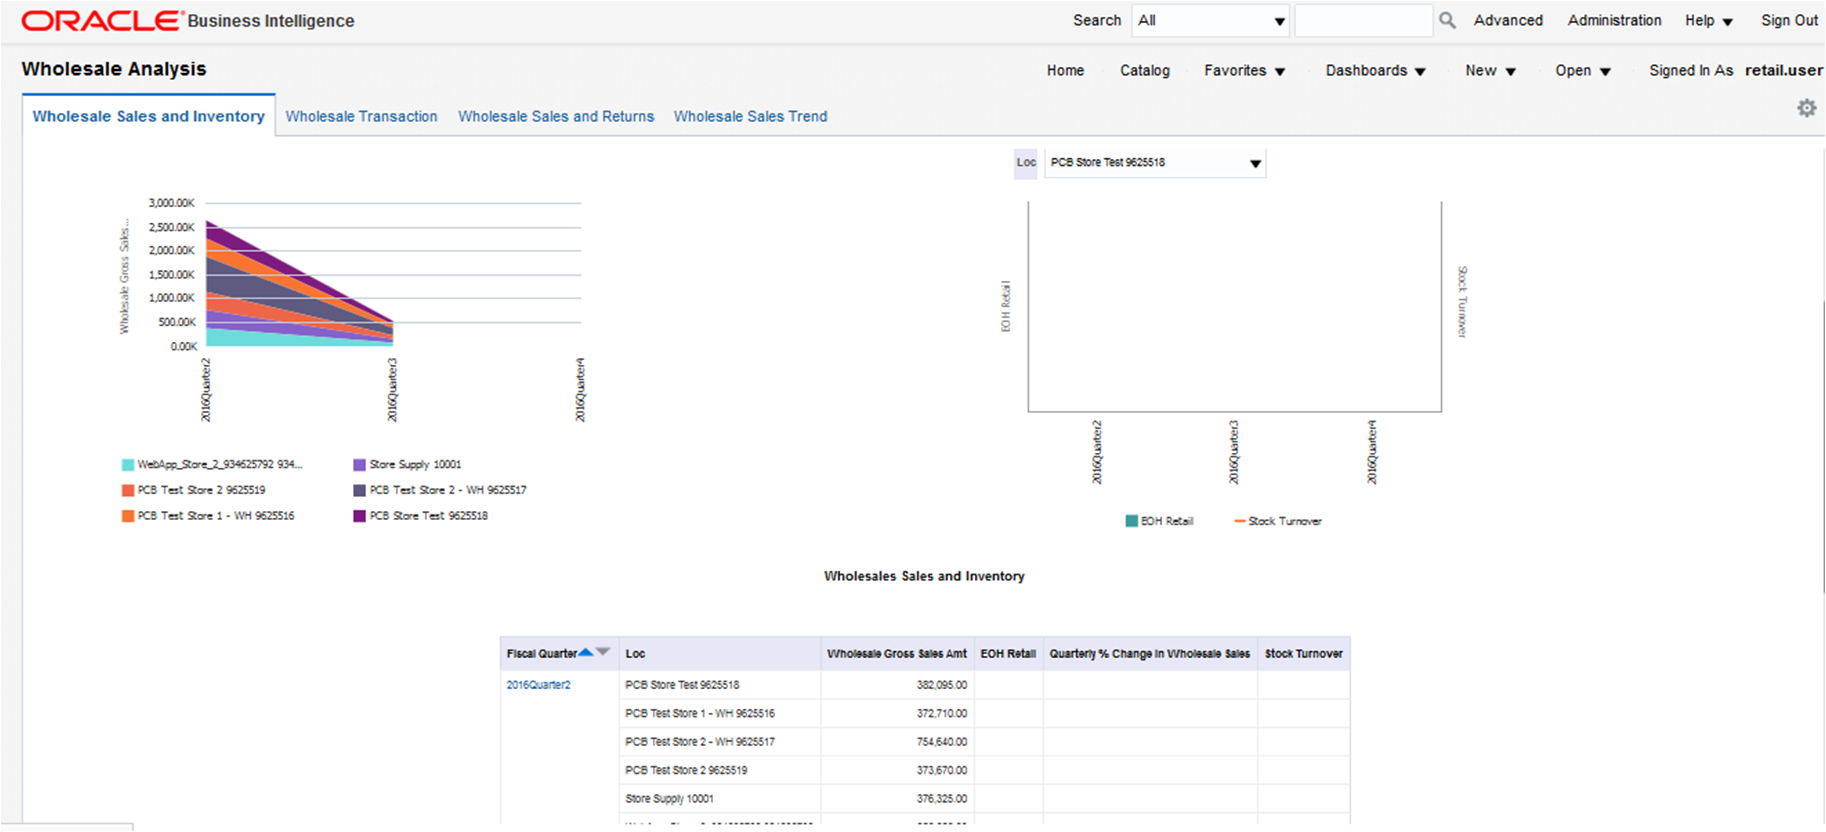
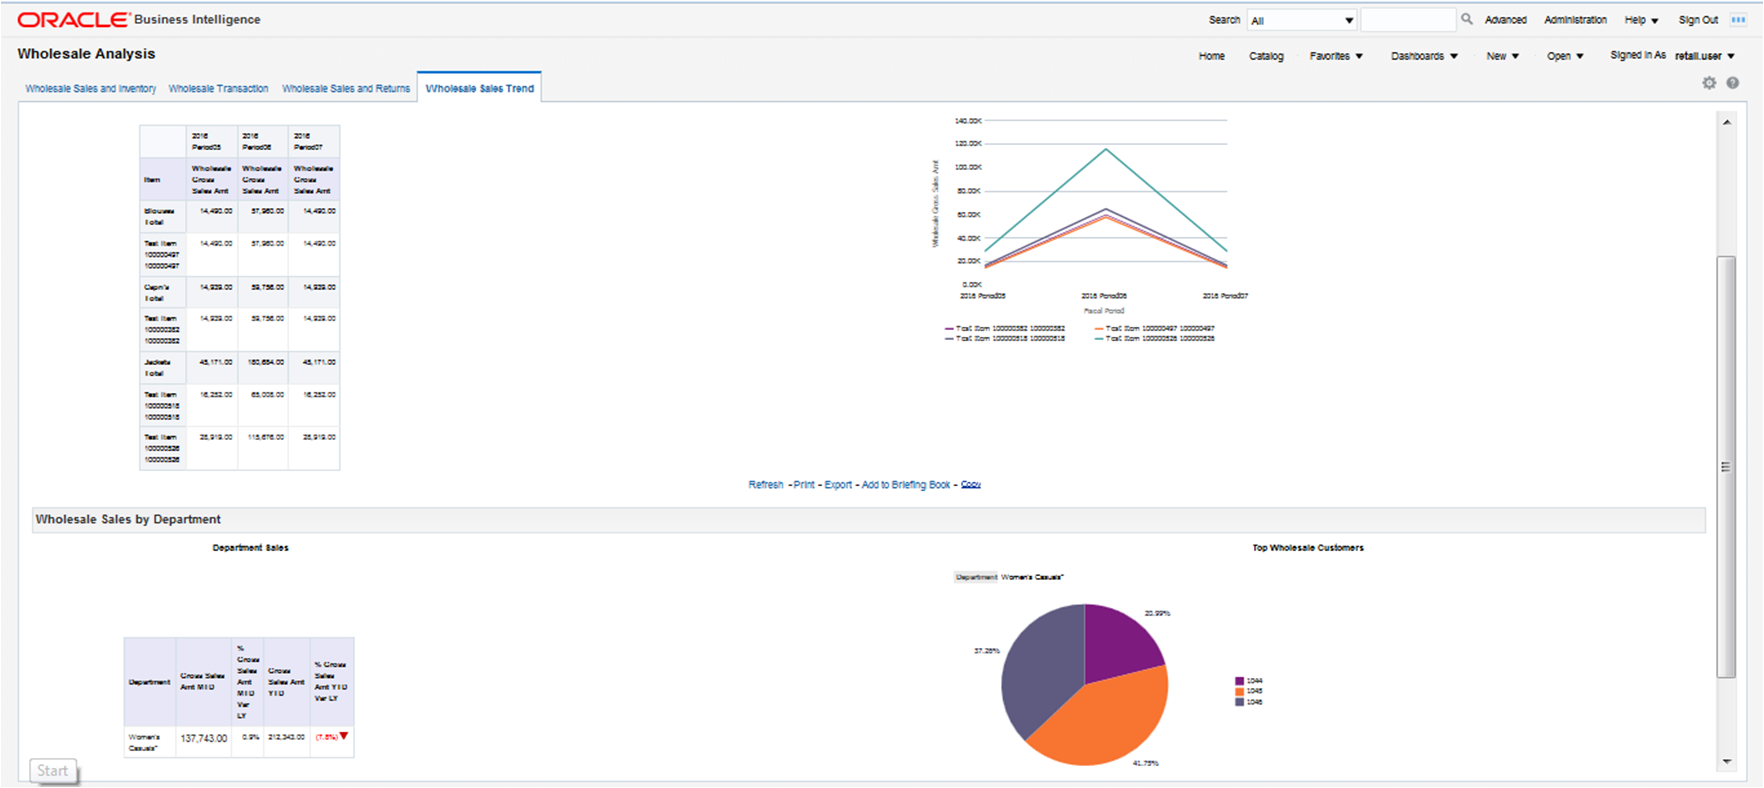
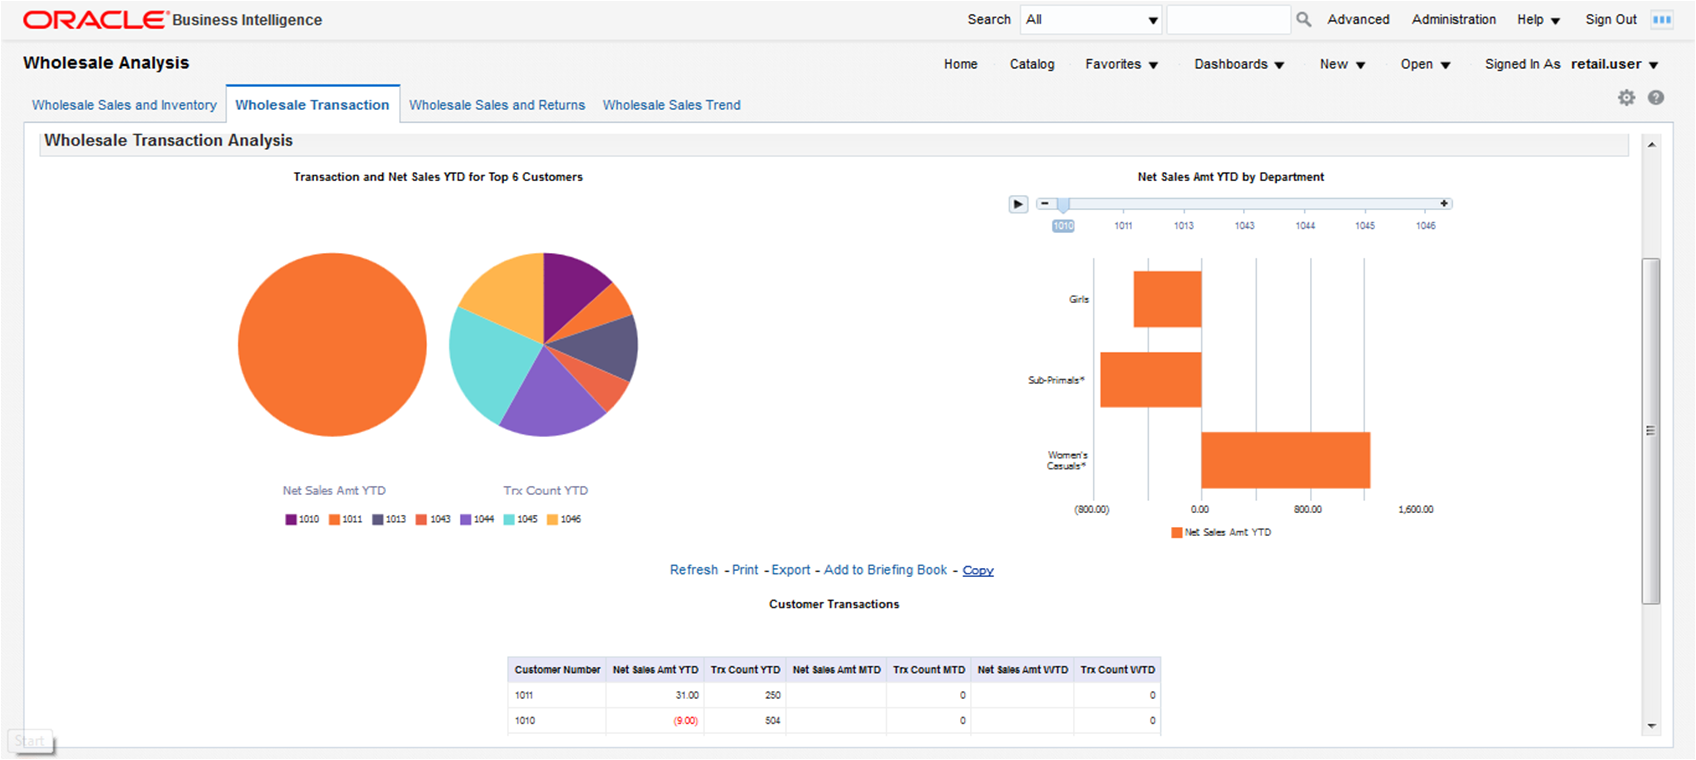
The Wholesale dashboard includes the following reports:
This report provides sales and inventory levels by month for a retailer's wholesale sales transactions, as well as inventory to sales ratio and inventory turns. It could be used by buyers to understand the volume of their wholesale business, and how it may be changing over time, and also whether their inventory levels are appropriate for the volume of wholesale business their category is doing. If the inventory levels are too low they could be missing out on potential wholesale sales, while conversely if inventory levels are too high, they are carrying unnecessary inventory costs that could be spent more wisely elsewhere.
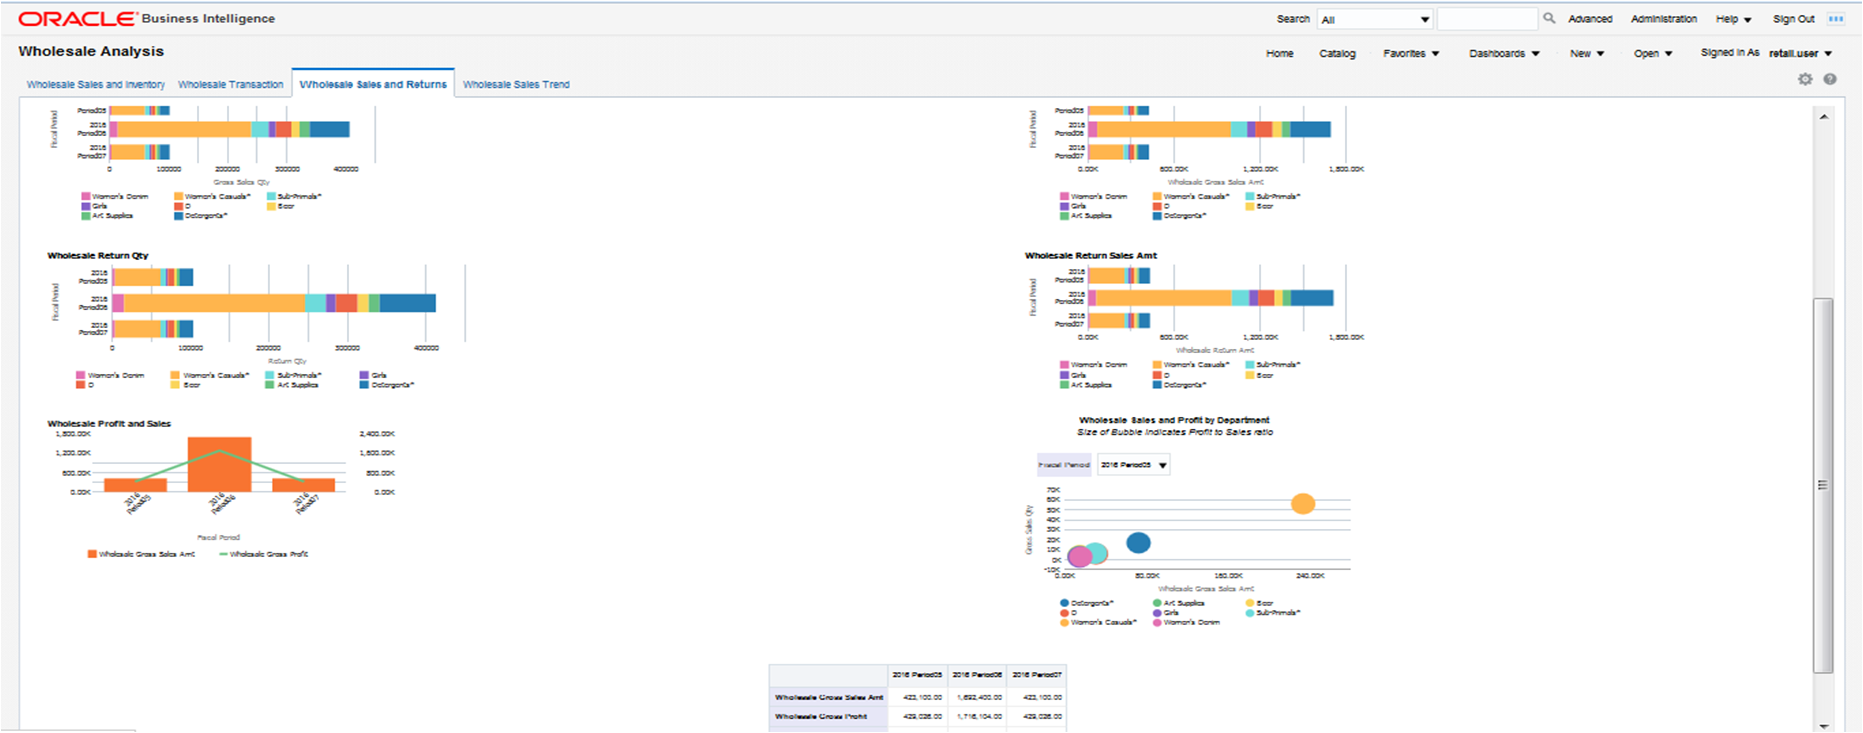
This report shows wholesale transactions, profit, returns, and total sales over time. This information enables buyers and merchandise executives to understand the nature of their wholesale business as separate from their regular retail business, in terms of sales, profits, and returns. If, for example, a buyer is concerned about a large amount of returns in his category that are affecting his sales numbers, by using this report he could determine how much if at all he should be concerned about returns in his wholesale business.
This report allows buyers and merchandise executives to understand sales trends in their wholesale business. It provides sales month to date and year to date and the percentage change over the same time period the previous year.
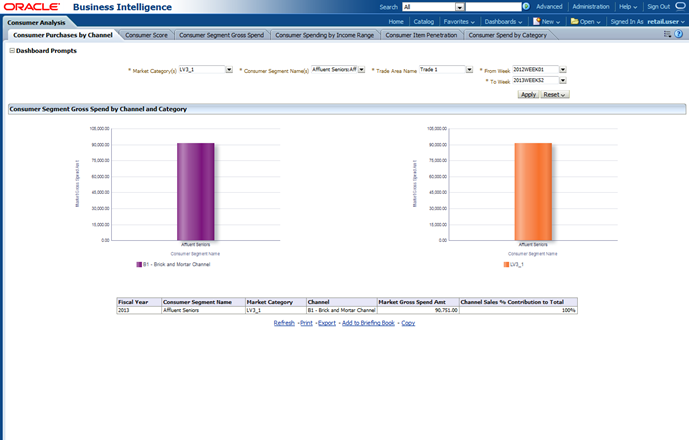
The Consumer dashboard includes the following reports:
This report shows buying patterns by channel for consumer segments. Promotional Planners and Buyers can use this information to target promotional campaigns to the correct channel for the segment they are trying to attract. Assortment decisions can also be made this way, for example, in a region where a desirable segment is buying a category mostly online, the web assortment could be adjusted to be more extensive than the brick and mortar store assortment. If a region shows few online sales but a comparatively large amount of brick and mortar sales, which could give retailers a clue about what types of consumers are shopping there, for example, they might be elderly or poor and have little access to computers.
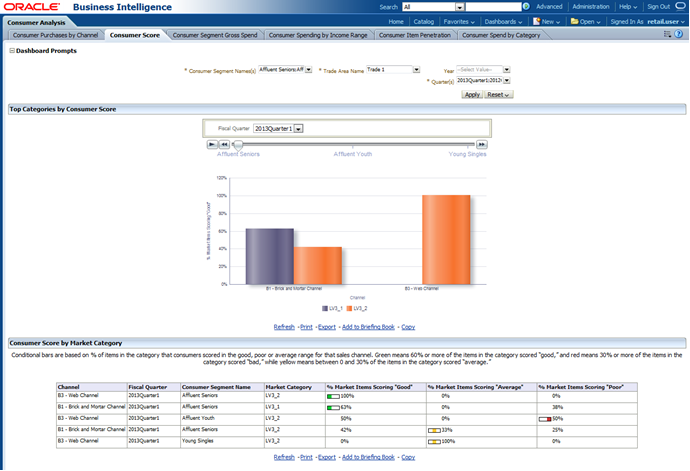
Merchandise Executives, Buyers, and Promotional Planners can use this report to understand how various categories and items are perceived by consumers across the available selling channels by year. It could lead to assortment decisions based on how a consumer segment feels about purchasing a specific category through a specific channel. For example, if a retailer is interested in attracting customers from a certain consumer segment with a clear channel preference, then they would want to assort their category accordingly. It also provides information on consumer perception of the retailer's categories, which can be used to drive decisions about assortments or channel availability that will make a retailer more competitive in its marketplace.
This report can help answer business questions like:
What are my top purchases by consumer segment?
Which products does a particular consumer segment purchase most often?
Answering these questions can help a retailer make assortment decisions that will draw desirable consumer segments to shop at their store. For example, if this report shows a consumer segment spending large amounts on a merchandise category that is relatively underrepresented in a retailer's assortment, they may decide to expand that category's offerings in hopes of attracting that segment's business. Alternatively, if the retailer feels the assortment is not the problem they may choose to run promotions targeted to that consumer segment. This report allows the retailer to be specific about which consumers it is targeting with its sales and promotion tactics.
The time dimension of this report can be used to identify trends in spending by a consumer segment, for example, it may be possible to see shifts in spending from one category to another.
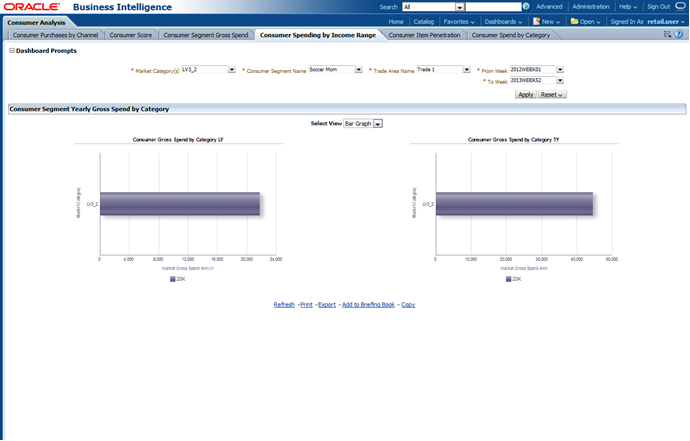
This report shows consumer average spend by income and category for a specific Region. It could be used by Merchandise Executives, Buyers, and Promotional Planners to understand where consumers with different income levels tend to spend the most, so they can tailor assortments and promotions in the region accordingly. For example, if High Income consumers are spending large amounts of money in Frozen, it may be to the retailer's advantage to have a wide assortment of high margin products to take advantage of that popularity.
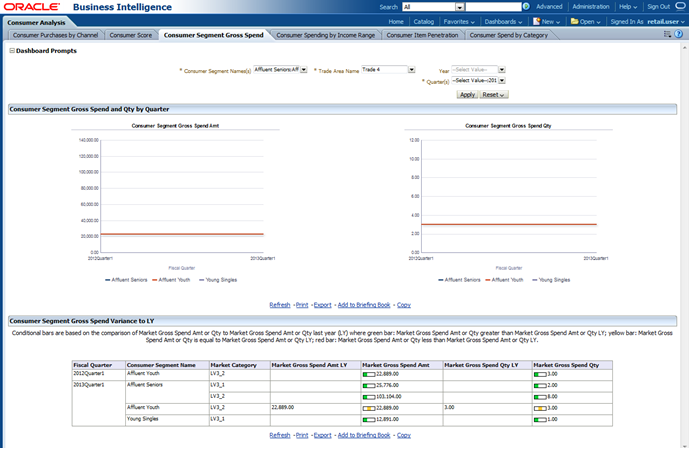
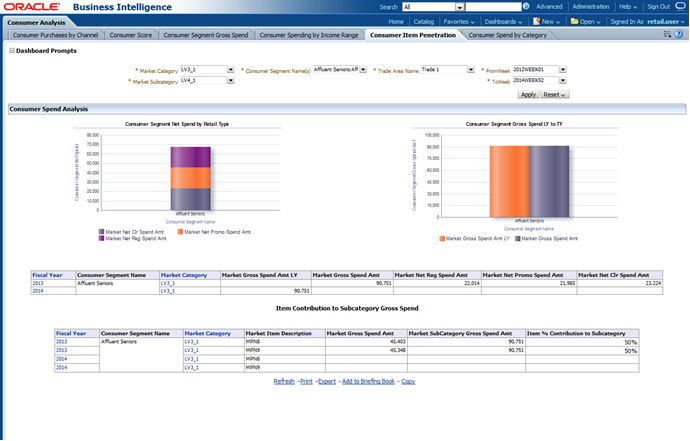
By indicating how much consumer segments spend per trip to a store, how many trips they make, and how much they spend on sale items, the Spend section of this report highlights the important items in a category for various consumer segments, geographies, and time periods. This information can be used by Planning Executives and Merchandise Executives to formulate strategic plans about what consumer groups they should target that would drive the most profitable sales for their category or organization.
The item penetration section will call out what the important items are in a market category, by showing how much of that categories' sales are due to the items within it. This information could be used by buyers to drive assortment decisions within their own department that will attract desirable consumer groups and increase sales of the department in their store.
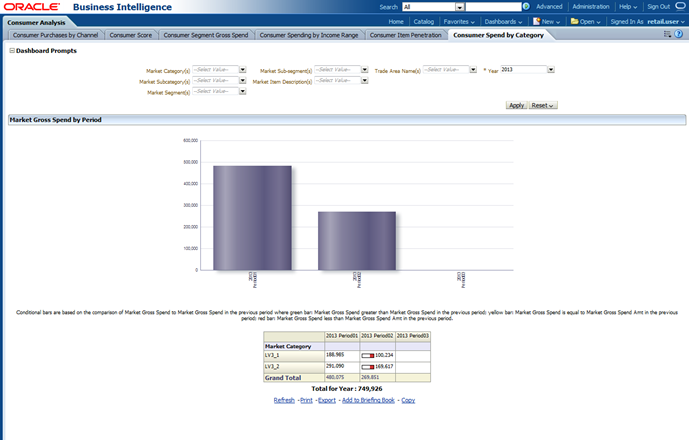
This report shows consumer spend by category. It can be used by Planning Executives and Merchandise Executives to understand on which categories various consumer segments are spending their money, and how that spending is trending over time. This could be useful in planning marketing activity to either capitalize on consumer spending trends or try to counteract trends that are perceived as harmful.
This report could be used to compare a category's performance to the overall market, and thus provide an idea of how a category is performing with a consumer segment compared to the competition. This could help identify strengths and weaknesses of a merchandise assortment, and how those strengths and weaknesses are changing over time, and also some trend analysis.
It answers business questions like:
What type of consumer buys from my category?
How can I encourage other types of desirable consumers to buy from my category?
How has that consumer behavior changed over time?
What is the trend in consumer behavior?
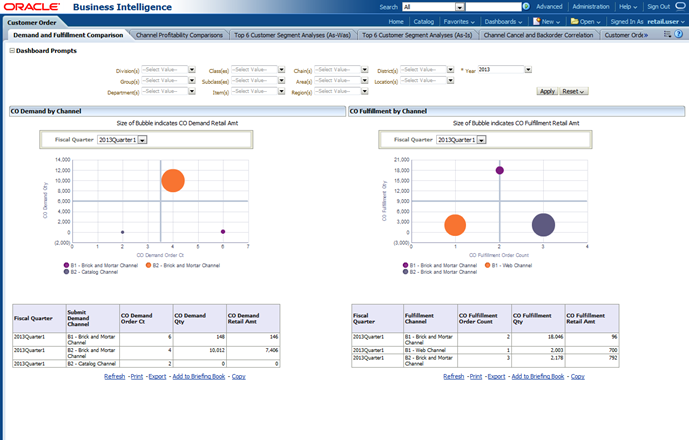
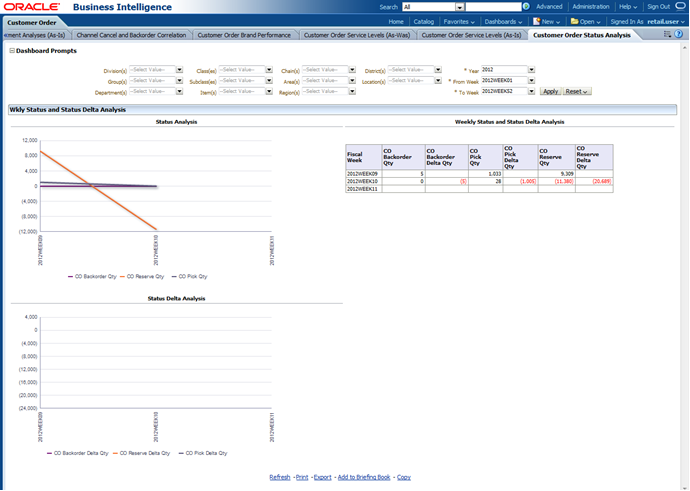
The Customer Order dashboard includes the following reports:
A merchandiser wants to compare demand amount to fulfillment amount by channel to understand how much demand and fulfillment are different by channel. They use this analysis to start the process of understanding where their customers are purchasing from and then they can move to where it is the most profitable for them to fulfill customers' orders.
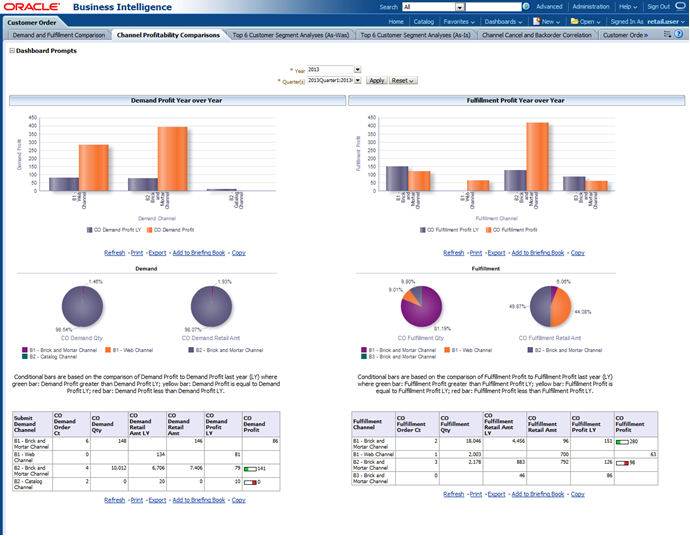
A merchandiser wants to understand if he has the right assortment by channel. He can do this by understanding a) which channel drives the most demand for specific merchandise as well as where that same merchandise is being fulfilled. What's more, he wants to understand which channel it would be the most profitable for a customer to purchase specific merchandise from, so that he can have the correct assortment there.
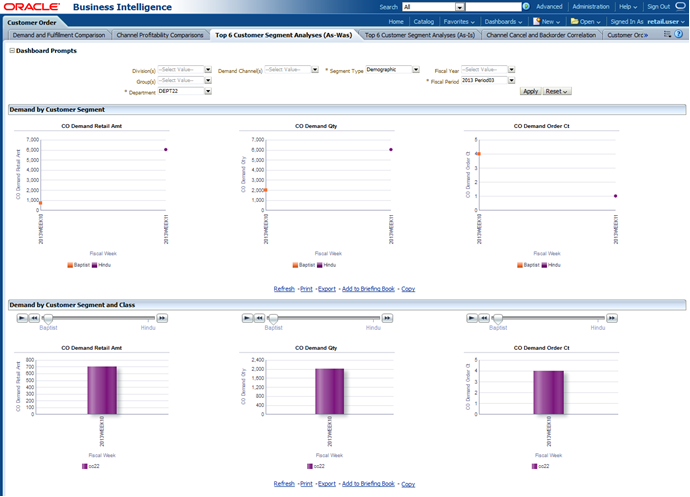
The Merchandising Director and the Marketing Director are analyzing which products resonate with different types of customers in terms of customer orders. They want to understand which channels resonate with the 'Green' customer segment, in order to place their Earth Day campaign in the appropriate channel(s) and addressing the correct merchandise to entice this segment.
The Merchandising Director wants to understand how much business they have "walked" due to excessive backorder days and how that correlates to the customer order amount versus the cancel amount. Essentially, she wants to understand what backorder elasticity there is by customer segment and therefore can do further analysis on what they should have on-hand in each channel.
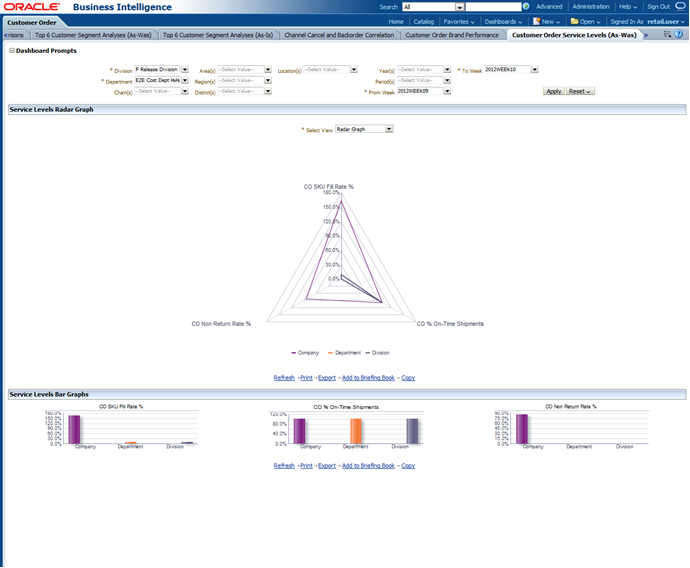
This report is delivered with Period, From Week and To Week prompts set to mandatory and single-select, which results in a time span of four weeks of analysis. The prompts can be customized to span a time period longer than four weeks, but that will negatively affect report performance.
The Merchandising Director wants to understand where demand originates from in comparison to where liability is fulfilled from by brand in order to ensure the correct brands are in the correct locations.
Often times, poor sales or conversion is not because a customer doesn't like an item but rather because service levels are low. A merchandising analyst or buyer, needs to be able to frequently track how their category is doing in terms of CO fill-rate, complete-ship, customer non-return in order to understand what is driving any negative business.
Often times, poor sales or conversion is not because a customer doesn't like an item but rather because service levels are low. A merchandising analyst or buyer needs to be able to frequently track how their category is doing in terms of CO fill-rate in order to understand what is driving any negative business. This way they can attribute negative business to the direct cause: product or other outlier.
The Weekly Business Review in the retail industry is a standard cadence of related meetings speaking to the state of the business. In Retail Insights a set of dashboards are built to facilitate review of company's high-est-level KPIs relative to the company's strategies, goals and objectives. In addition to facilitating those Weekly Business Review meetings, these dashboards also define the workflow of a specific user's day through role-based dashboards.
The role-based dashboards delve into further analysis to understand what happened, why it happened, when to react, and how to change strategies to prevent the same thing from happening going forward. This process aligns to a retailer's need for closed-loop analytics – a framework of detect, then analyze, then act, and finally model.
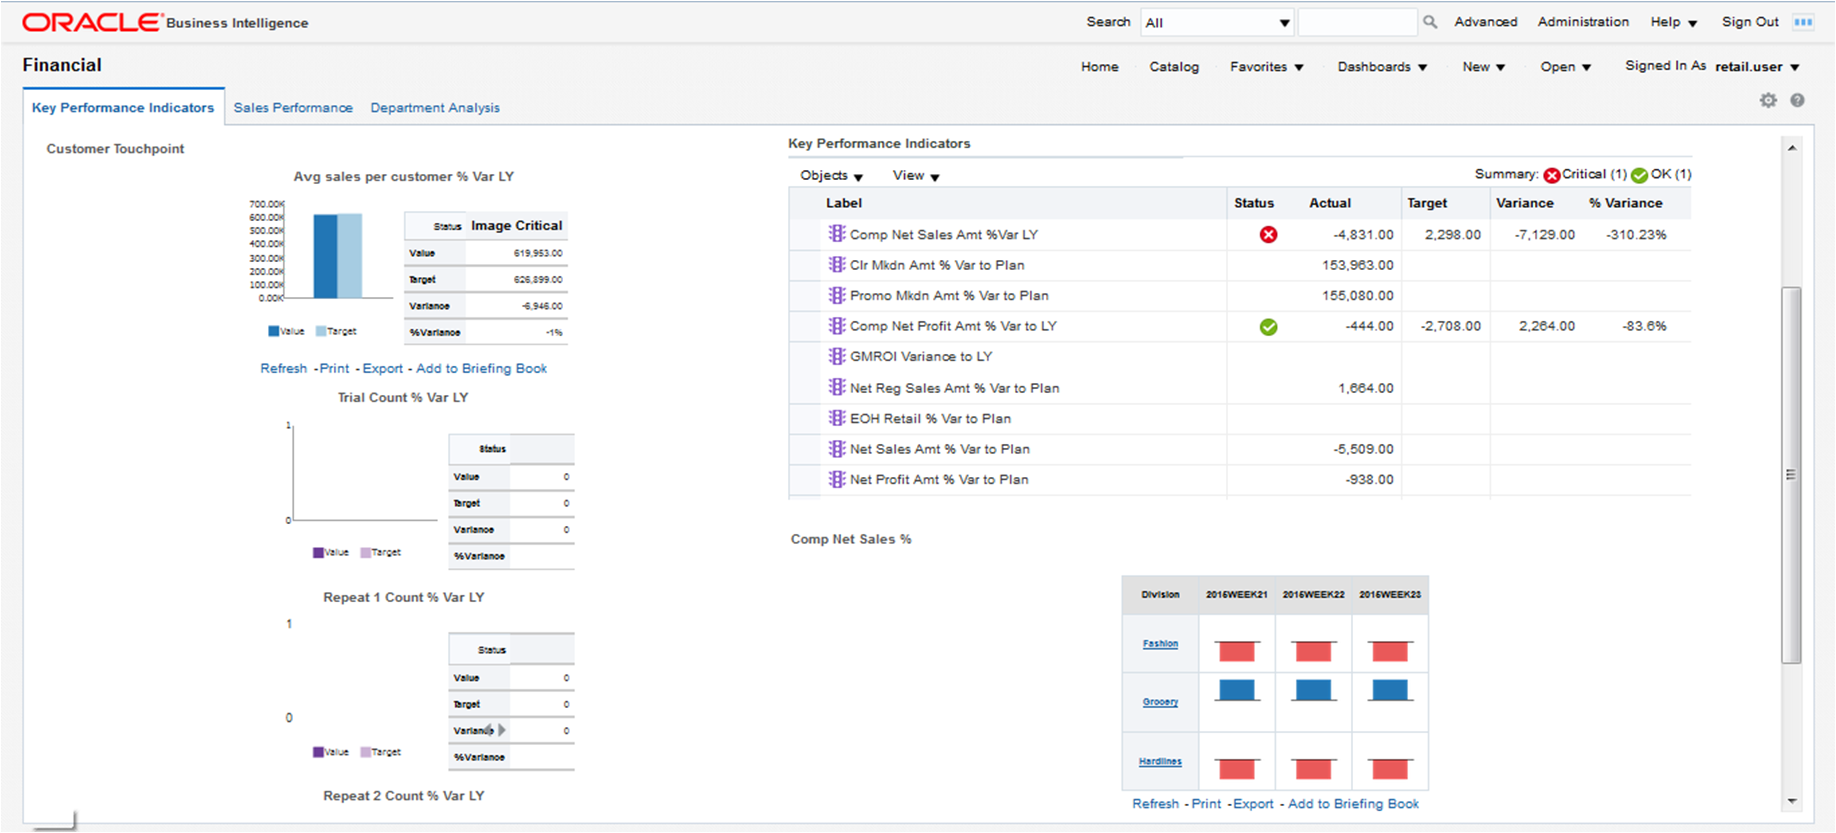
Packaged with this release, the Weekly Business Review dashboard is a CEO-level dashboard that provides an overview of how a retailer is performing in relation to its stated goals, specifically, financial goals. It is designed to be used as part of the following specific business flow:
On Monday morning the CEO checks the state of his company and focuses on the financial performance. He has a list of financial KPIs that are important to him and are based on objectives that contribute to the over-all company goals.
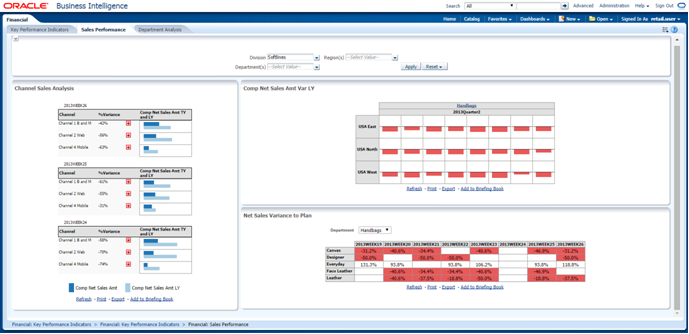
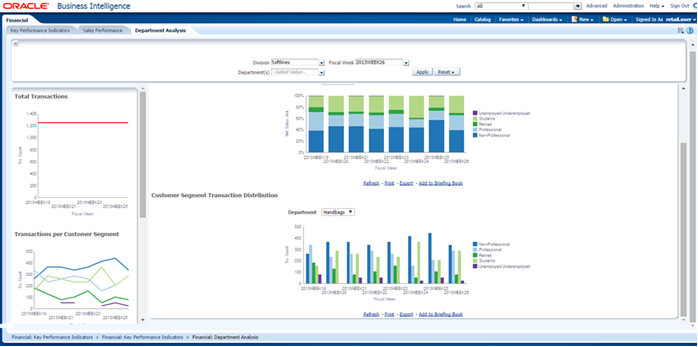
Based on the most important KPI to him or one that catches his eye, he looks at the Comp Net Sales % analysis to see which divisions are causing the issue. The CEO contacts the responsible divisional manager who does further research using first the Sales Performance dashboards. After the divisional manager identifies the buyer responsible for the relevant department, he will alert him and the buyer will then use the Department Analysis dashboards to determine what action to take. Those dashboards enable sales and inventory analysis as compared to their respective plans, as well as some customer sales and transaction analysis.
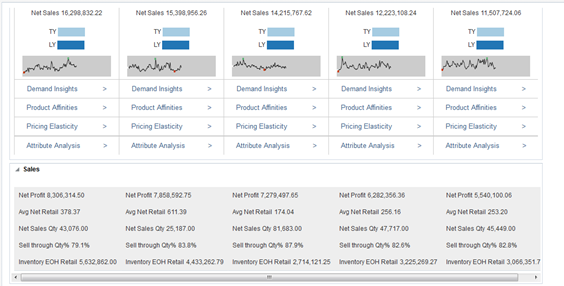
The Chief Marketing Officer (CMO) dashboard helps to analyze sales performance by comparing current sales to the previous year's sales and current plan. This dashboard enables analysis of where demand is being generated, product affinities, attribute analysis, pricing elasticity, sales, different customer segments behavior and channel performance of items consolidated in one dashboard. Please see some selected example CMO pages below.
The Key Performance page enables analysis of year over year sales and sales to plan for the selected merchandise hierarchy level for regular, promo, and clearance sales. It includes Key Performance Sales to Plan analysis that compares regular, promo, clearance, and total sales to plan, with a collapsible merchandise hierarchy displayed on the left, and the Key Performance Year over Year analysis that compares regular, promo, clearance, and total sales to the previous year, with a collapsible merchandise hierarchy displayed on the left:
Using the Top Sellers page the user can switch between views of top sellers and bottom sellers that rank and display the best and worst selling items from the selected subclass:
The Demand Insights page allows users to switch between a map based fulfillment analysis and a trending over time liability analysis:
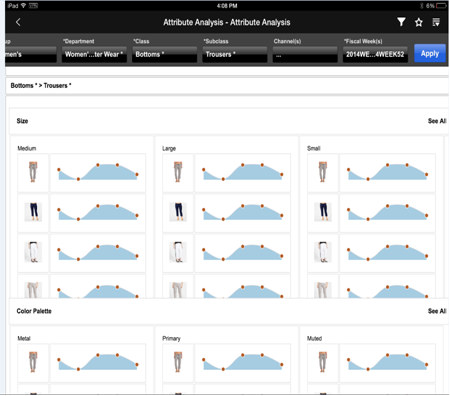
The Attribute Analysis page displays net sales per item attribute from the selected merchandise hierarchy level:
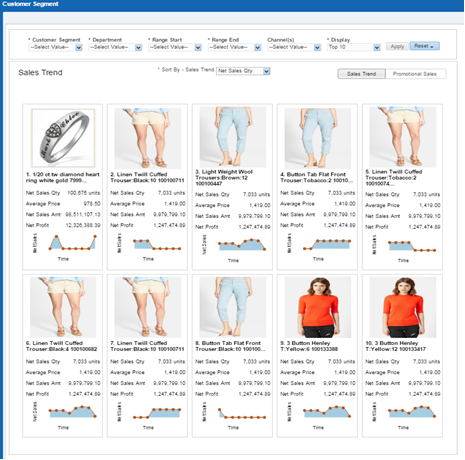
The two Customer Segment pages analyze sales by item and customer segment.
On the Customer Segment Sales Trend page, prompts enable users to select the customer segment and date range to be analyzed. The item image, item name and the items' corresponding Net Sales Amount, Net Sales Quantity, Average Price, and Net Profit for the selected date range are displayed, along with a line graph of the item's Net Sales Amount over time. Ten items are displayed by sorted by Net Sales Amount by default, but users can change the number of items displayed and the sorting of items by various metrics using drop down selectors. With the click of a button the user can switch to the Promotion page. This flexibility enables a variety of different analyses within a single dash-board page.
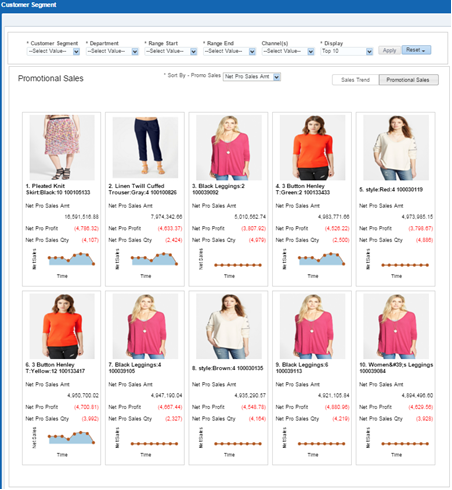
The second Customer Segment report, Promotional Sales, enables analysis of the sales due to promotions by item and customer segment. The prompts enable users to select the customer segment and date range to be analyzed. The item image, item name, and the item's corresponding promotional sales metrics for the selected date range are displayed, along with a line graph of the item's Net Sales Amount over time. The top ten items by net sales amount are displayed by default, but users can change the number of items displayed using a drop-down selector, as well as changing which metric the items should be sorted by, either net promotional sales quantity, net promotional sales amount, or net promotional profit. This flexibility again enables a variety of different analyses within a single dashboard page.
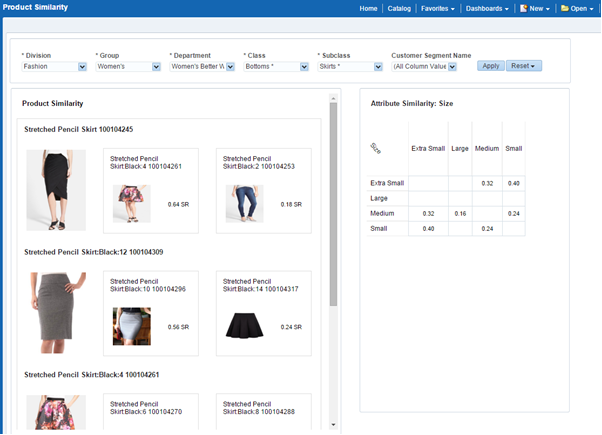
Retail Insights consumes similarities from Oracle Retail Advanced Science Cloud Service. Using transaction based similarities, customer segment behavior in buying patterns and changes in demand can be analyzed. Similarities calculate how likely a customer is to switch from one item to another in a range from 0 to 1. For example, if the similarity rate for Skirt A and Skirt B is 0.64 while the similarity rate for Skirt A and Skirt C is 0.18, the customer is more likely to switch to Skirt B than Skirt C.
The same type of analysis can be done on item attributes such as color, fabric, style, etc.
The Similarity Score dashboard page consists of two complementary analyses, item similarity and attribute similarity, positioned side-by-side for maximum contextual analytical possibilities.
This first is a scrolling display of items and their images, alongside the most and least similar items and their images. The appropriate similarity rate is displayed alongside the two comparison items.
The second has a table that displays a list of attributes and their corresponding Similarity Rates. The selected attribute is displayed at the top, and the attribute values are displayed along the top and down the left side of the table. Where the attribute values meet, their Similarity Rate is displayed.