| Oracle® Retail Insights Cloud Service Suite User Guide Release 18.0.001 F17007-01 |
|

 Previous |
 Next |
| Oracle® Retail Insights Cloud Service Suite User Guide Release 18.0.001 F17007-01 |
|
Previous |
Next |
Predefined reports are packaged with Retail Insights and available on several sample Oracle BI dashboards. You can use these packaged reports without modifications to begin reporting on your retail measures. You can also use these reports as foundations or examples for building your own custom reports. Each packaged report includes dashboard prompts, to allow a user to refine and focus the data in the report for the subset of the retailer's business measures that you need to investigate.
In addition to the predefined reports, Retail Insights includes a variety of predefined, fundamental metrics that are common throughout the retailing industry. Some of these are used in the packaged reports, and you can use any of the metrics in your own custom reports. See Chapter 6, "Metrics" for more information.
|
Notes: Before viewing reports, ensure that the Retail Insights nightly batch runs have completed successfully for the report subject area, so that you can analyze the most up-to-date data.Moving, removing, or re-ordering of the columns or prompts on any predefined report is not recommended as they have only been tested as they are currently configured. Make a copy of a report if you would like to modify it or re-use it elsewhere. |
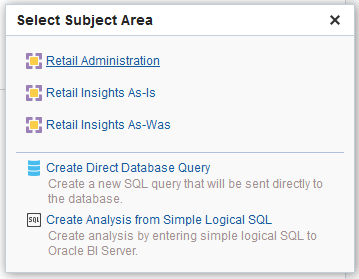
The packaged Retail Insights metrics used in these sample reports are found under the different Retail As-Is and Retail As-Was subject areas.
See Chapter 4, "Creating and Modifying Reports" for more information about as-is and as-was analysis methods.
See the Oracle Retail Insights Implementation Guide for information about adding reports in different subject areas.
Retail Insights includes a set of reports and analyses referred to as the Empowered Commerce dashboards. These dashboards provide a broad overview of some of the core features and functionality available in Retail Insights while demonstrating report design best practices and numerous visualization methods.
The table below lists all of the pages in this dashboard. The table identifies each main reporting area along with the sections in each tab.
Table 3-1 Empowered Commerce Dashboards
| Dashboard Page | Sections |
|---|---|
|
Dashboard |
Overview Top 10 Items Failed Items Missed Opportunities Projected OOS High Returns Category Analysis |
|
Sales Performance |
Company Daily Sales Divisions with Exceptions Departments with Exceptions Classes with Exceptions Stock Ledger |
|
Pre Season Planning |
Planned Sales Last Quarter Planned On Hand Last Quarter Planned Margin Last Quarter Store Recap Monthly Returns |
|
In Season Planning |
Selling Styles Projected Sales Brand Recap Inventory Aging |
|
Channel Sales |
Daily Sales Daily Comp Sales Daily Non-Comp Sales Top 10 Stores Regional Exceptions Online Sales Wholesale |
|
Inventory Analysis |
On Hand Unavailable On Order Order Exceptions |
|
Promotion and Clearance |
Active Promotions Active Campaigns Planned Promotions Past Promotions Past Campaigns Promotion Sales Promos with Exceptions Clearance Sales Non-Clearance Sales |
|
Customer |
Active Customers New Customers At-Risk Customers Attribute Analysis Channels Analysis Backorders Coupons Customer Inquiry |
|
Customer Segment |
Customer Spend Top Bottom Styles Returns Analysis Promotion Geographic Analysis Market Analysis |
|
Loyalty |
Loyalty Daily Flash Points Analysis Top Stores Bottom Stores Member Spend Overall Spend |
|
Vendor Performance |
Vendor Summary ASN Compliance Ship Compliance PO Compliance |
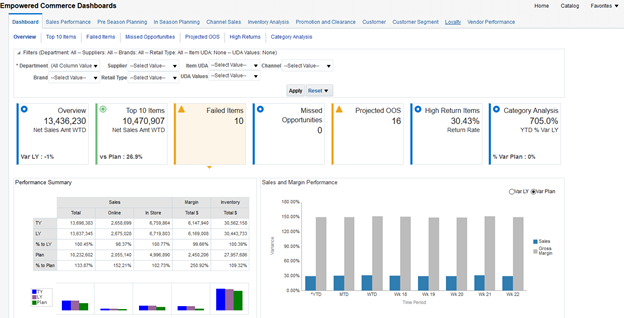
The Dashboard tab is intended to provide a high-level overview of company performance as of the current business date, and provides an area for KPIs that are important to monitor on a regular basis, such as sales, inventory and margin performance to Plan and LY. Each section within this tab aims to highlight exception-level reporting where the user may need to take action or further analyze data. Filters can be applied to limit the results to a specific department or by various product attributes.
The Overview section includes a table and bar graph showing this year, last year, and planned values for sales (by channel), inventory, and margin. It also shows a bar graph for variances to last year and plan with multiple timeframes (week, month and year).
This report shows the top selling items for the current week, compared to LY and Plan. This section is intended to highlight the best items relative to the filter criteria, and could be extended with additional KPIs specific to how a retailer analyzes their top items.
This report shows the worst items for the current week compared to LY and Plan. This section is intended to highlight items which are not selling well or not performing to plan, and the criteria for identifying failed items could be tailored to meet business needs.
This report shows items which could be considered missed opportunities for additional sales, due to historical performance of the item relative to on-hand and on-order inventory levels. Thresholds are provided to filter for items meeting specific sell through or on-order criteria.
This report shows currently selling items that will be going out of stock within a certain number of weeks, and could require additional orders be placed to replenish inventory levels.
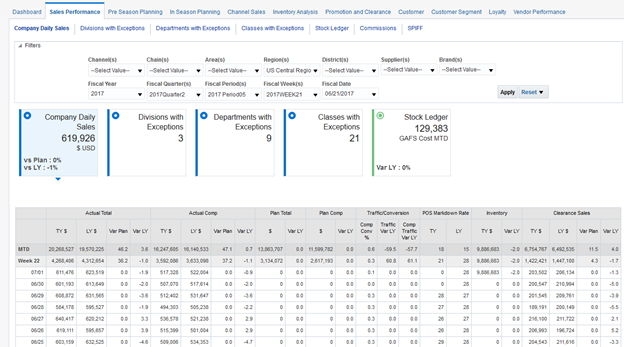
The Sales Performance tab is intended to provide more detailed coverage of sales activity and how the company is tracking to LY or Plan. Sections in this page could be focused on executive level reporting of daily/weekly sales analysis, as well as discovery of exceptions in a department or class that could be cause for concern.
This report shows daily sales performance to LY and Plan with weekly rollups for the current month to-date, alongside a variety of business KPIs such as store traffic and clearance sales.
This report aims to highlight major sales exceptions at the division level where data has deviated from LY by a certain threshold across all to-date timeframes.
This report aims to highlight major sales exceptions at the department level where data has deviated from LY by a certain threshold across all to-date timeframes.
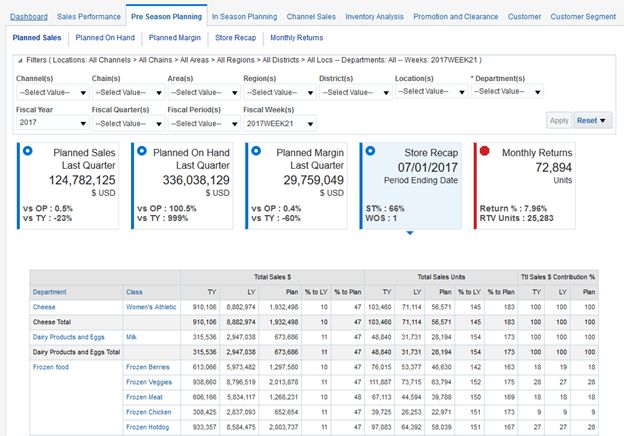
The Pre Season Planning tab contains several reports intended to analyze the last completed historical period or quarter to review how the company performed to plan. The goal of this tab is to provide details around where sales and inventory measured up to the plan, in order to account for it in future plans being generated outside of RI.
This report shows how sales units and amounts compared to Plan and LY, as well as class contributions to department sales.
This report shows how on hand units and receipts compared to Plan and LY by department and class.
This report shows how sales margin and percents compared to Plan and LY, as well as class contributions to department sales.
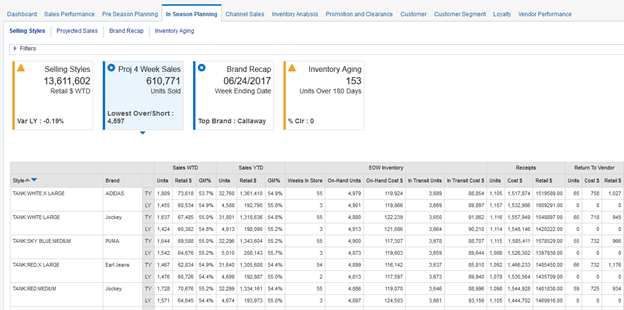
The In Season Planning tab contains several reports intended to analyze the current period's performance across different intersections of data that may be relevant to various in-season planning activities.
This report show current week and year to-date performance of the top selling styles, limited to the filter criteria on the dashboard. The report provides a snapshot of where the styles are in their lifecycle, covering sales, inventory, receipts, and RTVs.
This report shows the last 4 weeks of sales along with a moving average and projection of future sales. It also compares this projection to current inventory levels to identify where the largest overages/shortages may occur.
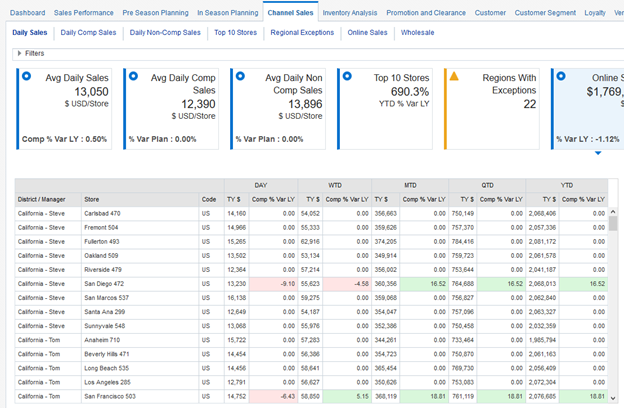
The Channel Sales tab contains several reports intended to analyze performance geographically, such as by store or region. It also reports on data by selling channel, such as Online and Stores. It is a common business practice to report and plan channels individually, as well as analyze individual store performance.
This report shows store-level performance across all timeframes from day to year, with exception-based highlighting to quickly identify major variations from LY.
This report shows only comparable store performance based on the Comp Store configuration defined in RI. Retailers may customize the comparable store flags to control which stores are used in comp/non-comp analyses throughout the solution.
This report shows only non-comparable store performance based on the Comp Store configuration defined in RI. Non-comparable stores can be flagged as such if they recently opened or underwent major renovations.
This report shows the top-performing locations in the company, further limited by the filter criteria, such as when analyzing a specific region or country.
This report shows an example of using exception-based reporting to highlight problem areas based on regional performance compared to last year, which could be an indication of external influences on sales, such as natural disasters or changing demographics.
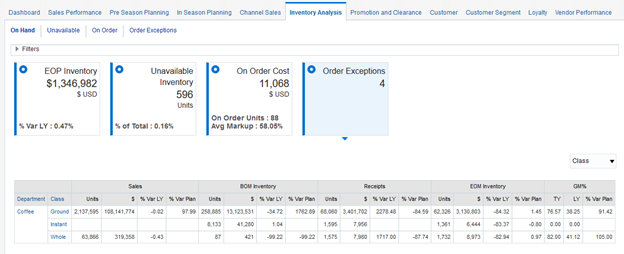
The Inventory Analysis tab contains several reports intended to analyze inventory at various points in the lifecycle, such as On Order, On Hand, and Unavailable inventory. Monitoring inventory levels and costs from the time it's ordered until it is sold or returned is an important function of every business, and RI provides many different views into this data.
This report provides an overview of inventory movement within a fiscal period, covering beginning and ending on-hand, as well as sales and receipts, by department or class. Comparisons to LY and Plan provide an exception-based tool for spotting large variances in inventory levels.
This report describes the inventory that has been placed into an unavailable status in the merchandising system, such as products that are in dry-cleaning or have been damaged and need to be pulled from the store.
This report shows details of all active Purchase Orders sent from the merchandising system, including important attributes about the order such as approval and not-after dates, items already received, and remaining units on order.
This report highlights orders which have been over-received, meaning that the number of units that arrived in the warehouse was greater than what the buyer ordered. Over-receipts can be a cause of confusion when looking at aggregate order and receipt data, as only when reviewing the individual orders can you see which ones caused more receipts than expected.
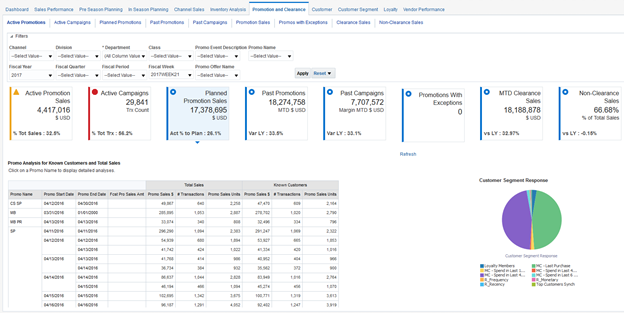
The Promotion and Clearance tab contains reports focused on discounted sales due to promotions or clearances, as well as analyzing specific events and campaigns. Across the sections in this dashboard, it is possible to see all sales for different promotions and drill into the customers or segments generating those sales, as well as compare to planned promotional sales and review trends over time.
This report shows all active promotions generating sales transactions, along with details of the sales and number of transactions for each promotion. It is also possible to drill into a specific promotion to see the different offers and deals associated with it and the performance of each one. This data is further split by customer segment to understand which customers are participating in the promotions.
This report shows all active campaigns generating sales transactions, along with details of the sales and number of transactions for each campaign. It is also possible to drill into a specific campaign to see the different promotions associated with it and the performance of each one. This data is further split by customer segment to understand which customers are participating in the campaigns.
This report shows the weekly trend of promotional sales compared to LY and Plan, to quickly identify exceptions where actual sales are over- or underperforming. The data is further split by channel to see performance across stores or web only.
This report provides a method for comparing this year and last year promotions over a period of time. The retailer may have run a number of promotions for the first time this year, and is interested in seeing how the sales look compared to the same timeframe last year, to see how effective the new promotions were.
This report provides a method for comparing this year and last year campaigns over a period of time, similar to the past promotions report.
This report provides a high-level summary of promotional sales performance over a period of time, alongside the promotional markdown amount incurred due to the price changes.
This report show a comparison of promotional sales with forecasted and baseline sales calculations. Forecasts can be fed into RI and used for sales analysis, while the promotional baseline is a calculated measure of average sales during the period without promotional effects. This report provides insights into how good or bad a promotion performed relative to regular sales patterns and external predictions.
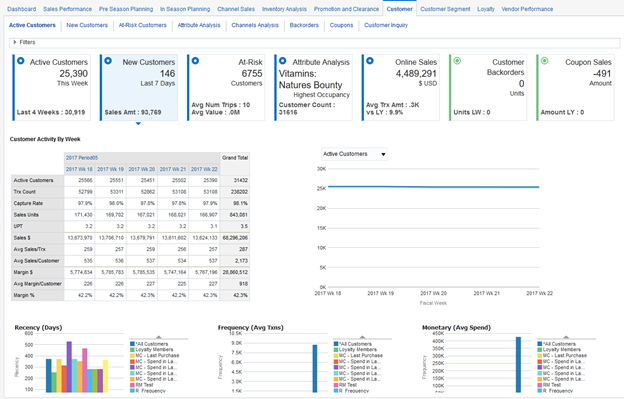
The Customer tab contains reports focused on the behavior of a retailer's customer base over time. These reports look at various parts of a customer's lifecycle, such as new customers making their first purchase, or customers that have not made a purchase in a long time and are at risk of lapsing.
This report focuses on reviewing the sales patterns of known customers over time. A known customer could be any person that has a unique identifier in a retailer's POS system, and the system has linked that ID to sales transactions. Comparing known customers to your overall sales patterns can reveal key insights, such as known customers having a higher spend per transaction or generating higher margins.
This report looks at new customers, based on the first purchase date of a customer falling within a certain timeframe. Understanding what new customers are purchasing can describe who you're attracting to your business and how much they are spending.
This report shows the historical sales generated by customers that have lapsed, meaning they have not made a purchase in some time. It further breaks the sales out by type (regular, promotional, and clearance) to understand what these lapsed customers were buying.
This report provides a summary of customer attribute data gathered by a retailer's CRM systems, alongside a measure of occupancy, or how many customers have data for a certain attribute. A marketer can use this data to focus on specific attributes of their customer base that is very well known across a large number of customers, or they can identify data they would like to gather from customers that they do not have today.
This report analyses customer sales by channel, such as comparing Online and Store sales just for your known customers. The report also adds a specific category for omnichannel sales, which is any customer that has made purchases both online and in-store.
This report looks at any customer orders which are in a Backordered status in the order management system and provides a way to drill into the specific customers and orders which are not being fulfilled. It also shows a trend of backordered units over time to identify any patterns or highlight spikes in backorders during certain periods.
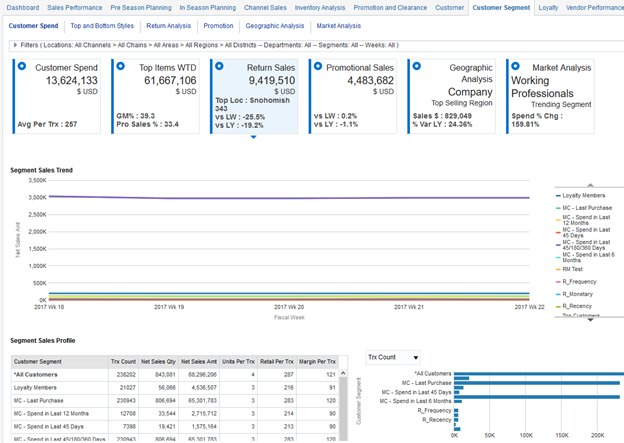
The Customer Segment tab contains reports focused on the behavior of individual customer segments defined by the retailer. Customer segments could be defined by the Customer Engagement solution or through the Science platform. Grouping customers by segment exposes patterns not easily identifiable when looking at the entire customer base, such as a particular segment spending much more than average during holiday promotions.
This report focuses on analyzing sales patterns by customer segment, such as the total sales generated by a segment over time, what products each segment is buying, and how they compare to each other.
This report looks at the top and bottom items being sold by segment, ranked by metrics such as sales or margin. Identifying the most popular items sold to a particular segment can be a driver of targeted offers and promotions and give insights into the buying behaviors of those customers.
This report analyzes the products that are being returned by different customer segments, further broken down by locations receiving those returns. Certain segments may be generating the bulk of a retailer's product returns, or the returns may only be occurring at one or two locations, and the retailer will want to dig into the cause of those returns.
This report focuses on promotional sales trends by customer segment, to identify segments that are participating in promotional activity. It further breaks down the data by channel, in order to see where the promotional sales are occurring for each segment.
This report breaks down customer segment data across geographic regions, identifying where the customers in a segment are shopping, as well as the top locations for the segment.
This report shows market consumer data generated by a 3rd-party provider, for use in understanding market trends and target segments that are being analyzed. The retailer may use market data when determining which customer segments they will create and use in RI for reporting over a period of time.
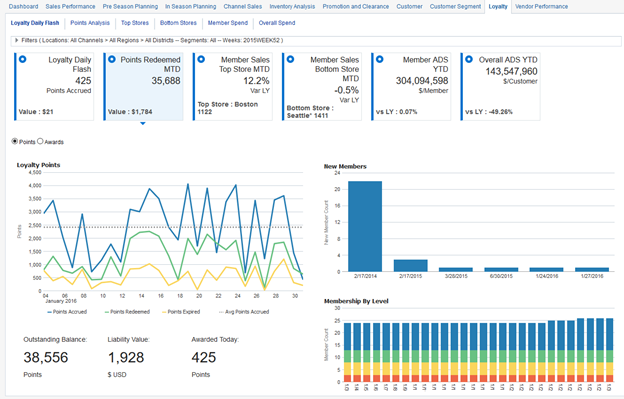
The Loyalty tab contains reports focused on the loyalty programs and accounts defined in a retailer's CRM system, such as Customer Engagement, along with the transactions relating to points and awards for the programs. Analyzing the activity of customers in a loyalty program can be a major driver of sales and customer retention and is a useful tool for marketers when planning promotions and advertising.
This report shows a snapshot of current loyalty program status, including point balances, issue/redemption rates over time, and customer counts by program level.
This report gives a detailed breakdown of loyalty point usage over time by program level, such as points redeemed, issued, or expired within a period. Understanding how your loyalty program is being used, which levels are the most active, and how many points are expiring is critical to a successful and profitable program.
This report looks at the top stores based on loyalty member activity year over year. Since loyalty programs are often focused in specific regions, it is useful to know which locations are most frequented by loyalty members and how much they are buying.
This report looks at the bottom stores based on loyalty member activity year over year. Store which are participating in the loyalty program but not generating any loyalty sales may require corrective action by the retailer.
This report shows sales performance for loyalty members using an RFM (recency, frequency and monetary spend) style analysis, in order to understand how much and how often your loyalty members are shopping at your stores.
This report analyzes spending patterns of your known customers and loyalty members as compared to the overall sales trends, in order to understand if each of these groups are generating more or less sales, what their average spend and shopping frequency is, and what proportion of sales can be attributed to each group.
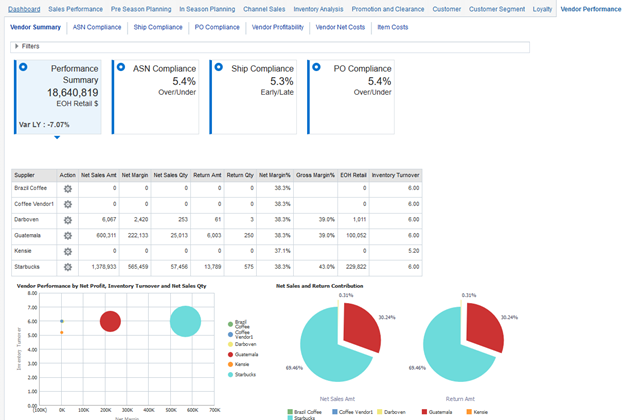
The Vendor Performance tab shows a supplier-centric view of sales and inventory, as well as several measures of supplier compliance such as ASN and PO timeliness. Monitoring supplier performance can be an early indicator of problems with specific vendors, as well as a tool for negotiating future deals.
This report shows performance of sales and inventory by supplier. When working with many suppliers, it is useful to know the inventory levels and sales margins associated with each one.
This report shows how well a supplier has met or deviated from their ASNs, depending on how this information is tracked by the merchandising system.
RI includes several catalog objects intended to support integration with Retail Home. These objects can be located in the Shared Folders > Retail Home folder in the catalog.
The sample objects include:
Dashboard Tiles – these analyses are provided to demonstrate the two-metric BI tile format used in Retail Home
LOVs – these pre-defined filters are provided to enable Retail Home filtering on the department, class, and subclass levels of an RI-based metric tile
Sample Dashboard – this RI dashboard provides an example of how the two-metric analyses can be tested in RI before they are linked with a tile in Retail Home
For more information on creating RI analyses for Retail Home, refer to the Custom Tile State Reports Configuration chapter of the Oracle Retail Home Administration Guide.