| Agile Product Lifecycle Management Agile Plug-in for Enterprise Manager User Guide Release 9.3.5 E61174-01 |
|

 Previous |
 Next |
| Agile Product Lifecycle Management Agile Plug-in for Enterprise Manager User Guide Release 9.3.5 E61174-01 |
|
Previous |
Next |
Reports are generated from the metric information that you collect and store in the Oracle Enterprise Manager repository. Reports display detailed information as per pre-defined criteria, help monitor and analyze performance, and track usage. You can view Reports at the end of the process.
You can generate the following categories of reports:
Agile Chart Reports
Deployment and Config
Enterprise Manager Setup
Monitoring
Security
Storage
To generate reports:
Click the Oracle Enterprise Manager Home page.
Select the host name.
Click Targets.
Click the Reports button. The Report Definition page appears.
Select Agile Chart Reports > Interesting Agile Data > User Usage Report and specify a target for Report.
Select a Target.
In the Search and Select Targets page, enter Agile PLM in the Target type field.
Click Go.
Select the Target and click Continue. A graphic display of the Report appears. The report displays a graph of
Users: Logon Users
Sessions: Logon Sessions
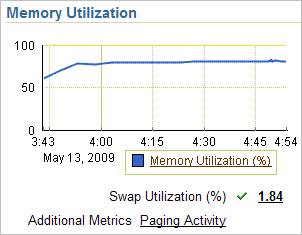
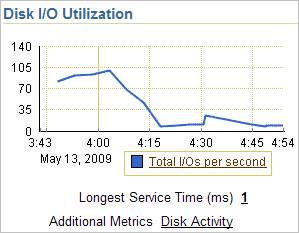
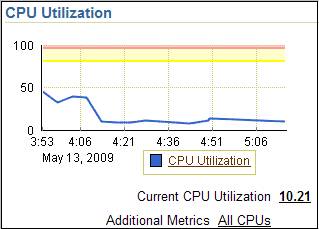
With Tomcat and Enterprise Manager, monitoring can be either real-time or historical. The administrators can view these reports to monitor the health of targets. With each Tomcat installation, you must configure the Agile monitoring probe that provides metric details to the Tomcat hub. When you install EM agent, the agent receives alerts and messages from the EM queue and stores the statistics in the EM repository.
You have three options:
24 hours - provides the statistics for the last 24 hours.
Seven days - provides the statistics for a week.
31 days - provides the statistics for the last 31 days.
Enterprise Manager provides a powerful reporting framework called Information Publisher. Given below are a few reports run by Agile.
Agile Concurrent User Usage Report is based on this framework and shows the concurrent user numbers by day.