| Oracle® Product Lifecycle Analytics User Guide Release 3.5 E70275-01 |
|

 Previous |
| Project Revenue | Project Cost | |
|---|---|---|
| Subject Area
The presentation area within OPLA that supports this analysis. |
Project Summary | Project Summary |
| Matching Attribute
The required common field values between OPLA and the .csv template that allows data to "blend in" for analysis. |
Project Number | Project Number |
| Supported Template Measures
The measures within the Template that can be analyzed by Template dimensions and other qualifying dimensions. |
Project Forecast Revenue
Project Actual Revenue |
Project Planned Total Cost
Project Actual Total Cost |
| Supported Template Dimensions
The dimensions within the Template that are used to analyze Template measures only. |
Reference # | Reference # |
| Other Qualifying Dimensions
The dimensions within the subject area, that along with Template measures, can be used for analysis. |
Project and Project attributes
Product line Region Division Project Type |
Project and Project attributes
Product line Region Division Project Type |
| Time Dimensions
The time dimensions used for analysis with Template measures. |
External data dimensions only | External data dimensions only |
| Product Revenue | Product Demand | |
|---|---|---|
| Subject Area
The presentation area within OPLA that supports this analysis. |
Product Performance | Product Performance |
| Matching Attribute
The required common field values between OPLA and the .csv template that allows data to "blend in" for analysis. |
Item | Item |
| Supported Template Measures
The measures within the Template that can be analyzed by Template dimensions and other qualifying dimensions. |
Product Planned Revenue
Product Actual Revenue |
Product Planned Demand
Product Actual Demand |
| Supported Template Dimensions
The dimensions within the Template that are used to analyze Template measures only. |
Customer
Reference # |
Customer
Supplier Reference # |
| Other Qualifying Dimensions
The dimensions within the subject area, that along with Template measures, can be used for analysis. |
Part Category
Part Type Commodity Part Family Item Product lines Item Site Size |
Part Category
Part Type Commodity Part Family Item Product lines Item Site Size |
| Time Dimensions
The time dimensions used for analysis with Template measures. |
External data dimensions only | External data dimensions only |
| Units Shipped or Units Received | Product Inventory | |
|---|---|---|
| Subject Area
The presentation area within OPLA that supports this analysis. |
Product Performance | Product Performance |
| Matching Attribute
The required common field values between OPLA and the .csv template that allows data to "blend in" for analysis. |
Item | Item |
| Supported Template Measures
The measures within the Template that can be analyzed by Template dimensions and other qualifying dimensions. |
Product Planned Units Shipped
Product Actual Units Shipped Product Planned Units Received Product Actual Units Received |
Product Planned Inventory
Product Actual Inventory Product Planned Inventory Value Product Actual Inventory Value |
| Supported Template Dimensions
The dimensions within the Template that are used to analyze Template measures only. Note The Customer and Supplier numbers must match the Customer and Supplier number that was inputted in Agile. |
Customer (not available for Unit Received)
Supplier Reference # |
Supplier
Reference # |
| Other Qualifying Dimensions
The dimensions within the subject area, that along with Template measures, can be used for analysis. |
Part Category
Part Type Commodity Part Family Item Product lines Item Site Size |
Part Category
Part Type Commodity Part Family Item Product lines Item Site Size |
| Time Dimensions
The time dimensions used for analysis with Template measures. |
External date dimensions only | External date dimensions only |
The following tables provide the combination of measures and Product Change analysis area:
| Subject Area >
Measure |
Change Orders | Manufacturer Orders | Change Requests | Stop Ships | Deviations |
| Volume
(New, Open, Closed) |
X | X | X | X | X |
| Ago, To date | X | X | X | X | X |
| Cycle Time | X | X | X | X | X |
| Workflow Cycle Time | X | X | X | X | X |
| Sign-off Cycle Time | X | X | X | X | X |
| Aging | X | X | X | X | X |
| Expected Closed, Overdue | |||||
| Redlines | X | X | |||
| First Time Right (FTR) | X | X | X | X | X |
|
Note: The X mark in the matrix indicates the availability of the measure in the subject area. |
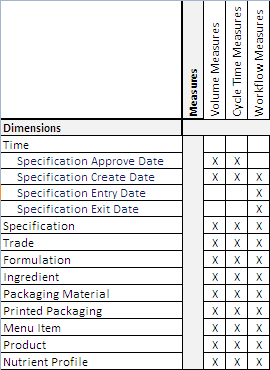
The following table provides the combination of measures and Product Quality analysis area:
| Subject Areas >
Measures |
Customer Complaints | NCR | CAPA | Audit |
| Volume ( New, Open, Closed) | X | X | X | X |
| Ago, To date | ||||
| Cycle Time | X | X | X | X |
| Workflow Cycle Time | X | X | X | X |
| Sign off Cycle Time | ||||
| Aging | X | X | X | X |
| Expected Closed, Overdue | X | X | ||
| Redlines | ||||
| First Time Right (FTR) |
The following table provides the combination of measures and Product Risk analysis area:
| Subject Areas >
Measures |
Product Performance | Item | Manufacturer Part | Item - AML | Item Changes | Item Quality |
| Volume | X | X | X | X | X | X |
| Affected Item Volume | X | X | X | |||
| Item Risk | X | X | ||||
| Mfr Part Risk | X | |||||
| AML Risk | X | |||||
| AML Split Measures | X | |||||
| Mean Time | X | |||||
| Age | X | X |
| Dimensions >Measures | Item | Item.Lifecycle | Mfr | Mfr part | Item-Mfr Part junctionExample: Preferred Status | Time |
|---|---|---|---|---|---|---|
| Item Measures | ||||||
| Items (Released) | Count of the released items in the system. | Count of the lifecycles that the released items have traversed. | Count of the released items associated with the manufacturer. The association is by an ECO or MCO. | Count of the released items associated with the manufacturer parts. | Count of the released items associated with a preference status. | Count of the items released over time. When you combine Time dimension with a dimension in a different group such as Mfr.Part, it gives the number of item and revisions associated with this Mfr.Part. |
| Note For all Dimensions, except Time, the revision data (Latest revisions or all revisions) about an item in the result is based on the recommended filters and dimensions used. | ||||||
| # Items with One Mfr only | Number of items associated with a single Manufacturer. When you combine with Product Line, it gives the number of Items within a Product Line that have only one Manufacturer. | Lifecycle of Items that have one Mfr only | Mfr associated with the Item | Mfr Part associated with Item | Preferred status of the Mfr Part associated with the Item | |
| # Items with One Mfr Part Only (Released Items) | Number of Items associated with a single Manufacturer Part. When combined with Product line, it gives number of Items within a Product line that has only one Manufacturer Part. | Lifecycle of Items that have one Manufacturer Part only | Manufacturer associated with the Item | Manufacturer Part associated with Item | Preferred status of the Manufacturer Part associated with the Item | |
| Mfr Part Measures | ||||||
| # Mfr. Parts | Number of Mfr. Part associated with the Items belonging to a Product Line or any other Item dimension.
Example: How many Mfr.parts are associated with the Product Line Leo? |
Number of Mfr Part associated with each Lifecycle transition of Item.
This includes the current and past data. |
Number of Mfr parts by Mfr dimension. This number considers only the Mfr.Parts associated to an Item.
Example: How many Mfr.Parts are manufactured by a specific manufacturer? |
Number of Mfr.Parts by Mfr.Part dimension. Mfr.Part that is not associated with item is not considered.
Example: How many Mfr.Parts are from Part family, 'Cable'? |
Number of Mfr Part by Part preference status.
Example: How many Mfr Parts are preferred? |
|
| # Mfr. Parts in Released Item | Number of Mfr. Part associated with the Released Items belonging to a Product Line or any other Item dimension.
Example: How many Mfr.parts are associated with the Product Line Leo? |
Number of Mfr Part associated with each lifecycle transition of Released Item. This includes the current and past data. | Number of Mfr parts by Mfr dimension. This count considers only the Mfr.Parts associated with a Released Item.
Example: How many Mfr.Parts are manufactured by a specific manufacturer? |
Number of Mfr.Parts by Mfr.Part dimension. This count considers only the Mfr.Parts associated with a Released Item.
Example: How many Mfr.Parts are from Part family, 'Cable'? |
Number of Mfr Part by Part preference status. This count considers only the Mfr.Parts associated with a Released Item.
Example: How many Mfr Parts are preferred? |
|
| # Mfr. parts on more than one Item | Item or Product Line to which Mfr.Parts that are on more than one Item is associated with. | |||||
| Average Mfr. Parts per Released Item | Average number of Mfr. Parts per released revision of the Item by a specific dimension. Example : Product Line | Average number of Mfr Parts per Released Item by Lifecycle. | Do not use | Do not use | Do not use | |
| Mfr.Measures | ||||||
| # Mfr | Number of Manufacturers associated with the Items belonging to a Product line. | Number of Manufacturers associated with each Lifecycle transitions of one or more items. The revision data (Latest revisions or all revisions) about an item in the result is based on the recommended filters and dimensions used. | Number of Mfr by Mfr dimension.
Manufacturers that are not associated with Mfr.Parts or Manufacturers that are not associated with Mfr.Parts that have association with item are not included. |
Number of Mfr by Mfr.Part dimension.
Example: How many Mfr does Mfr Part family have? |
Example: How many Manufacturers are preferred? | |
| Item Mfr Part Measures | ||||||
| AML Split by Item Create Date | AML split of Mfr Parts associated with Items by Product line | AML split associated with each Lifecycle. | AML split by Mfr | AML split by Mfr.Part | AML split by preference status | |
| Defined Measures | ||||||
| Spend by Mfr by Item Create date | Spend on Mfr Parts associated with Items by Product line | What is spend by Item lifecycle? | What is the spend by Mfr as on date? | Do not use | Do not use | |
| Note This measure requires Defined Fields Cost 1 and Quantity 1 to be configured to P2 or P3 attribute. The spent amount is calculated as Cost 1 x Quantity 1. This measure is not revision-specific. Use the 'Items with latest revision along with this measure. | ||||||
| Spend by Mfr by Item Effective date | ||||||
| Dimensions > Measures v | Item | Item.Lifecyle |
|---|---|---|
| Mean Time Between Cycles (MTBC) | Recommend not to use with Lifecycle since this is based on Item age. | |
| Mean Time Between Design Failures (MTDF) | Recommend not to use with Lifecycle since this is based on Item age. |
For Mean Time between Cycles, use the recommended filter 1 for latest revision. When using recommended filter 2 for all revisions, use Item-age only in all cases except when exposing lifecycle as a dimension. If there are two repeating lifecycles on an Item, the duration of each lifecycle is averaged (not summed) thereby providing an inaccurate Mean Time Between Cycles, Mean Time Between Design Failures for Lifecycle.
The following table provides the combination of measures and subject areas in Product Portfolio analysis area:
| Subject Areas >
Measures v |
PLM-PPM Phase - Gate | PLM-PPM Portfolio Summary | PLM-PPM Program Summary | PLM-PPM Project Detail | PLM-PPM Project Summary |
| Portfolio | X | ||||
| Cost | X | X | X | X | X |
| Phase | X | X | |||
| Gate | X | X | |||
| Program | X | ||||
| Project | X | ||||
| Activities | X | ||||
| Baseline | X | ||||
| Snapshot | X | ||||
| Revenue Forecast | X | ||||
| Defined | X |
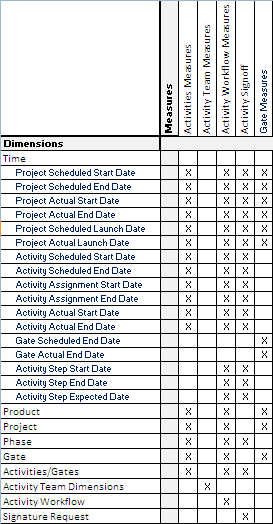
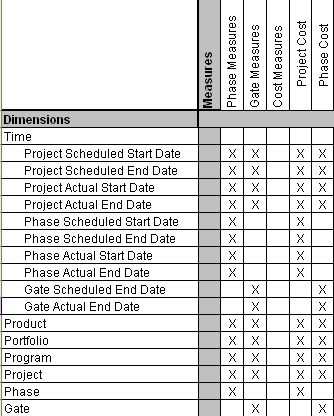
The following table provides the combination of measures and dimensions for the Project Summary Subject Area:
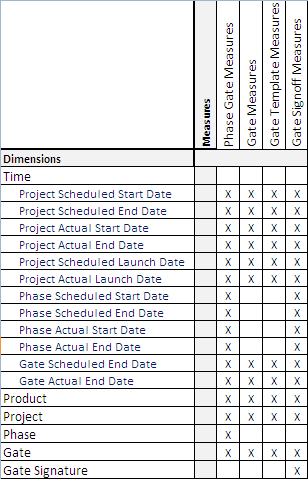
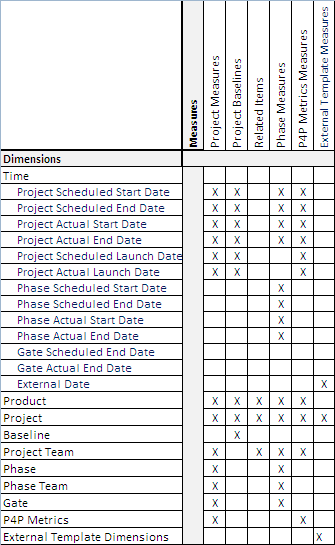
The following table provides the combination of measures and dimensions for the Phase-Gate Subject Area:
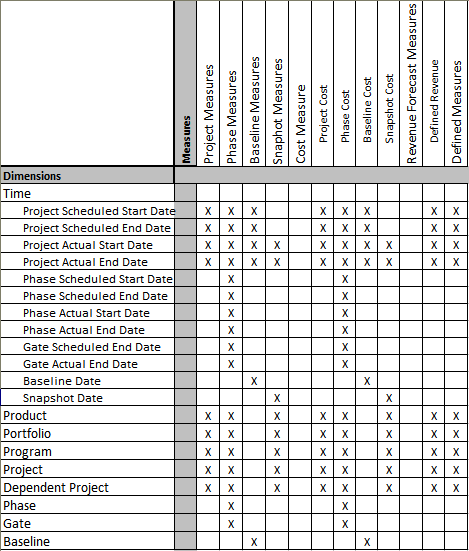
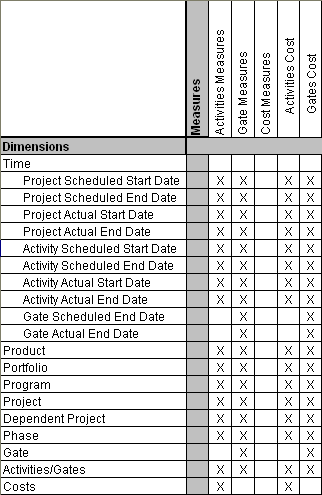
The following table provides the combination of measures and dimensions for the Project Detail Subject Area:
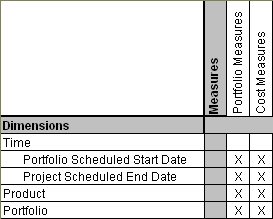
The following table provides the combination of measures and dimensions for the Portfolio Summary Subject Area:
The following table provides the combination of measures and dimensions for the Program Summary Subject Area:
|
WARNING: The # PROJECTS YTD measure only works with the Fiscal Year dimension. The # PROJECTS YTD measure does not work with any other Time dimension. In addition, the # PROJECTS YTD measure does not work with Fiscal Quarter, Fiscal Month, Fiscal Week, and Day. |
|
Important: The following measures work only with Project dimensions (and not Phase dimensions): Avg # of Functional Areas on Phase Avg # of Team Members on Phase Avg # of Gate Keepers on Phase |