You can generate the project finance report using the filter and output options. You must first download the template before you can view the output in Microsoft Excel.
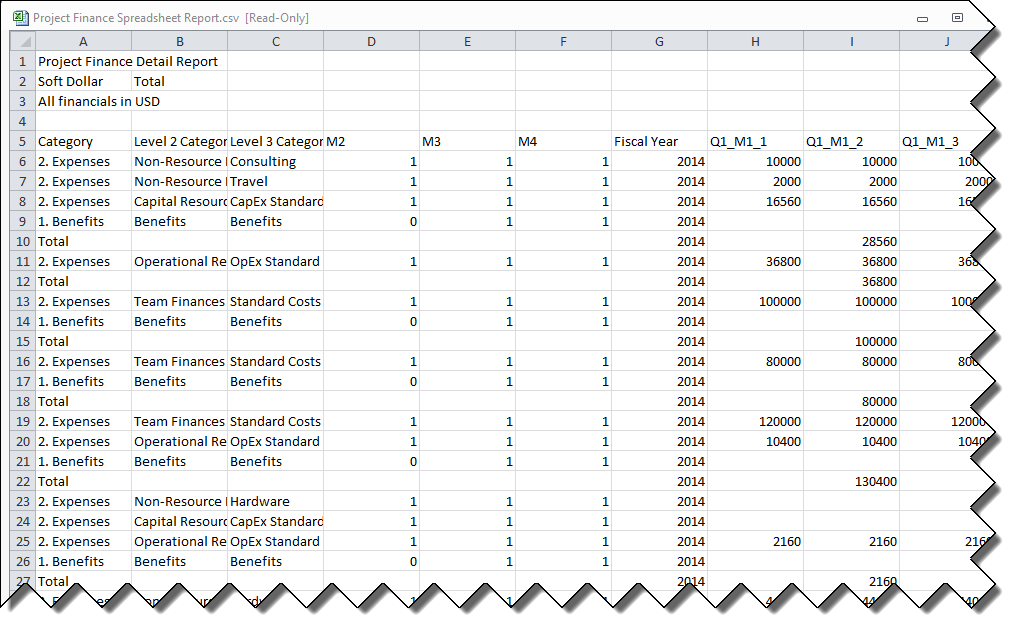
This report is designed to export the contribution each element line item makes to the finance category, group and total levels after applying the relevant multiplication factors. To identify the month, the report uses Q to represent the quarter and M to represent the month, for example if the fiscal year starts in January, January would be displayed as Q1_M1 and February as Q1_M2. April would be Q2_M1 as it is the first month of the second quarter. There are four columns for each month representing the four different levels of the template as follows:
- Qx_My_1 maps to the monthly value for the total level
- Qx_My_2 maps to the monthly value for group level
- Qx_My_3 maps to the monthly value for category level
- Qx_My_4 maps to the monthly value for element level
The columns M2, M3 and M4 map to the multiplication factors for group (M2), category (M3) and element (M4).The data on this report is tailored for manipulation into a pivot table.
Filter Parameters
You can filter on pull down status, initiative, project basics, classification fields, organization hierarchy, and finances.
Output Parameters
You can select the report format, the maximum rows per report, and compress output. The report output is in CSV format.
Sample Report
See Also
Legal Notices
Copyright © 2000, 2016,
Oracle and/or its affiliates. All rights reserved.
Last Published Tuesday, June 21, 2016