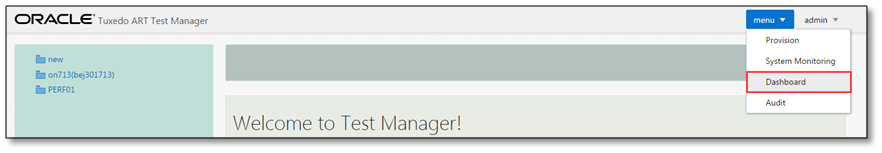
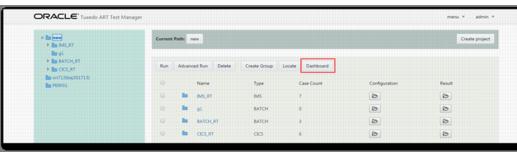
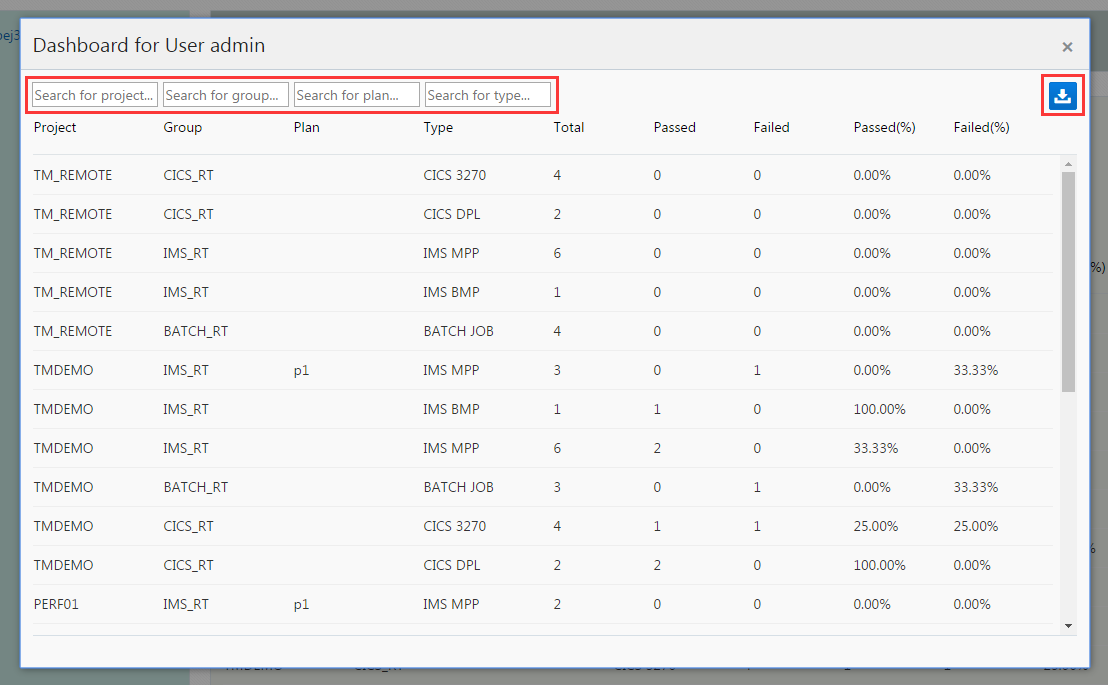
Dashboard ART Test Manager dashboards provide statistical information about test cases and test results. The dashboards provide context-specific information on test execution, including total available number of test cases by type and passed/failed statistics in absolute numbers and by percentages. There are three ways to access the Dashboard functionality in ART Test Manager: • At login time users are presented with a dashboard for all of their projects • Dashboard view can be entered using the drop down menu in upper right corner • Each project/group/test plan provides a Dashboard button • Dashboard can be exported to csv file When presented at login time or accessed from the drop down menu by a regular user, dashboard includes all projects created by the user. When Dashboard button is clicked inside a project/group/plan, the dashboard presents the information within the current scope (i.e., the current project/group/plan.) Dashboard view presents the following information: • Project: only shown in user context. • Group: only shown in user and project context. • Plan: only shown in user, project and group context. When “Plan” column is blank, the statistics are for cases are part of the test group but don’t belong to any test plan under the group. • Type: case type, including IMS MPP, IMS BMP, CICS 3270, CICS DPL, BATCH JOB. • Total: number of available test cases • Passed/Failed: number of passed/failed cases. • Passed(%)/Failed(%): percentage of passed/failed cases relative to the total number Dashboard filtering is available by using the Search field to enter any combination of project name, group, plan, and/or type. You can export dashboard to the csv file by clicking the blue button on the upper right corner.
Copyright © 1994, 2017, Oracle and/or its affiliates. All rights reserved.