1 Getting Started
This chapter introduces the role of Oracle Real User Experience Insight (RUEI). In particular, it describes how RUEI monitors data traffic, its operational requirements, and the available deployment options. Information is also provided about how you can increase the amount of information available within the RUEI Reporter database.
1.1 What is RUEI?
The usage of web applications and services continues to grow. This includes not only the use of the Internet as a marketing channel, but also Extranet-based supply chain and back-office integration, and Intranet deployment of internal applications. Increasingly, it also includes the utilization of web services which implement clearly defined business functions. Applications can be accessed from mobile devices and there are many cloud based deployment options including on-premises, SaaS and hybrid. RUEI is designed for measuring, analyzing, and improving the availability and performance of all of these deployment scenarios. To achieve this, RUEI is capable of performing data collection from network traffic, ADF servers and/or data collection using Javascript browser instrumentation.
To view a visual demonstration on how you can use RUEI, access the following URL and click Begin Video:
https://apex.oracle.com/pls/apex/f?p=44785:24:0::NO:24:P24_CONTENT_ID,P24_PREV_PAGE:5783,1
1.1.1 Data Collection
Figure 1-1 shows the Network Data Collector (available in previous RUEI releases) and Figure 1-2 shows the Tag Data Collector which is an option that allows you to collect data using Javascript and does not require network monitoring.
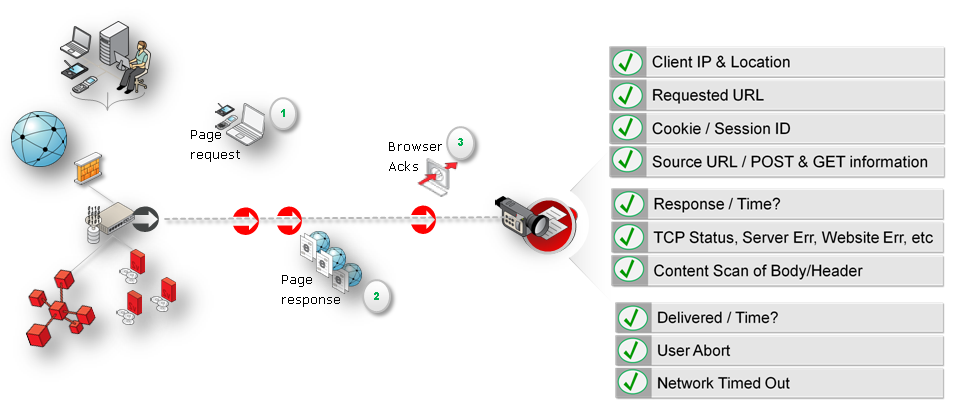
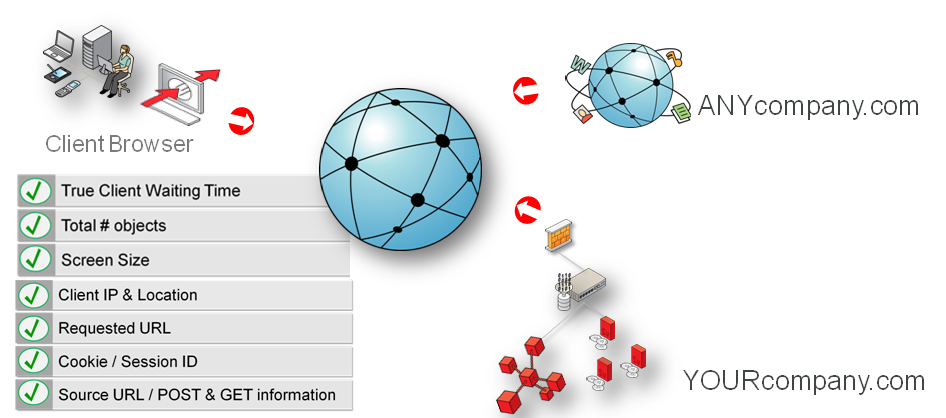
Table 1-1 outlines the different data collections that are available with RUEI.
Table 1-1 Data Collection Methods
| Network | Tag | |
|---|---|---|
|
Overview |
This option collects data that passes through the network and was the default option in previous releases and requires either a local or remote collector. It monitors all network traffic in promiscuous mode. |
This option, also called tag based monitoring, collects data by monitoring the request and processing of a specific web URL (the tag) which is inserted into all pages and requires either a local or remote collector. It monitors only the traffic related to a local IP address. |
|
Applications |
You must define an application. See Identifying and Reporting Web Pages chapter of User's Guide. |
You must define an onload object and use the generated javascript in your application. See Identifying and Reporting Web Pages chapter of User's Guide. |
|
Suites |
You must define a Suite. See Working With Suites and Web Services chapter of User's Guide. |
Only WebCenter Sites can be monitored using tag-based data collection. See Working With Suites and Web Services chapter of User's Guide. |
|
Further Information |
Section 2.1.1, "Planning the Software Installation" Section 1.2, "Security for Network Data Collection" Section 1.3, "Connection Options for Network Data Collection" |
|
|
ADF Monitoring |
Various data collection options are available for monitoring ADF based applications, including the ADF monitoring Service. This service collects data (for example, user names) from the application server for ADF based applications, enhancing the data from network data collection. See Chapter 4, "Configuring RUEI for ADF Monitoring" for more information on these options. |
|
The options are further described in Section 2.1.1, "Planning the Software Installation".
The network data collection method is based on Network Protocol Analysis (NPA) technology. This method is 100% non-intrusive. Hence, it does not place any load on a web server, or require installing software agents that will impact performance. In addition, it does not require any change to the current application or infrastructure. When a new application release is deployed, or when an additional web server is added, there is no or very little change required to RUEI's monitoring environment. Typically, RUEI is installed before the web servers, behind a firewall in the DMZ (as shown in Figure 1-3).
Figure 1-3 How RUEI Collects Data with a Network Data Collector
Description of ''Figure 1-3 How RUEI Collects Data with a Network Data Collector''
When an object is requested by a visitor, RUEI sees the request and measures the time the web server requires to present the visitor with the requested object. At this point, RUEI knows who requested the page (the client IP), which object was requested, and from which server the object was requested (server IP).
When the web server responds and sends the requested object to the visitor, RUEI sees that response. At this point, RUEI can see whether there is a response from the server, whether this response is correct, how much time the web server required to generate the requested object, and the size of the object. In addition, RUEI can also see whether the object was completely received by the visitor, or if the visitor aborted the download (that is, proof of delivery). Hence, RUEI can determine the time taken for the object to traverse the Internet to the visitor, and calculate the Internet throughput between the visitor and the server (that is, the connection speed of the visitor).
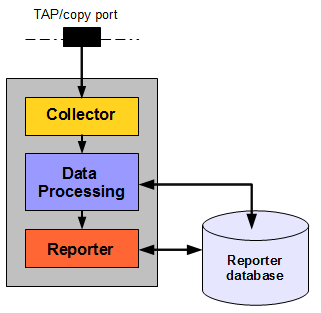
1.1.2 Product Architecture
RUEI is based on a three-layer product architecture, as shown in Figure 1-4.
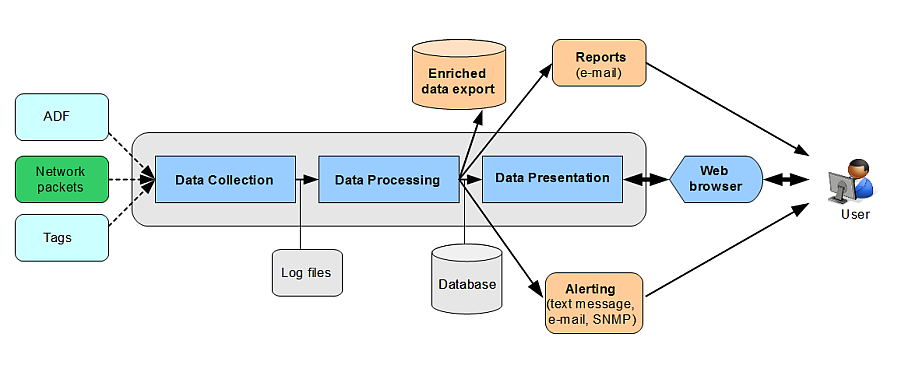
The monitored data packets are processed by the layers shown in Table 1-2.
Table 1-2 Product Architecture Layers
| Layer | Description |
|---|---|
|
Data Collection |
This layer is responsible for acquiring raw data and delivering it to the Data Processor layer. This data can be collected from multiple sources. The available attachment options are described later in this section. |
|
Data Processing |
This layer converts the raw data into the OLAP data sets. These comprise the multi-dimensional data structure that is viewable with the Data Browser. |
|
Data Presentation (Reporter) |
This layer is RUEI's analysis and reporting environment. This is a web-based information portal that can be accessed from any supported browser. |
As will be explained in a later section, each of these layers can be deployed on the same system, or for scalability issues, on separate systems.
1.2 Security for Network Data Collection
To read HTTP(S) data streams, a proprietary software module reassembles TCP/IP packet streams. Because the network data collectors do not have an assigned IP number, and the software using these data collectors does not have a functional IP stack, RUEI is not able to respond to incoming traffic received on the data collectors. This makes RUEI "invisible" to the monitored networks, and completely secure.
Note:
Because of the non-intrusive way in which RUEI collects data, it is not possible for it to request retransmission in the event of an error on the measurement port.Data collection can be configured to log encrypted data. To facilitate this, a copy of the web server's private SSL keys needs to be set up in the data collector. In addition, RUEI can be configured to omit logging of sensitive data in the arguments of POST requests of forms or content; so called data masking (or blinding).
1.3 Connection Options for Network Data Collection
RUEI supports the use of both copy portsFoot 1 and TAPsFoot 2 for monitoring network traffic (10/100 Mbps and 1/10 Gbps Ethernet connections are supported). Copy ports and TAPs are available for copper or fibre-based network infrastructures. While both devices allow non-intrusive monitoring of network traffic, there are differences between these two connection options. These are highlighted in the rest of this section.
Monitoring SSL and Forms Traffic
Be aware that SSL and Oracle Forms traffic are particularly sensitive to disruptions in the TCP packet stream. This is because they require state information to be maintained for the duration of the connection, and any lost packets can cause that information to be lost, preventing RUEI from accurately monitoring and reporting the connection.
Therefore, you should ensure that each Collector is connected to a reliable network device, such as a TAP. In addition, it is strongly recommended that you regular review the information available through the Collector Statistics window (select System, then Status, and then Collector status) to verify the integrity of the TCP packet stream. Particular attention should be paid to the reported TCP and SSL connection errors. Also, note that the Collector software needs direct access to the physical network interface and that a configuration where multiple servers share a single physical network interface, for example certain blade server types, may not work reliably. Contact your hardware vendor if you have any doubt about your configuration.
1.3.1 Copy Ports
A copy port is a switch that starts to build up a Layer 2 forwarding table on the basis of the source MAC address of the different packets that the switch receives. After this forwarding table is built, the switch forward traffic that is destined for a MAC address directly to the corresponding port.
For example, after the web server MAC in Figure 1-5 is learned, unicast traffic from the browser to the web server is only forwarded to the web server port. Therefore, the Collector does not see this traffic.
Figure 1-5 Network Connection Using a Copy Port
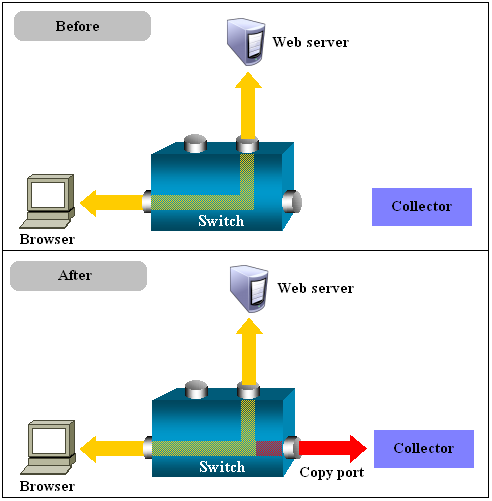
Description of ''Figure 1-5 Network Connection Using a Copy Port''
In the configuration shown in the lower part of Figure 1-5, the Collector is attached to a port that is configured to receive a copy of every packet that the browser sends and receives. This port is called a copy port. Copy ports can copy traffic from any or all data ports to a single unused port and prevents bi-directional traffic on the port to protect against backflow or traffic into the network.
Be aware that activating a copy port on a switch can have a performance impact. Typically, copy ports support a wide range of configuration options, and for further information about these options you should consult your switch documentation or contact the vendor.
1.3.2 TAPs
TAPs can be placed between any two network devices (such as routers and firewalls). Any monitoring device connected to a TAP receives the same traffic as if it were in-line, including all errors. This is achieved through the TAP duplicating all traffic on the link, and forwarding it to the monitoring port(s). The example shown in Figure 1-6 illustrates a typical TAP deployment for one Collector.
Figure 1-6 Network Monitoring Using a TAP
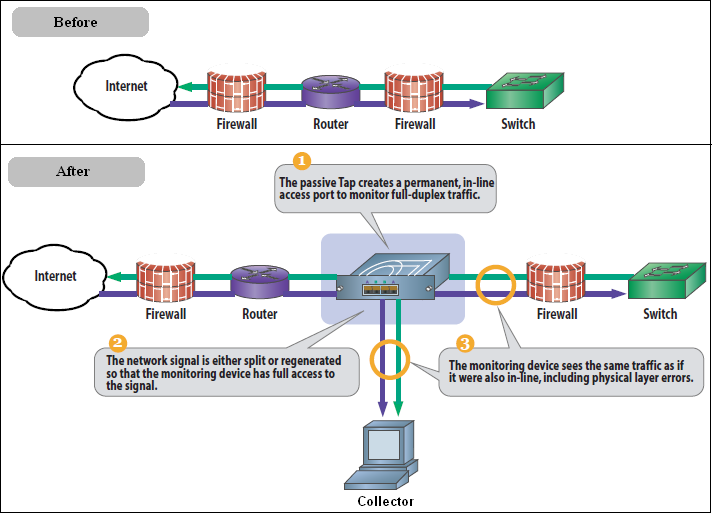
Description of ''Figure 1-6 Network Monitoring Using a TAP''
Unlike copy ports, in the event of power failure, TAPs continue to allow data to flow between network devices. In addition, copy ports are prone to packet loss when under load. TAP devices are available for copper or fibre-based infrastructures. Moreover, they can be easily deployed when and where required, but without reconfiguration of switches or engineers needing to re-cable a network link. For these reasons, the use of TAPs is strongly recommended over that of copy ports.
Broadly speaking, there are three types of TAPs: network, regeneration, and aggregation TAPs. RUEI supports the use of network and regeneration TAPs. Aggregation taps are only supported if they maintain the ordering of packets in the packet stream. Note that reporting accuracy can be impacted when using aggregation taps if the monitor port gets saturated, resulting in packet loss and inaccurate timing information. In addition, be aware that when capturing data with a network TAP, the use of cascaded TAP configurations is not supported.
It is possible in RUEI to monitor and process data from multiple networks, by either deploying a tap on each network segment and connecting those to a central collector, or by deploying multiple collectors, one on each monitored segment (see Section 1.6, "Scaling Scenarios").
1.4 Installation Options
A RUEI system can be installed to be one of three things: a Reporter, a Collector, or a Processing Engine. Each of these installation options is reviewed in the following sections.
A Reporter system processes the data gathered by the Collectors attached to it. After processing, this data is stored in an Oracle database, referred to as the Reporter database. System users can review the collected data through a browser-based interface.
In order for RUEI to be able to accurately monitor network traffic, and report its results, it needs certain information about your network and application infrastructure. This includes how pages, service function calls, and end users will be identified, the scope of monitoring in your network environment, the monitoring of specific KPIs and SLAs, and the roles and permissions assigned to system users. This information is held in a separate Configuration database.
A Collector gathers data and submits the data to a Reporter. Multiple Collectors can be attached to the same Reporter. Note that a direct connection is required between the Collector systems and the Reporter system. A collector can be either network based or tag based as described in Section 2.1.1, "Planning the Software Installation".
Note that each Reporter installation also contains a local Collector instance. The Reporter can be configured to just process information gathered by this local Collector (this is a single-server configuration), or to receive information from additional Collectors. Note that the local Collector instance on the Reporter system can also be disabled if not required.
A Processing Engine is an optional component in a RUEI deployment that undertakes the data processing role normally performed by the Reporter. Essentially, it involves offloading the overhead of processing the data gathered by the Collectors to one or more separate systems.
Note:
Installing a separate Processing Engine might degrade performance of a RUEI system. Contact Oracle Support for advice before installing a Processing Engine.Each Processing Engine has its own (local) database, in which intermediate network traffic monitoring results are stored. Once processed, this data is used to update the Reporter's database. All configuration information is also maintained within this database. Note that each Processing Engine system requires a direct connection between its associated Collector systems and the Reporter system.
1.5 Local and Remote Database Installations
As explained earlier, the data available via the Reporter system is stored in an Oracle database, called the Reporter database. The information required by RUEI in order to correctly monitor and report on your web infrastructure, such as information about monitored applications and system users, is held in a separate Configuration part of the database. The database can reside locally on the Reporter system, or on a remote database server (such as a database cluster).
The use of a remote database server provides a number of potential advantages over a locally installed database. In particular, it offers easier integration with existing security and back-up policies, as well as improved performance through the use of dedicated servers.
Currently, RUEI supports Oracle 11g and 12c Release 1 database installations. Note that the Oracle 10g (or older) database is not supported.
1.6 Scaling Scenarios
This section highlights the different deployment scenarios available to you. The selection of the most appropriate deployment scenario is primarily determined by the level of monitored network traffic, your reporting requirements, and the hardware specifications of your deployment systems.
This is the simplest deployment, and is suitable for monitoring web environments with low to medium levels of traffic. An example is shown in Figure 1-7.
In this deployment, a single system servers as both Collector and Reporter. As explained in the previous section, the Reporter database can reside locally on the Reporter system or on a remote database server.
The use of multiple servers may be considered when there is a need to monitor very high levels of traffic. In addition, this deployment also provides the possibility of enhanced security. For example, by placing the Collector(s) outside the office network, while placing the Reporter system within the network. Figure 1-8 shows an example of a multiple-Collector deployment.
Figure 1-8 Multiple-Collector Deployment
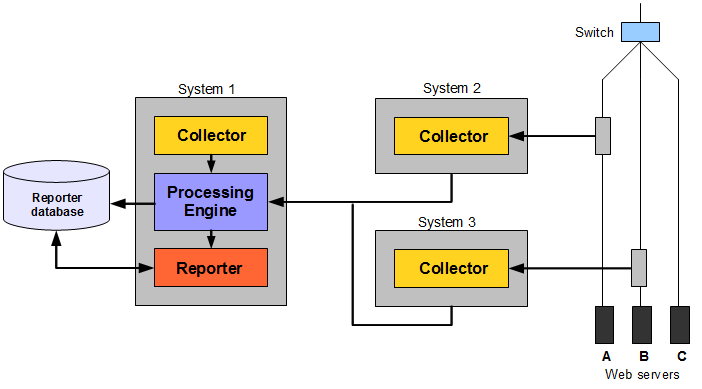
Description of ''Figure 1-8 Multiple-Collector Deployment''
This features a deployment in which both data lines are monitored in the same reporting environment. Note that this deployment assumes that the traffic on each line is mutually exclusive. It also illustrates a deployment used for security reasons. While the traffic from web servers A and B are monitored and reported, the traffic from web server C is not. This is also the reason why the Collectors are not placed above the switch. Note that the Collector instance on the Reporter system (system 1) is disabled.
For security reasons, it is recommended that access to the Reporter system is restricted to trusted IP ranges. Similarly, you may want to locate the Reporter system inside the internal network to maximize its security. The Collector's data gathering ports should be within the DMZ.
The application and infrastructure configuration information held in the database is maintained by the Reporter based on information provided by system users through its browser-based interface. Each Collector uses this information to determine how the data it gathers should be reported.
As explained earlier, a Processing Engine serves to offload a significant amount of the processing normally performed by the Reporter to a separate system. It is strongly recommended that you consider the use of a Processing Engine within your deployment when CPU utilization on the Reporter system is reaching its upper limit. Figure 1-9 shows an example of a Processing Engine within a multiple-Collector deployment.
Note:
The use of Processing Engines is only supported for remote Collectors. A combined installation of a Processing Engine and a Collector on the same system is not supported.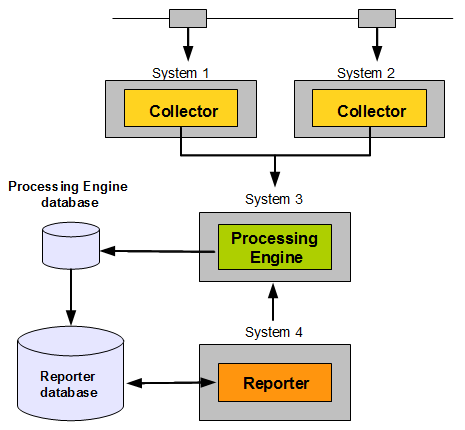
It is important to understand that the processing performed on the Reporter system includes not only the processing of the data gather by the attached Collectors, but also the use of the Enriched data export facility. This enables you to combine the data gathered by RUEI with other data sources. Be aware that, when enabled, this facility places a considerable additional load on the Reporter system. The Enriched data export facility is described in the Oracle Real User Experience Insight User's Guide.
Table 1-3 shows the location of data in a distributed environment where P is the processor node and R is the reporter node.
| Name | Display | Real time | 5 min | Hour | Day | Month |
|---|---|---|---|---|---|---|
|
ADF |
ADF Framework |
P |
P |
P |
P |
|
|
DYNADF |
ADF Framework Diagnostics |
P |
P |
|||
|
SERVICE |
All functions |
R |
R |
R |
||
|
PAGE |
All pages |
P |
R |
R |
R |
|
|
VISIT |
All sessions |
P |
P |
|||
|
SESSION_ACTIVITY |
All sessions |
P |
P |
|||
|
SESSION_APP |
All sessions |
P |
||||
|
BROWSER_EXCEPTION |
Browser exceptions |
P |
||||
|
EBS |
E-Business (Forms) |
P |
P |
P |
P |
|
|
DYNEBS |
E-Business (Forms) Diagnostics |
P |
P |
|||
|
RTERROR |
Error instance data |
P |
||||
|
FCDB |
FC Direct Banking |
P |
P |
P |
P |
|
|
DYNFCDB |
FC Direct Banking Diagnostics |
P |
P |
|||
|
FCUB |
FC Universal Banking |
P |
P |
P |
P |
|
|
DYNFCUB |
FC Universal Banking Diagnostics |
P |
P |
|||
|
FAILED_URL |
Failed URLs |
R |
||||
|
FAILED_SERVICE |
Failed functions |
R |
||||
|
FAILED_PAGE |
Failed pages |
R |
||||
|
DIAG_SERVICES |
Function diagnostics |
P |
||||
|
RTWSCALL |
Function instance data |
P |
||||
|
FUS |
Fusion Applications |
P |
P |
P |
P |
|
|
DYNFUS |
Fusion Applications Diagnostics |
P |
P |
|||
|
FUS_PROD_FAMILY |
Fusion product family |
P |
||||
|
FUS_PROD_USERS |
Fusion product users |
P |
||||
|
RTECID |
Hit ECID instance data |
R |
||||
|
JDE |
JD Edwards EnterpriseOne |
P |
P |
P |
P |
|
|
DYNJDE |
JD Edwards EnterpriseOne Diagnostics |
P |
P |
|||
|
KEY_PAGE |
Key pages |
P |
R |
R |
R |
|
|
KPI |
Monitored KPIs |
R |
R |
|||
|
RTPAGE |
Page instance data |
P |
||||
|
PSFT |
PeopleSoft |
P |
P |
P |
P |
|
|
DYNPSFT |
PeopleSoft Diagnostics |
P |
P |
|||
|
SLA |
Service levels |
R |
||||
|
SLM |
Service tests |
R |
R |
|||
|
SESSION |
Session Diagnostics |
P |
||||
|
SBL |
Siebel |
P |
P |
P |
P |
|
|
DYNSBL |
Siebel Diagnostics |
P |
P |
|||
|
SLOW_URL |
Slow URLs |
P |
P |
|||
|
SLOW_SERVICE |
Slow functions |
R |
||||
|
TCP_STATISTICS |
TCP statistics |
|||||
|
EURL |
URL diagnostics |
P |
P |
|||
|
RTURL |
URL instance data |
P |
||||
|
USER_FLOW_ACTIVITY |
User flow activity |
P |
P |
P |
||
|
USER_FLOW_COMPLETED |
User flow completion |
P |
P |
P |
||
|
RTTRANS |
User flow instance data |
P |
||||
|
WCS |
Webcenter |
P |
P |
P |
P |
|
|
DYNWCS |
Webcenter Diagnostics |
P |
P |
|||
|
WCSP |
Webcenter Portal |
P |
P |
P |
P |
|
|
DYNWCSP |
Webcenter Portal Diagnostics |
P |
P |
|||
|
WCSS |
Webcenter Sites |
P |
P |
P |
P |
|
|
DYNWCSS |
Webcenter Sites Diagnostics |
P |
P |
|||
|
WLP |
Weblogic Portal |
P |
P |
P |
P |
|
|
DYNWLP |
Weblogic Portal Diagnostics |
P |
P |
1.7 Server Requirements
The required minimum system specifications for the selected configuration (as explained in Section 1.4, "Installation Options") are described in the following sections.
It is recommended that you carefully consider the selection of network cards for your infrastructure. Depending on the connection option you selected in Section 1.3, "Connection Options for Network Data Collection", both copper and fibre-based network cards may be required. If necessary, consult both your network and systems management teams.
Network Cards Within Bonded Groups
Be aware that monitoring of network traffic using network cards that are part of a bonded group is not supported.
Note:
For more information about required and recommended system specifications, please contact Customer Support.1.7.1 Single-Server Requirements
Table 1-4 Single-Server System Minimum Requirements
| Element | Requirements |
|---|---|
|
CPU |
64-bit Intel or AMD dual-CPU, dual-core processor (> 2 G Hz) or equivalent. |
|
Memory |
16 GB. |
|
Disk space |
|
|
Network interfaces |
When using a network-TAP deviceFoot 4 , a minimum of three network interfaces are required:
|
|
GSM modem (optional) |
Optional support for a GSM modem to send text messages. The modem needs to be either GSM07.05 or GSM07.07 compatible. It can be connected through a serial or USB port. If USB is used, RUEI uses the first available port ( |
Footnote 1 To ensure acceptable performance of the RUEI installation, it is recommended to use high performance disk systems, with a minimum supported I/O rate of 70 MB/s. When monitoring high volumes of traffic, more powerful disk systems may be required. (Hardware) RAID-10 or equivalent storage configurations are strongly recommended.
Footnote 2 This may need to be increased if Enriched data exchange is enabled.
Footnote 3 The use of an NFS share for local data (that is, $RUEI_DATA and $RUEI_HOME) is not supported. Note that this restriction does not apply to $RUEI_DATA/processor/data and $RUEI_DATA/collector/wg/REPLAY.
Footnote 4 When capturing data with a network-TAP device, the use of cascaded TAP configurations is not supported.
1.7.2 Reporter Requirements
Table 1-5 Reporter System Minimum Requirements
| Element | Requirements |
|---|---|
|
CPU |
64-bit Intel or AMD dual-CPU, dual-core processor (> 2 G Hz) or equivalent. |
|
Memory |
16 GB. |
|
Disk space |
|
|
Network interfaces |
A minimum of one network interface is required. |
|
GSM modem (optional) |
Optional support for a GSM modem to send text messages. The modem needs to be either GSM07.05 or GSM07.07 compatible. It can be connected through a serial or USB port. If USB is used, RUEI uses the first available port (ttyUSB0). Alternative methods of sending text messages are available (http/e-mail). |
Footnote 1 To ensure acceptable performance of the RUEI installation, it is recommended to use high performance disk systems, with a minimum supported I/O rate of 70 MB/s. When monitoring high volumes of traffic, more powerful disk systems may be required. (Hardware) RAID-10 or equivalent storage configurations are strongly recommended.
Footnote 2 This may need to be increased if Enriched data exchange is enabled.
Footnote 3 The use of an NFS share for local data (that is, $RUEI_DATA and $RUEI_HOME) is not supported. Note that this restriction does not apply to $RUEI_DATA/processor/data and $RUEI_DATA/collector/wg/REPLAY.
1.7.3 Collector Requirements
The requirements for Collector systems are shown in Table 1-6.
Table 1-6 Collector System Minimum Requirements
| Element | Requirement |
|---|---|
|
CPU |
64-bit Intel or AMD dual-core processor or equivalent. |
|
Memory |
8 GB. |
|
Disk space |
Minimum 200 GB HDD free spaceFoot 1 . |
|
Network interfaces |
When using a network-TAPFoot 2 device, a minimum of three network interfaces are required:
When using a network-copy port, a minimum of two network interfaces are required:
|
Footnote 1 The use of an NFS share for local data (that is, $RUEI_DATA and $RUEI_HOME) is not supported. Note that this restriction does not apply to $RUEI_DATA/processor/data and $RUEI_DATA/collector/wg/REPLAY.
Footnote 2 Capturing data with a network-TAP device prevents the use of a cascaded TAPs configuration.
Footnote 3 For up and down stream traffic. Note that the use of TAPs that integrate up and down stream traffic on one line (that is, link aggregation TAPs) is not recommended.
1.7.4 Processing Engine Requirements
The requirements for Processing Engine systems are shown in Table 1-7.
Note:
A separate Processing Engine server is only required in very large scale environments (for example, handling hundreds of millions of clicks per day). At least two servers must be dedicated to Processing Engine duties if you want to run the Processing Engine separately from the Reporter.Table 1-7 Processing Engine System Minimum Requirements
| Element | Requirements |
|---|---|
|
CPU |
64-bit Intel or AMD dual-CPU, dual-core processor (> 2 G Hz) or equivalent. |
|
Memory |
16 GB. |
|
Disk space |
|
|
Network interfaces |
A minimum of one network interface is required. |
Footnote 1 To ensure acceptable performance of the RUEI installation, it is recommended to use high performance disk systems, with a minimum supported I/O rate of 70 MB/s. When monitoring high volumes of traffic, more powerful disk systems may be required. (Hardware) RAID-10 or equivalent storage configurations are strongly recommended.
Footnote 2 This may need to be increased if Enriched data exchange is enabled.
Footnote 3 The use of an NFS share for local data (that is, $RUEI_DATA and $RUEI_HOME) is not supported. Note that this restriction does not apply to $RUEI_DATA/processor/data and $RUEI_DATA/collector/wg/REPLAY.
Important:
Please note that an Intel (or compatible) 64-bit platform is a strict requirement for both the hardware and the operating system in all deployment scenarios.1.7.5 Deployment Best Practices
This section presents a best practices framework within which to optimize your RUEI deployment. It is recommended that you carefully review the following information.
It is important that the nature of the monitored network environment is clearly understood before deciding upon your RUEI deployment strategy. This includes not only the basic network connectivity, ports, addressing, and physical device requirements, but also a sound understanding of the monitored applications.
Moreover, before deploying RUEI, the basic traffic flows within the network must have been identified. This should include information about average and peak volumes of traffic. Any physical deployment requirements (such as space limitations, distances, power planning, rack space and layout, or cabling) should also have been identified.
You can use the checklist presented in Appendix H, "Installation Checklist" to capture much of this information.
If you are planning to monitor Forms-based traffic, be aware that the memory requirements may be higher than those outlined in Section 1.7, "Server Requirements". This is especially the case in deployments with heavy levels of Forms traffic. In this case, you should consider a split-server deployment.
If you are planning to make use of the Full Session Replay (FSR) facility, you may need to configure additional storage capacity. This is explained in Section 1.7.7, "Full Session Replay Storage Requirements".
If a significant level of the monitored traffic is encrypted, this can increase the CPU overhead. In this case, it is recommended that you consider configuring additional CPUs or, alternatively, a split-server deployment.
When very high levels of traffic are being monitored (that is, more than 10 million page views per day), it is strongly recommended that you consider a split-server deployment. Alternatively, consider the use of a remote database server. The latter has the effect of significantly reducing (by up to 30%) the CPU overhead on the Reporter system. Monitored environments with more than 20 million page views per day should consider the use of both a split-server deployment and a remote database server.
1.7.6 Data Retention Policies
The availability of specific data within the Data Browser, as well as reports based on that data, depends on the amount of available disk space on the Collector and Reporter systems, as well as the amount of database space available on the Reporter system.
Data gathered during monitoring is first written to log files, stored on the Collector system. These files are copied to, and processed by, the Reporter to populate the database that holds the multi-dimensional data structure viewable through the Data Browser and reports. These temporary log files are automatically removed from the Collector system after three days, and from the Reporter system (by default) after seven days.
The size of the database user quota for the Reporter system is configurable during installation. By default, it is set to 500 GB. It is important to understand that data is consolidated when it is no longer required by the Reporter's defined retention policy. For example, by default, daily information about the last 32 days is retained. Daily information older than this is consolidated into the monthly information. Similarly, monthly information is consolidated into yearly information.
RUEI maintains data at several aggregation levels, whose retention is configured in days. The following describes the various aggregation levels and their default values:
-
Instance: 8 days
-
5-minute: 15 days
-
Hourly: 32 days
-
Daily: 90 days
-
Monthly: 60 months
These numbers can be fine-tuned per category of data (app, suite, service, SLA) and beyond that per individual type (for example, All Pages or Failed Pages). The default value for enriched data exchange is 8 days for each type.
DB space is about 5 GB per period each. This is heavily dependent on load and diversity of traffic. You should occasionally check the reporter data retention screen, especially in the first month, to verify enough disk space is available.
Statistics data is configurable from the CLI. However, statistics retention is not configurable, while User flow completion and fusion product retention are only configurable from the command line.
Minimum and maximum values for data retention settings are automatically determined. Less-detailed aggregation levels must always have at least as much retention as more-detailed aggregation levels.
Be aware that a new RUEI installation will grow quickest during the first 32 days. After that time, the growth rate will slow. Of course, the growth rate depends on monitored traffic levels.
1.7.7 Full Session Replay Storage Requirements
If you are planning to make use of the Full Session Replay (FSR) facility, you may need to configure additional storage capacity available to the Collector system. This should be a separate device (not a partition of the Collector server's existing hard drive), and made accessible to the RUEI file system. The procedure to do this, together with guidance on storage requirements, is described in the rest of this section. Note that this procedure must be repeated for each Collector for which full session replay information is required.
Configuring Additional Storage for Full Session Replay
The procedure described below assumes that you have a fully operational system, and that FSR has been enabled. To configure the additional required storage, do the following:
-
Mount the device. For example, under
/mnt/external_storage. -
Temporarily stop the Collector by issuing the following command:
appsensor stop wg
-
Move the
$APPSENSOR_HOME/wg/REPLAYdirectory to the new device. In the above example, this is/mnt/external_storage, and the result is that the replay files are now located in the/mnt/external_storage/REPLAYdirectory. -
Create a symbolic link from
/mnt/external_storage/REPLAYto$APPSENSOR_HOME/wg/REPLAY. -
Restart the Collector by issuing the following command:
appsensor start wg
-
Calculate the required storage capacity. To do so, multiple the average number of daily page views by the average page size. Then, multiple this number by the number of days you wish full session replay data to be retained. Use Table 1-8 as guidance.
Table 1-8 Full Session Replay Storage Estimates
Low page weight (~10 Kb) Medium page weight (~50 Kb) High page weight (~100 Kb) Page views per day (millions)
Size per day (GB)
Disk I/O (MB/sec)
Size per day (GB)
Disk I/O (MB/sec)
Size per day (GB)
Disk I/O (MB/sec)
0.5
5
0.1
25
0.3
50
0.6
2
20
0.2
100
1.2
200
2.3
5
50
0.6
250
2.9
500
5.8
10
100
1.2
500
5.8
1000
11.6
20
200
2.3
1000
11.6
2000
23.1
50
500
5.8
2500
28.9
5000
57.9
Important:
Table 1-8 is intended for guidance only. It is strongly recommended that you regularly review average page sizes and daily page views, and adjust the required storage size as necessary.Note:
Be aware that FSR functionality uses a significant number of non-sequential read operations. Please consult your hardware vendor for information on how to optimize your I/O performance. -
Select Configuration, then General, then Advanced settings, and then Collector data retention policy. Click the Full session replay storage size (GB) setting. Specify (in gigabytes) the required storage size. Note that the maximum that can be specified is 100 TB. When ready, click Save.
1.7.8 Memory Requirements
When calculating the amount of RAM required by your RUEI installation, it is recommended that you consider the following:
-
For a Reporter system without configured Processing Engines, or a Processing Engine system itself, each million visitor sessions per day requires 256 MB. Hence, 3 million visitor sessions per day would require 768 MB. In addition, each million page views requires 100 MB - 256 MB. Note that exact amount depends the length of monitored URLs, average session duration, and the number of events (such as custom dimensions).
-
For each Collector system, each 100 concurrent hits require 2 MB, and each 1000 SSL connections require 1 MB. In addition, up to 600 MBps of network traffic can be buffered before individual TCP sessions start to be dropped. Up to 600 MBps should also be assumed for content checks (such as XPath queries and error strings). Note that if you define a large number of content checks, or specify that they contain NLS character sets, the memory required may increase.
1.8 Software Requirements
The following GNU/Linux distributions are supported:
-
Oracle Linux 5.x or 6.x 64-bit Intel or AMD compatible.
-
RedHat Enterprise Linux 5.x or 6.x 64-bit Intel or AMD compatible.
The following database versions are supported:
-
11gR2
-
12c Release 1
The minimum required Oracle Database release for RUEI is 11gR2. Note that the best performance for RUEI 13.2.2.1 is achieved with Oracle Database 12c Release 1.
Note:
If you experience an ORA-12805: Parallel Query Server Died Unexpectedly error, see Section G.2 for a suitable workaround.If sensitive data needs to be encrypted, you have the opportunity to encrypt your entire disk configuration during the disk partitioning phase of the Linux installation procedure.
1.9 Network Requirements
-
All server system clocks should be synchronized via NTP using UDP port 123.
-
Support DNS information requests over TCP and UDP port 53.
-
Support reports and e-mail alerts using TCP port 25.
-
Support SNMP traps on request from an SNMP Manager using UDP port 161/162.
-
The RUEI user interface is accessible over HTTPS port 443.
-
In the case of a remote database setup, access to TCP port 1521 is required between the Reporter and remote database server.
-
Each remote Collector system should be accessible by the Reporter system over TCP port 22. It is recommended all other ports be blocked.
-
If you are configuring a failover Reporter system (described in Chapter 9, "Configuring a Failover Reporter System"), the primary and secondary Reporter systems need to be able to contact each other using ICMP.
-
If you are configuring a failover Collector system (described in Chapter 10, "Configuring a Failover Collector System"), the primary and secondary Collector systems need to be able to contact each other using ICMP.
Collector-Reporter and Collector-Processing Engine Bandwidths
The amount of data transferred between a remote Collector and the Reporter system largely depends on the type and level of network application traffic monitored by RUEI. In addition, the configuration of RUEI (such as defined functional errors, content checks, and page naming schemes) also influences the size of Collector files that need to be transferred to the Reporter system.
At peak times, the amount of data that needs to be transferred will be higher than during low traffic periods. Note that the exact amount of the data transmission from a remote Collector to the Reporter system can only be determined after the actual RUEI deployment.
For an initial deployment, the following simple rule can be used: each 5 million daily page views will result in a peak transfer of approximately 125 MB at peak time, and approximately 1 GB per day. Hence, typically only a few percent of the actual monitored traffic will be stored by a Collector and transferred to the Reporter. When you want or need to minimize this data transfer, it is recommended that you minimize the amount of monitored HTTP traffic which is not required by RUEI. For example, by using a subnet or VLAN-filtered network.
In the case of deployments that make use of Processing Engines, the above also applies to Collector-Processing Engine connections.
Table 1-9 shows the firewall requirements for your RUEI deployment.
| From | To | Port(s) | Socket type | Required | Description |
|---|---|---|---|---|---|
|
Reporter |
Collector |
22 (SSH) |
TCP |
Y |
Each remote Collector system must be accessible by the Reporter system over TCP port 22. |
|
Reporter |
Processing Engine |
22 (SSH) |
TCP |
Y |
Each Processing Engine system must be accessible by the Reporter system over TCP port 22. |
|
Reporter |
Processing Engine |
1521Foot 1 (NET8) |
TCP |
Y |
Each Processing Engine system must be accessible by a database connection (by default, over port 1521). |
|
Reporter |
NTP server |
123 (NTP) |
UDP |
Y |
All server system clocks must be synchronized via NTP. |
|
Processing Engine |
NTP server |
123 (NTP) |
UDP |
Y |
All server system clocks must be synchronized via NTP. |
|
Processing Engine |
Collector |
22 (SSH) |
TCP |
Y |
Each Collector system must be accessible by the Processing Engine system over TCP port 22. |
|
Processing Engine |
Reporter |
1521 (NET8) |
TCP |
Y |
Each Processing Engine system must be accessible by a database connection (by default, over port 1521). |
|
Collector |
NTP server |
123 (NTP) |
UDP |
Y |
All server system clocks must be synchronized via NTP. |
|
Remote DB server |
NTP server |
123 (NTP) |
UDP |
Y |
All server system clocks must be synchronized via NTP. |
|
Reporter |
DNS server |
53 (DNS) |
TCP/UDP |
Support DNS information requests. |
|
|
Collector |
DNS server |
53 (DNS) |
TCP/UDP |
Support DNS information requests. |
|
|
Remote DB server |
DNS server |
53 (DNS) |
TCP/UDP |
Support DNS information requests. |
|
|
Reporter |
Mail server |
25 (SMTP) |
TCP |
N |
Support reports and E-mail requests. |
|
Reporter |
SNMP Manager server |
161, 162 (SNMP) |
UDP |
N |
Support SNMP traps on request from an SNMP Manager. |
|
Client browsers |
Reporter |
443 (HTTPS) |
TCP |
Y |
The RUEI user interface is accessible over HTTPS. |
|
Client browsers |
Tag based collector |
80/443 |
TCP |
N |
Support tag based data collection. |
|
ADF Application |
Reporter |
443 (HTTPS) |
TCP |
N |
Support ADF Monitoring Service. |
Footnote 1 Note that this port is configurable.
Footnote 2 Optional, but strongly recommended.
1.10 Client Requirements
The workstations that will access the RUEI user interface must have one of the following browsers installed:
-
Mozilla Firefox 3.6 (or above).
-
Internet Explorer 7, 8, or 9.
-
Safari 4 and 5.
-
Google Chrome 17 (or above).
Note that JavaScript must be enabled. No other browser plug-ins are required.
In addition, the workstation should have a screen resolution of 1024 * 768 (or higher).
Important:
Ensure that any pop-up blocker within the browser has been disabled.RUEI uses AJAX to enhance its user interaction. Internet Explorer relies on the MSXML control to facilitate AJAX. The AJAX dependencies can trigger a security warning when using strict security settings.
Footnote Legend
Footnote 1: Copy ports are also known as Switched Port Analyzer (SPAN) ports which is a feature of Cisco switches.Footnote 2: Test Access Port (TAP) devices are provided by specialist vendors, such as NetOptics Inc.