2. Oracle FLEXCUBE Information Server
Oracle FLEXCUBE Information system provides for flexible enterprise reporting that helps improved decision making. The Oracle FLEXCUBE Information Server collects the data stored in Oracle FLEXCUBE and generates reports.
You can use the Oracle FLEXCUBE Information Server for monitoring your business performance closely. With the reports generated using Oracle FLEXCUBE Information Server, you can have a vivid view of the problems in the business environment and identify the areas that require attention. You can also analyse the new business opportunities and trends that help you enhance your businesses.
The key features of Oracle FLEXCUBE Information Server reporting are as follows:
- Extraction of information in a consumable format at all operational levels and management hierarchies
- Cross functional data in summary form
- Provisions for totals, averages, changes, variances or ratios
- Information based on customer types and product types.
- Historical data for comparisons
This chapter contains the following sections:
- Section 2.1, "Report Generation"
- Section 2.2, "Bank Scorecard I"
- Section 2.3, "Bank Scorecard II"
- Section 2.4, "Bank Scorecard III"
- Section 2.5, "Enterprise Limits and Collateral Management"
- Section 2.6, "Islamic Bank Scorecard"
- Section 2.7, "Dynamic Reports"
2.1 Report Generation
You can generate the various preset reports from Oracle FLEXCUBE Information Server. Login to Oracle Business Intelligence Enterprise Edition. Go to Dashboards. The reports are organized under four dashboards, viz. Bank Scorecard I, Bank Scorecard II, Bank Scorecard III/ Islamic, and Enterprise Limits and Collateral Management.
Oracle Business Intelligence system displays the reports for the selected year quarter. It also shows the data pertaining the previous four year quarters. You can drill down to the account level by clicking the data.
You can view the following reports under the dashboards Bank Scorecard I, Bank Scorecard II, and Bank Scorecard III, Enterprise Limits and Collateral Management, Islamic Bank Scorecard:
- Bank Scorecard I
- Bank Scorecard
- New Assets and Liabilities
- Liabilities Book
- Liabilities Status
- New Account Balances and Deposits
- TD Maturing Status
- Bank Scorecard II
- Corporate Lending Statistics
- Retail Asset Book
- Retail New Disbursements
- Corporate New Disbursements
- NPA Status
- NPA Statistics
- Total Loan Status
- Bank Scorecard III
- Interest Earned and Interest Paid
- Interest Earned
- Interest Paid
Note
Bank Scorecard III will be deployed for Non Islamic Sites and Sites having both CL and CI accounts.
- Enterprise Limits and Collateral Management
- New Sanctioned Limit
- Unutilized Limit
- Expired Lines Status
- Expired line Details
- Limit Sanctioned vs Utilized
- Limit Details
- Credit Rating
- Overdrawn Lines
- Overdue Amount Recovery
- Exposure Details
- Exposure Top10 Liabilities
- Islamic Bank Scorecard
- Profit Earned and Profit Paid
- Profit Earned
- Profit Paid
Note
Islamic Bank Scorecard will be deployed for Islamic Sites.
The reports are displayed across various parameters as shown below.
Reports |
Description |
Assets |
All CL accounts and OD/CC with negative balance |
Liabilities |
All CASA Accounts (CA, SB, TD, Nostro, Vostro) and OD/CC with positive balance |
New Assets |
All ), open/active assets that have contributed for asset balance |
New Liabilities |
All (open), active/new liabilities that have contributed for liability balance |
Interest Earned |
All (open/closed), existing/new assets that have contributed for interest earned |
Interest Paid |
All (open/closed), existing/new liabilities that have contributed for Interest paid |
Profit Earned |
All (open/closed), existing/new assets that have contributed for profit earned |
Profit Paid |
All (open/closed), existing/new assets that have contributed for profit paid |
2.2 Bank Scorecard I
This section contains the following topics:
- Section 2.2.1, "Bank Scorecard"
- Section 2.2.2, "New Assets and Liabilities"
- Section 2.2.3, "Liabilities Book"
- Section 2.2.4, "Liabilities Status"
- Section 2.2.5, "New Account Balances and Deposits"
- Section 2.2.6, "TD Maturing Status"
2.2.1 Bank Scorecard
The bank scorecard shows the details of assets and liability books of your bank. Select the year quarter for which you need to generate the report and click ‘Apply’ button.
The Oracle FLEXCUBE Information Server generates the report with the details of the value and total number of assets and liabilities books, as of the last day of the quarter. The generated report is as follows:
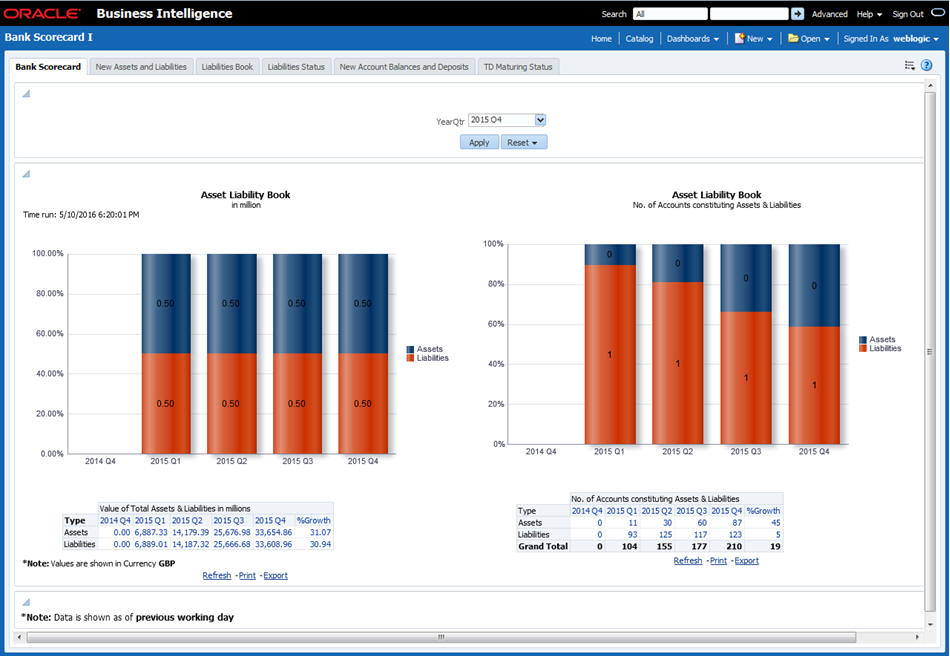
You can view the following details:
- Asset Liability Book Balance: This is a generic report and considers
all modules in Oracle FLEXCUBE.
- Sum of GL balances in asset category and the growth percentage compared to the previous period
- Sum of GL balances in liability category and the growth percentage compared to the previous period
- Asset Liability Book: Number of accounts constituting assets and
liabilities
- All open and active assets and the growth percentage compared to the previous period
- All open and active liabilities and the growth percentage compared to the previous period
The following actions are supported from this screen:
- Refresh - Click this link to refresh the data in the report
- Print - Click this link to print the report
- Export - Click this link to export the report in a different format
2.2.2 New Assets and Liabilities
The new assets and liabilities report shows the value and total number of the new and active assets and liabilities of the bank for each quarter. Select the year quarter and click ‘Apply’ button.
The generated report is as follows:
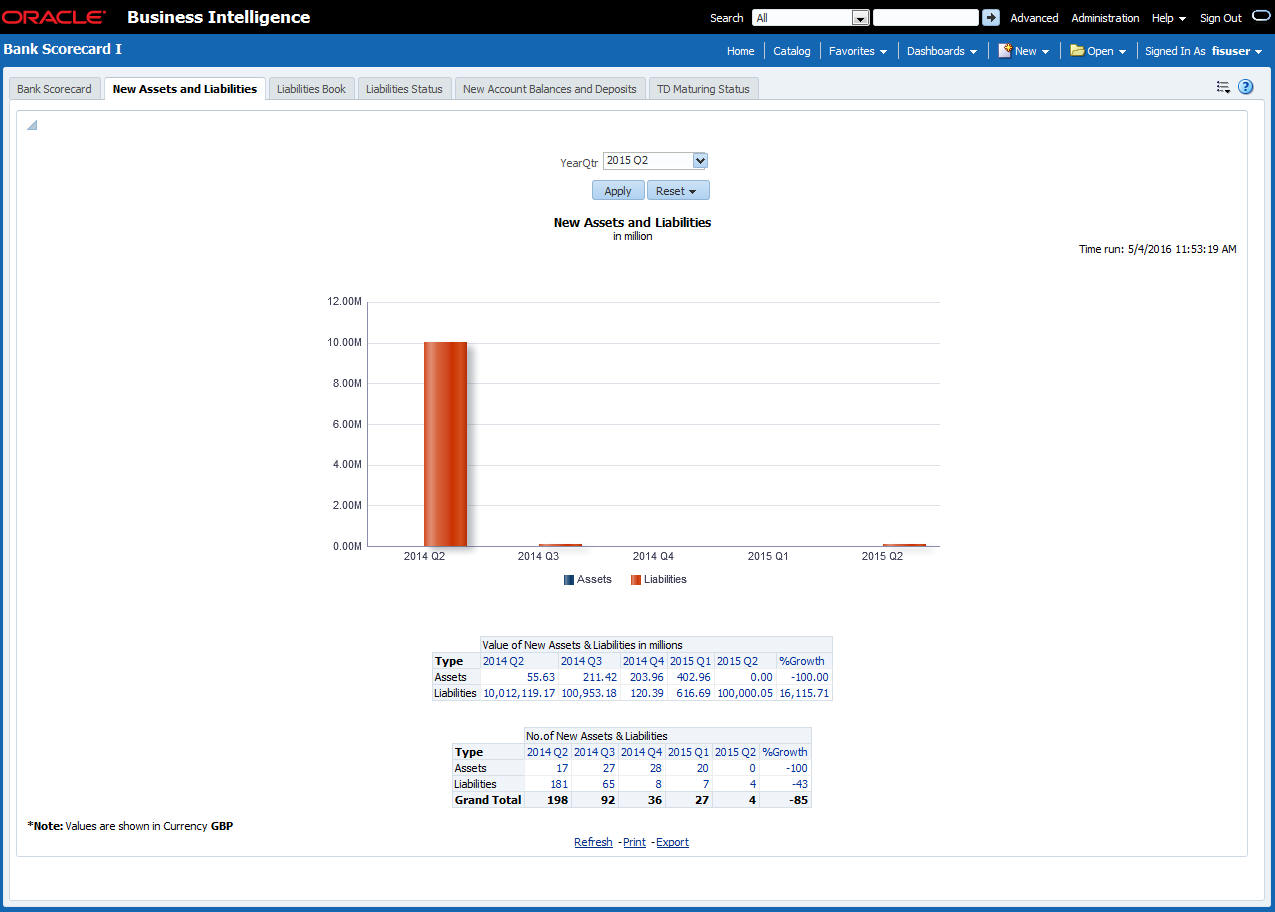
You can view the following details:
- Value of New Assets and Liabilities in Millions
- Values of new assets of the selected quarter and four previous quarters and growth percentage
- Value of new liabilities of the selected quarter and four previous quarters and growth percentage
- Number of New Assets and Liabilities
- Number of new assets of the selected quarter and four previous quarters and growth percentage
- Number of liabilities of the selected quarter and four previous quarters and growth percentage
The following actions are supported from this screen:
- Refresh - Click this link to refresh the data in the report
- Print - Click this link to print the report
- Export - Click this link to export the report in a different format
2.2.3 Liabilities Book
The liabilities book shows the liability account balance and count based on the account type. Only open and active accounts are considered for this report. Select the year quarter and click ‘Apply’ button to view the report. The generated report is as follows:
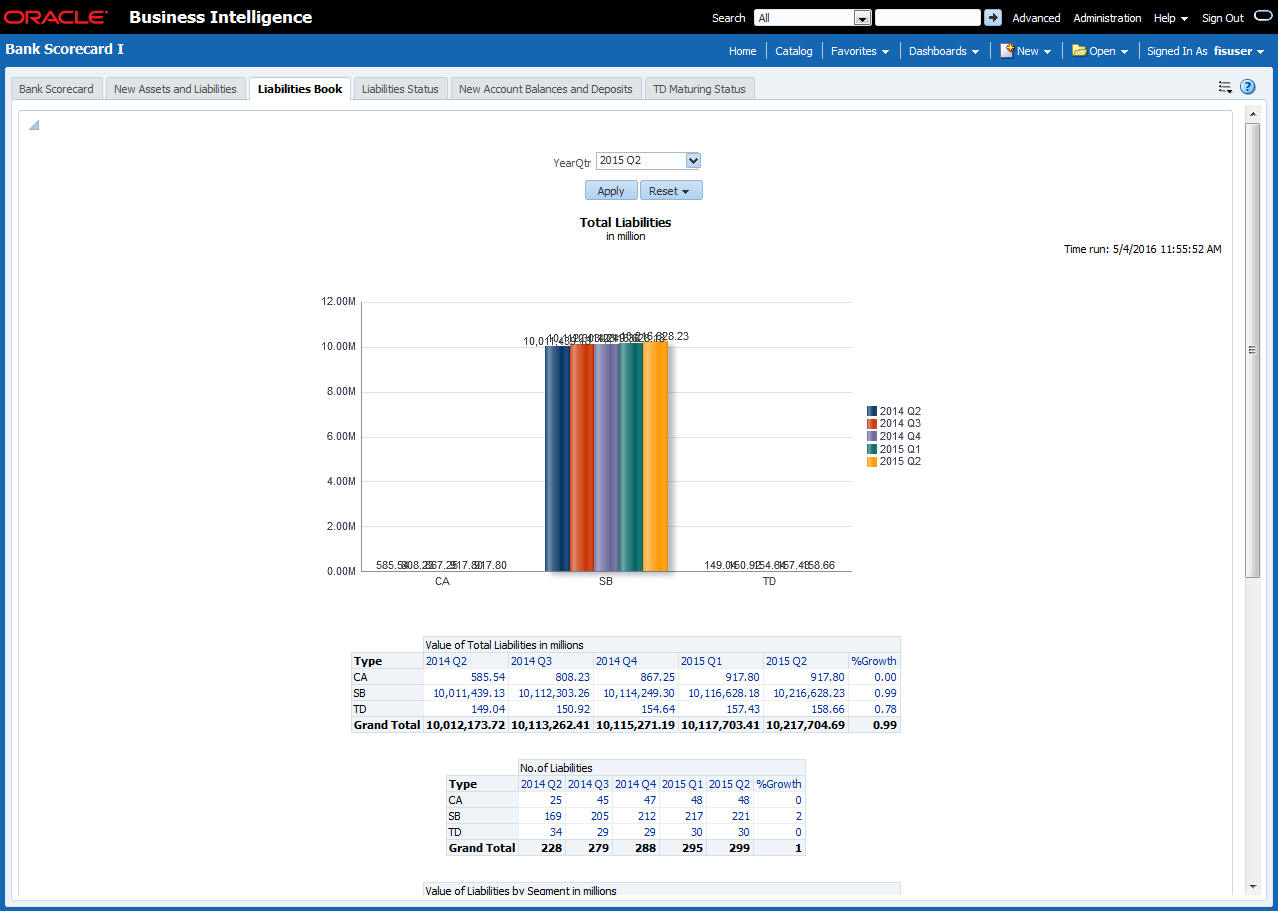
The report shows the following details:
- Value of total liabilities in millions for all account types
- Number of liabilities for all account types
- Value of total liabilities by segments in millions for all segments
- Number of liabilities for the account types for all segments
Note
In this report, all the all positive and negative balances of all current accounts are netted for the quarter. The graph is shown in the positive or negative axis depending on the net.
In case of OD/CC, the accounts that have positive balance alone is included
If the customer segment is not mapped, the report is displayed without classification under the customer segment ‘Unclassified’.
The following actions are supported from this screen:
- Refresh - Click this link to refresh the data in the report
- Print - Click this link to print the report
- Export - Click this link to export the report in a different format
2.2.4 Liabilities Status
This report shows the value and count of active and dormant liabilities for the current business day. The generated report is as follows:
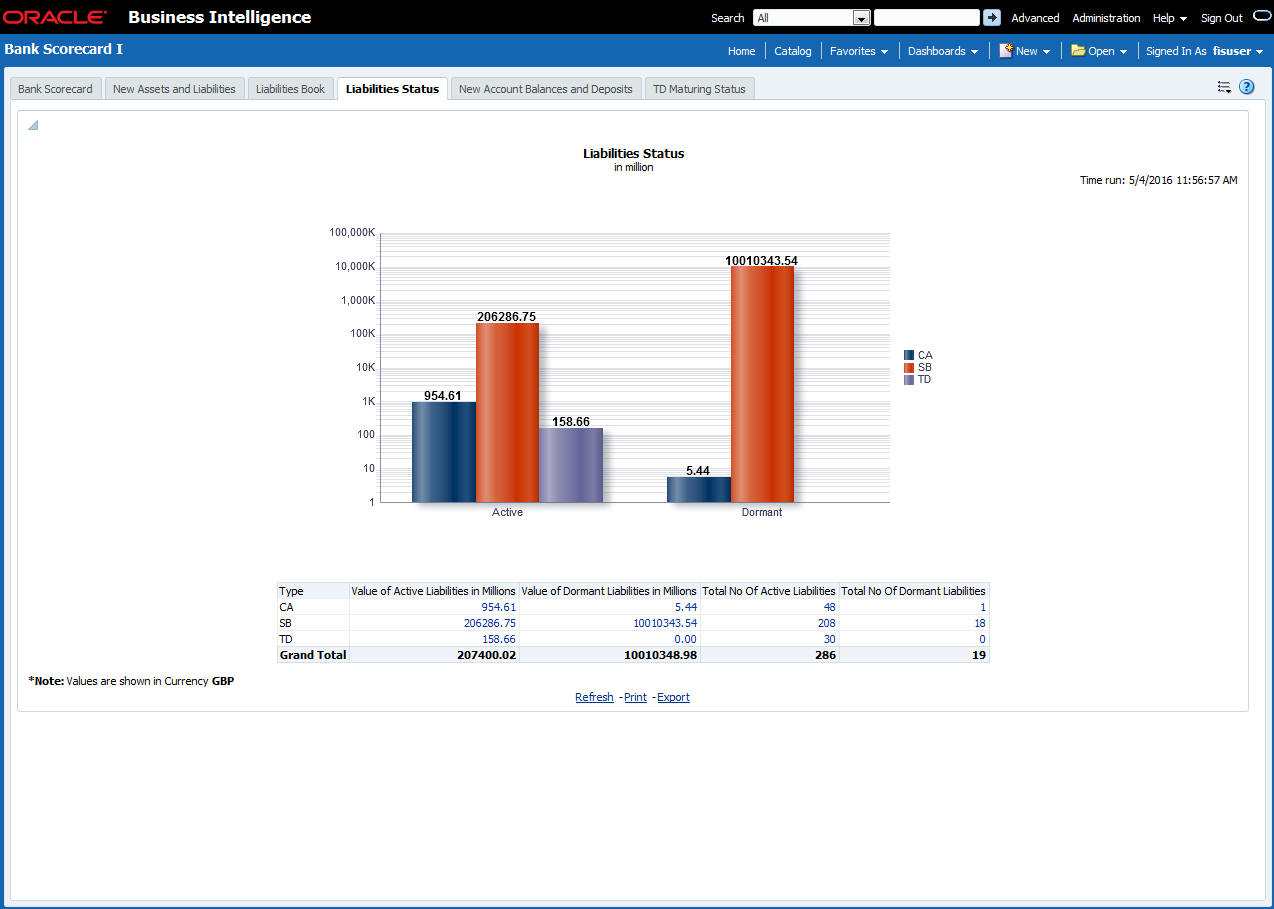
The report shows the following details:
- Value of active liabilities in millions for the account types
- Value of dormant liabilities in millions for the account types
- Number of active liabilities for the account types
- Number of dormant liabilities for the account types
You can click the values in the report to see the details.
The following actions are supported from this screen:
- Refresh - Click this link to refresh the data in the report
- Print - Click this link to print the report
- Export - Click this link to export the report in a different format
2.2.5 New Account Balances and Deposits
This report shows the number of new accounts, including those which are open and closed in a given quarter and the balance in each account. The details in this report are as of the last day of the previous quarter or current day of the running quarter selected.
. The generated report is as follows:
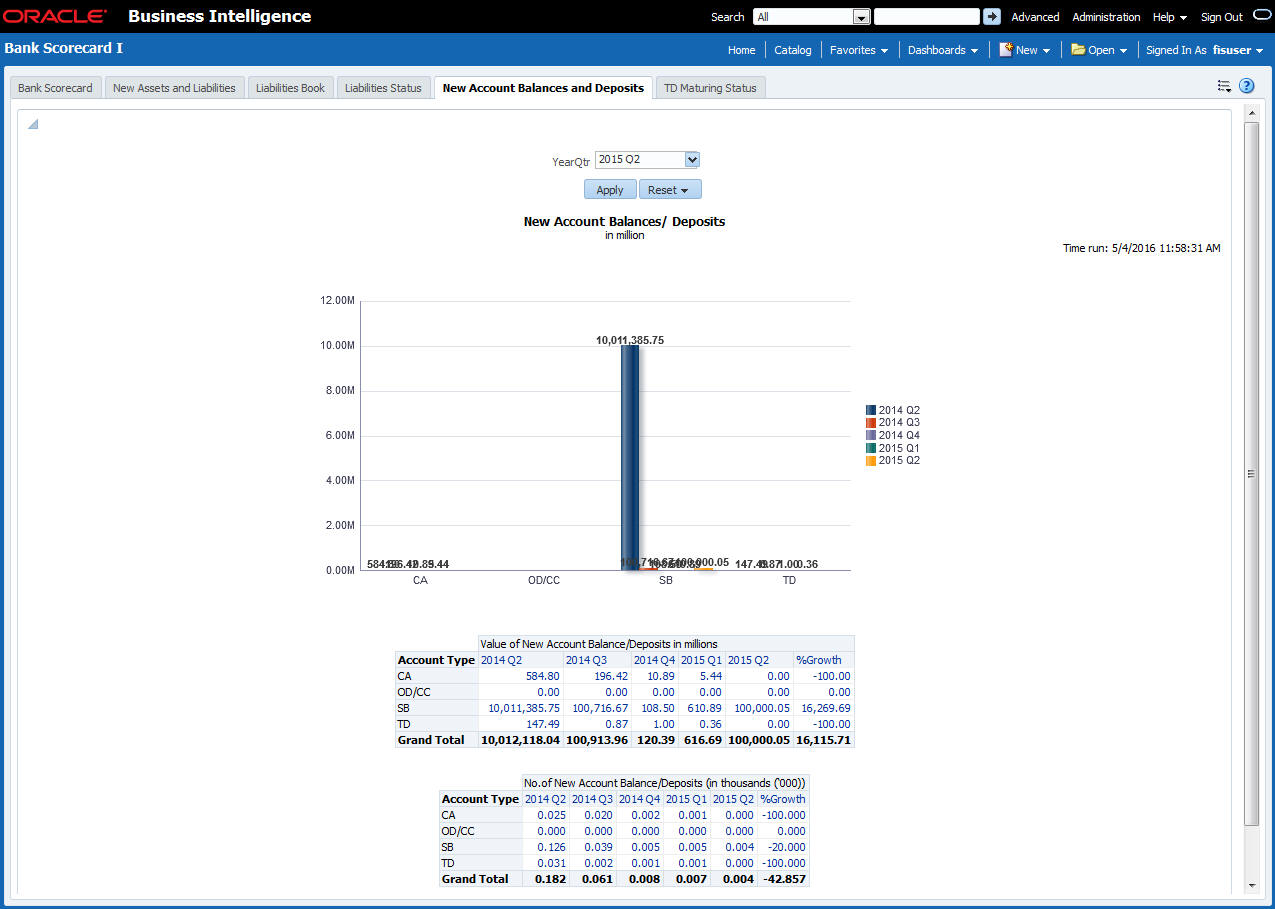
The report shows the following details:
- Value of new account balance and deposits in millions for the account types and the growth percentage
- Number of new account balance and deposits in millions for the account types and the growth percentage
The following actions are supported from this screen:
- Refresh - Click this link to refresh the data in the report
- Print - Click this link to print the report
- Export - Click this link to export the report in a different format
2.2.6 TD Maturing Status
This report shows the balance and interest details of term deposit accounts that are expiring within certain periods of time. The details are displayed as of the current business day. The generated report is as follows:
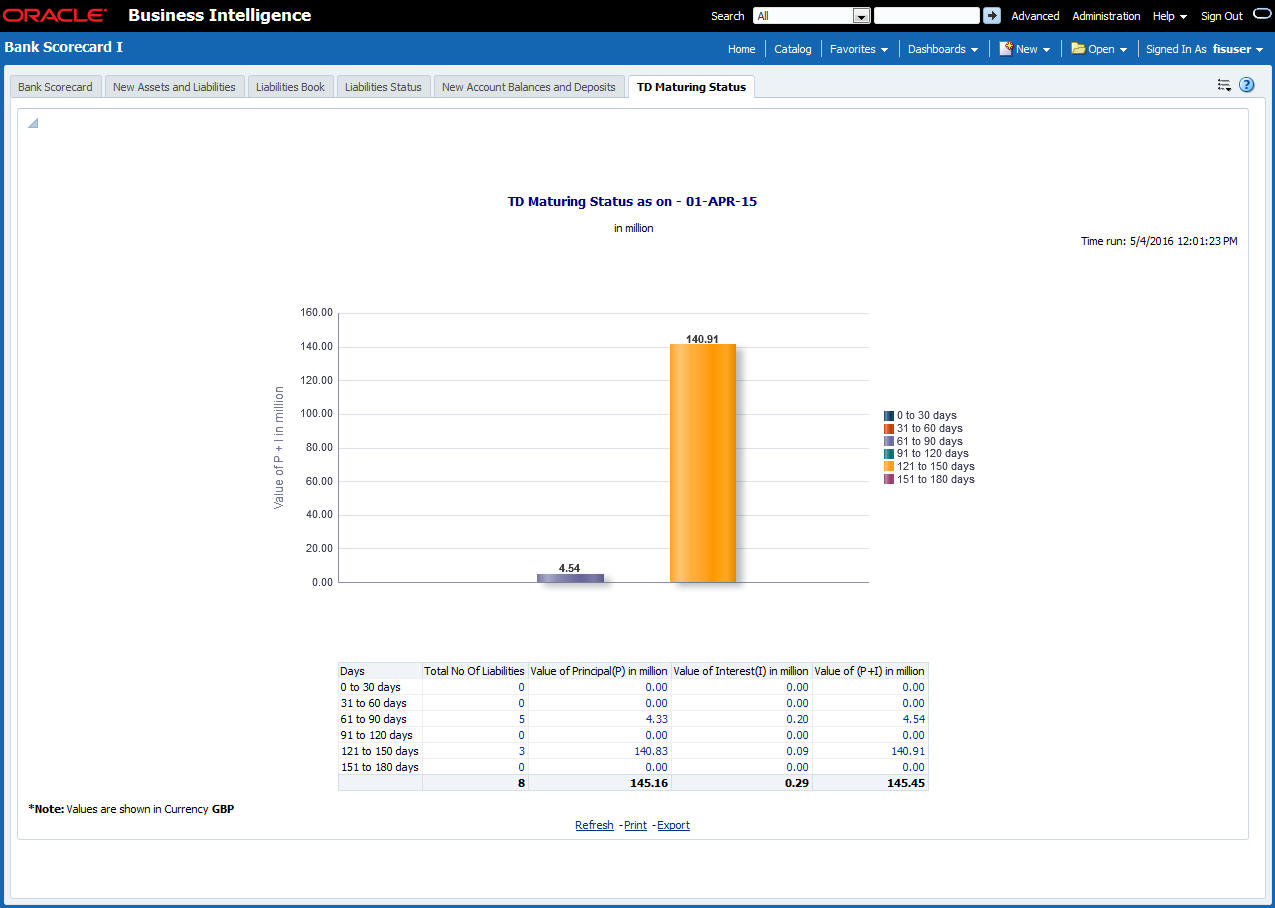
You can view the following details pertaining to TD(P), TD(I) and TD(P+I) accounts:
- Number and value of term deposit accounts expiring in 30 days
- Number and value of term deposit accounts expiring in 60 days
- Number and value of term deposit accounts expiring in 120 days
- Number and value of term deposit accounts expiring in 180 days
- Others
The following actions are supported from this screen:
- Refresh - Click this link to refresh the data in the report
- Print - Click this link to print the report
- Export - Click this link to export the report in a different format
2.3 Bank Scorecard II
This section contains the following topics:
- Section 2.3.1, "Corporate Lending Statistics"
- Section 2.3.2, "Retail Asset Book"
- Section 2.3.3, "Retail New Disbursements"
- Section 2.3.4, "Corporate New Disbursements"
- Section 2.3.5, "NPA Status"
- Section 2.3.6, "NPA Statistics"
- Section 2.3.7, "Total Loan Status"
2.3.1 Corporate Lending Statistics
This report displays corporate wise lending across industries. Each industry is associated with a credit rating. The percentage distribution of the amount financed across different credit ratings is displayed in this report. Any industry that is not associated to credit rating is shown as unclassified. The details are shown as of the previous business day. The generated report is as follows:
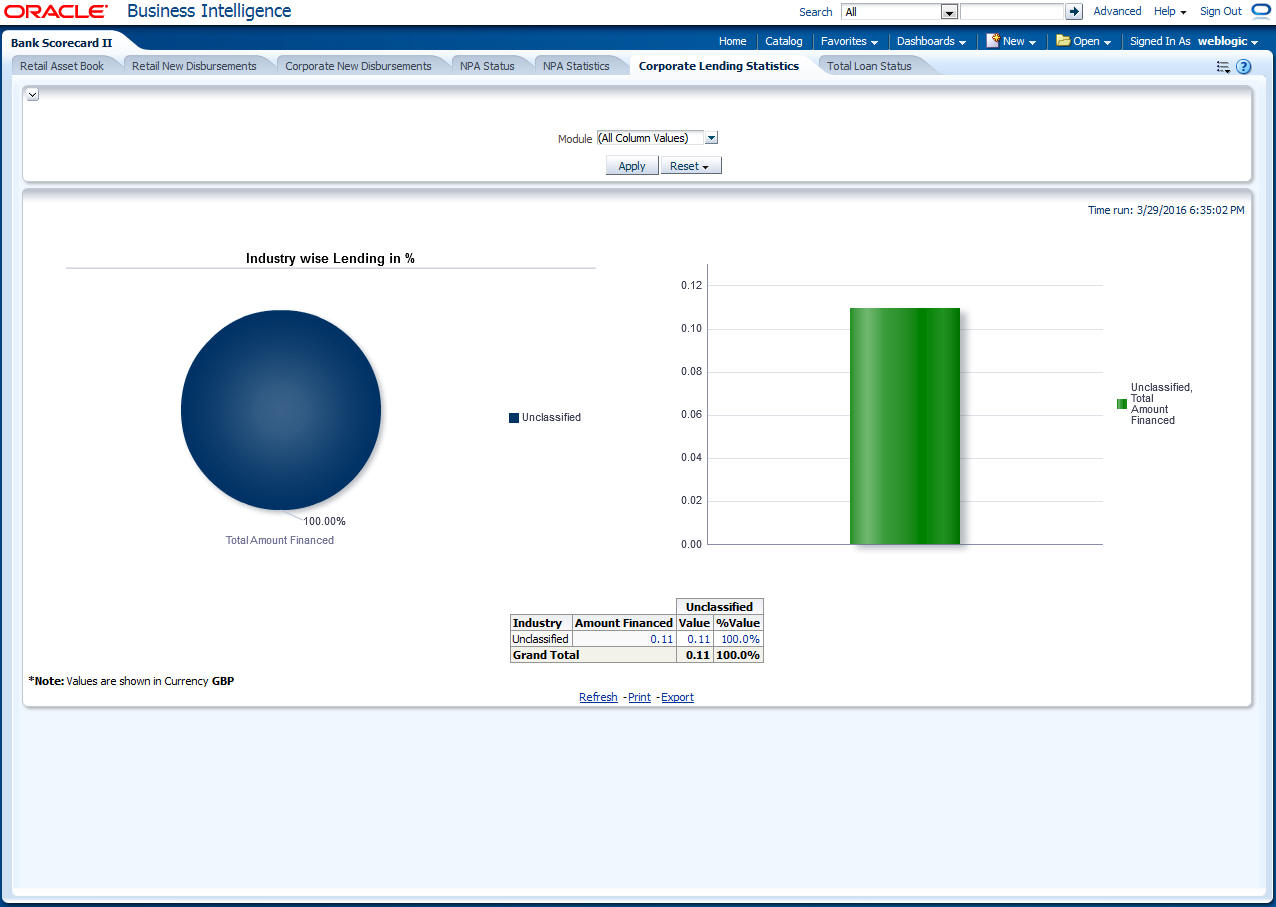
You can view the total amount financed in millions to each industry. You can click the links to drill down to the next levels for further details on each record.
This report displays the data for the Customer type ‘Corporate’.
The following actions are supported from this screen:
- Refresh - Click this link to refresh the data in the report
- Print - Click this link to print the report
- Export - Click this link to export the report in a different format
2.3.2 Retail Asset Book
This report displays the total advances and outstanding balances across different type of loans. Any Loan without a loan type is displayed under 'Unclassified' category. This report displays the data for the customer type ‘Individual’.
The generated report is as follows:
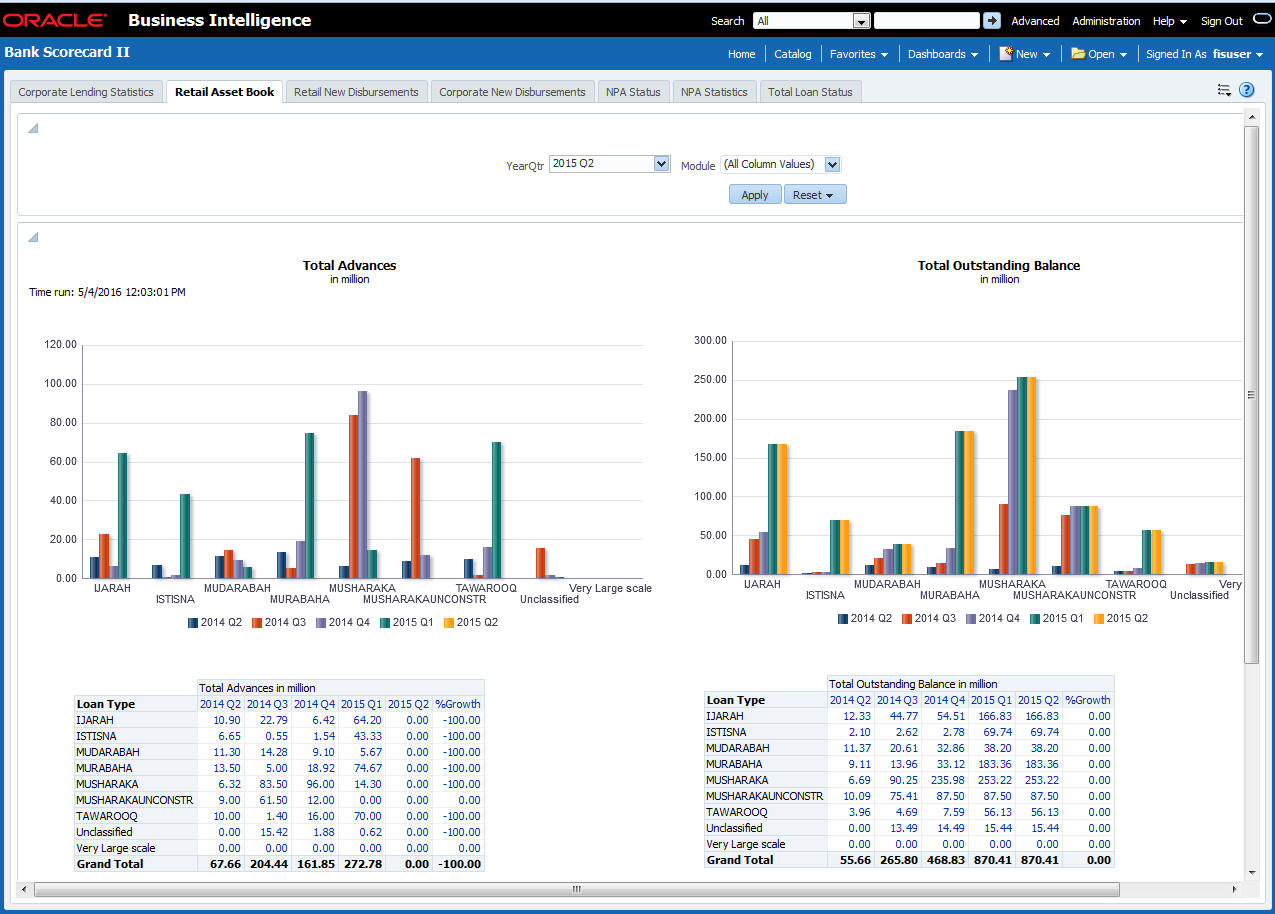
You can view the following details:
- Total advances in millions for all loan types for the selected quarter and four previous quarters including the growth percentage
- Total number of advances for the selected quarter and four previous quarters including the growth percentage
- Total advances in million for various customer segments for the selected quarter and four previous quarters including the growth percentage
- Total number of advances for various customer segments for the selected quarter and four previous quarters including the growth percentage
- You can select the report based on the module from the ‘Module’ filter
The following actions are supported from this screen:
- Refresh - Click this link to refresh the data in the report
- Print - Click this link to print the report
- Export - Click this link to export the report in a different format
2.3.3 Retail New Disbursements
This report shows the value and the number of new disbursements made across different types of retail loans for each quarter. This also shows the same details for each segment. This report displays the data for the customer type ‘Individual’.
The generated report is as follows:
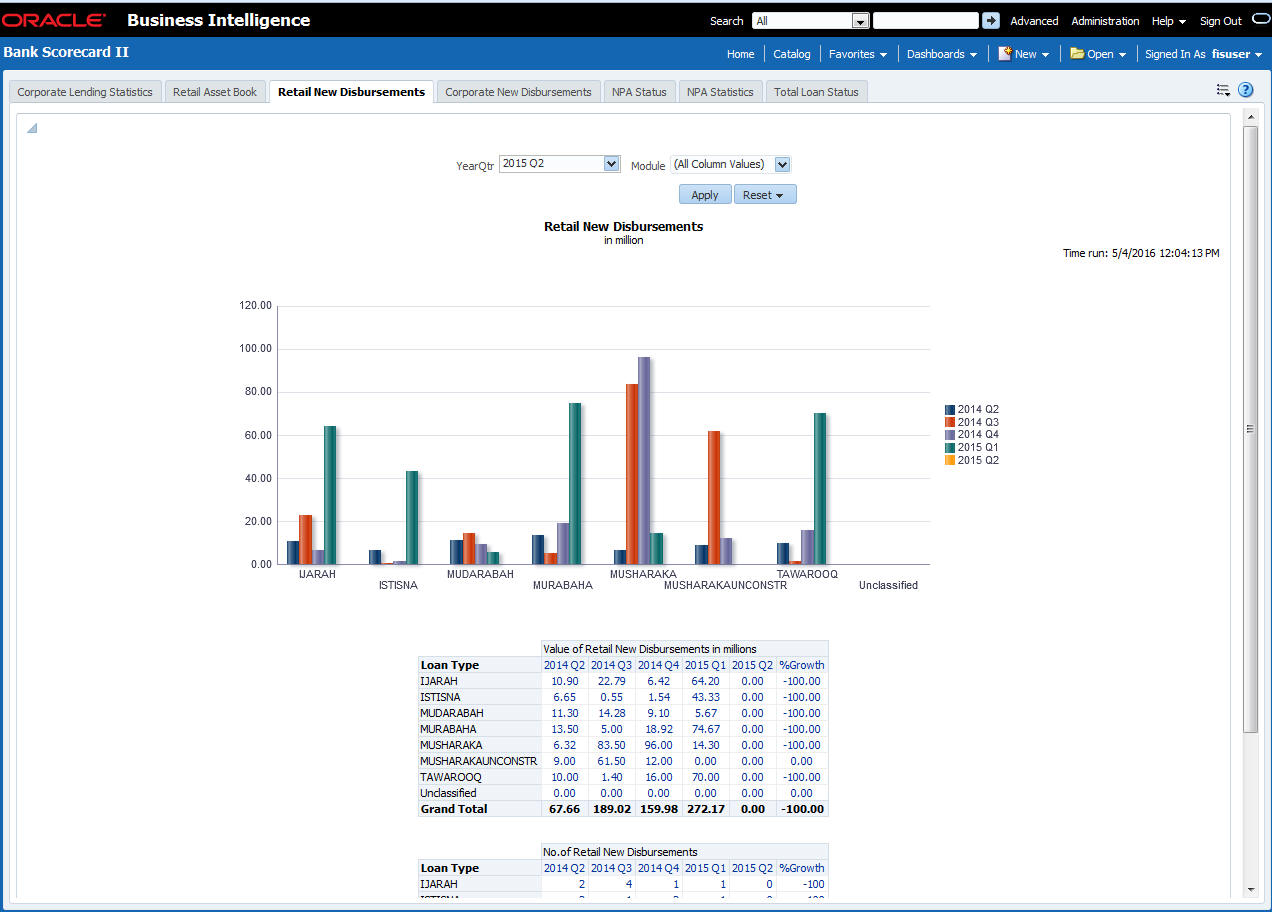
You can view the following details:
- Value of new retail disbursements in millions for various loan types for the selected quarter and four previous quarters including the growth percentage
- Total number of new retain disbursements for loan types the selected quarter and four previous quarters including the growth percentage
- You can select the report based on the module from the ‘Module’ filter
The following actions are supported from this screen:
- Refresh - Click this link to refresh the data in the report
- Print - Click this link to print the report
- Export - Click this link to export the report in a different format
2.3.4 Corporate New Disbursements
This report displays the total disbursements across different type of corporate loans.
Note
- Conventional Loans - Loans have a Loan type UDF defined at Loan product.
- Islamic Loans - Product Category of Islamic loans is considered as Loan Type
This report displays the data for the Customer type ‘Corporate’. The generated report is as follows:
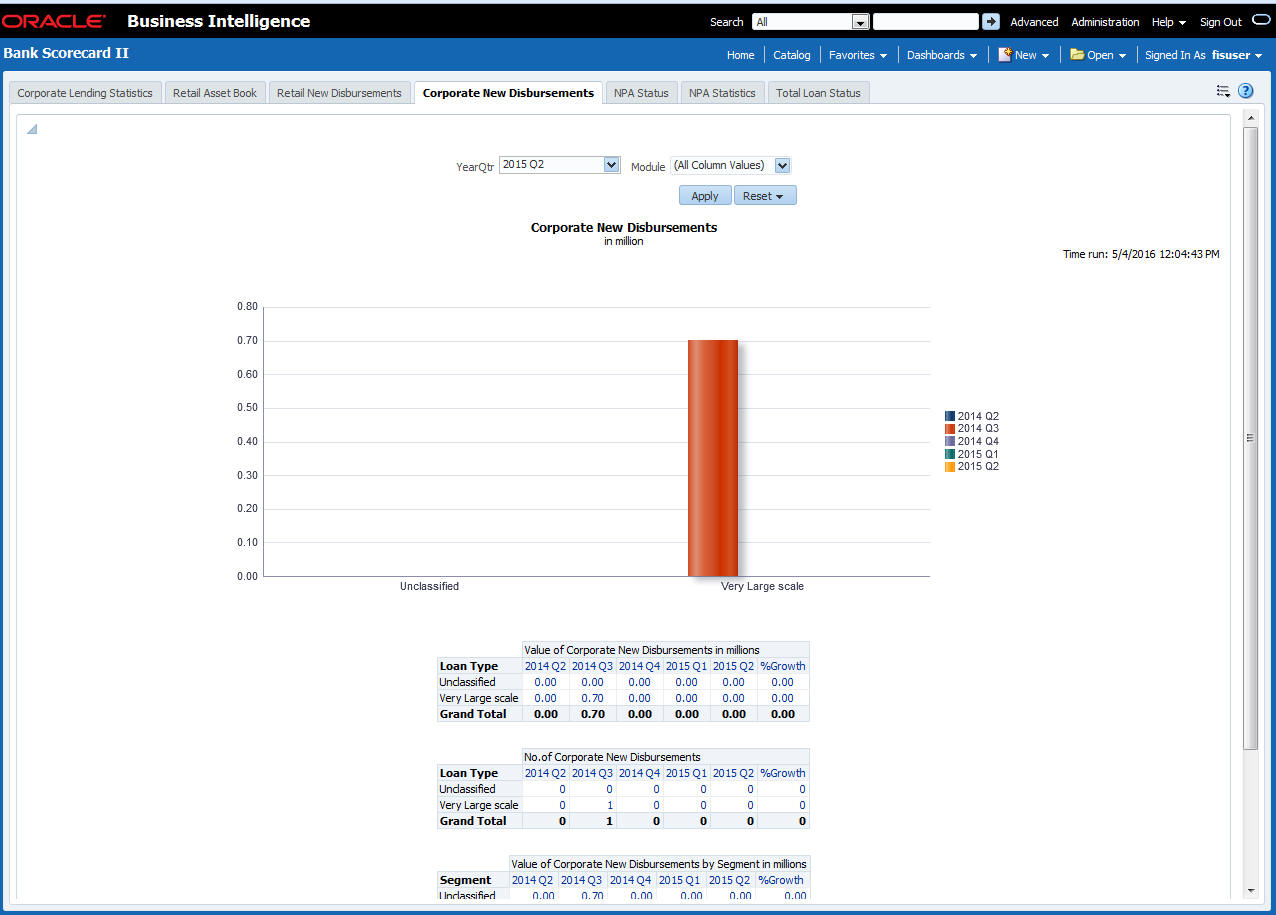
You can view the following details:
- Value of new corporate disbursements in millions for loan types for the selected quarter and four previous quarters including the growth percentage
- Total number of new corporate disbursements for loan types the selected quarter and four previous quarters including the growth percentage
- Value of corporate disbursements by segment in Millions
- Number of corporate disbursements by segment
- You can select the report based on the module from the ‘Module’ filter
The following actions are supported from this screen:
- Refresh - Click this link to refresh the data in the report
- Print - Click this link to print the report
- Export - Click this link to export the report in a different format
2.3.5 NPA Status
This report shows the details of non-performing assets for each segment. This report shows the details of the current business day. The generated report is as follows:
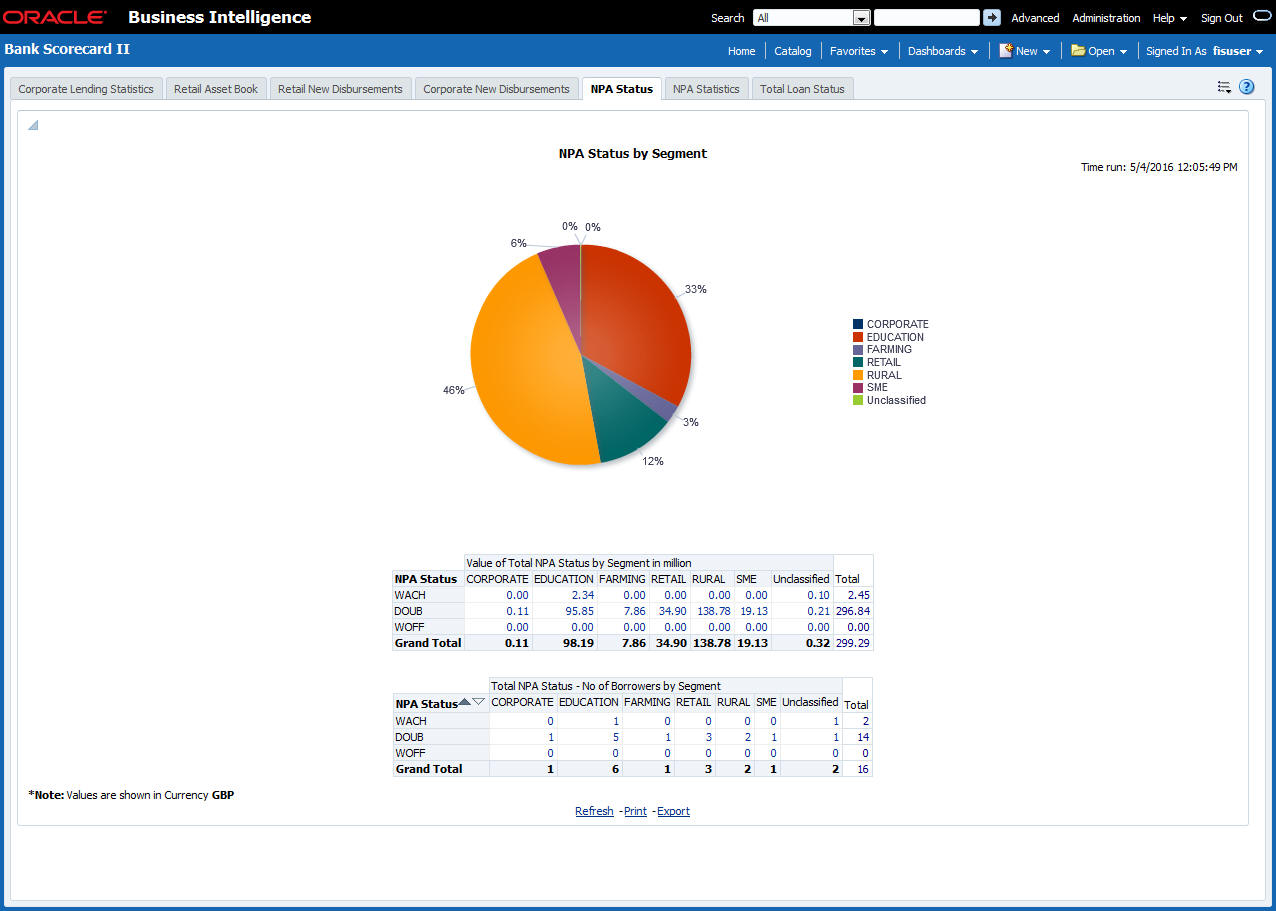
You can view the following details:
- Value of total NPA status in millions for each segment
- Number of borrowers based on NPA status for each segment
You can drill down to further levels by clicking the links.
The following actions are supported from this screen:
- Refresh - Click this link to refresh the data in the report
- Print - Click this link to print the report
- Export - Click this link to export the report in a different format
2.3.6 NPA Statistics
The generated report is as follows:
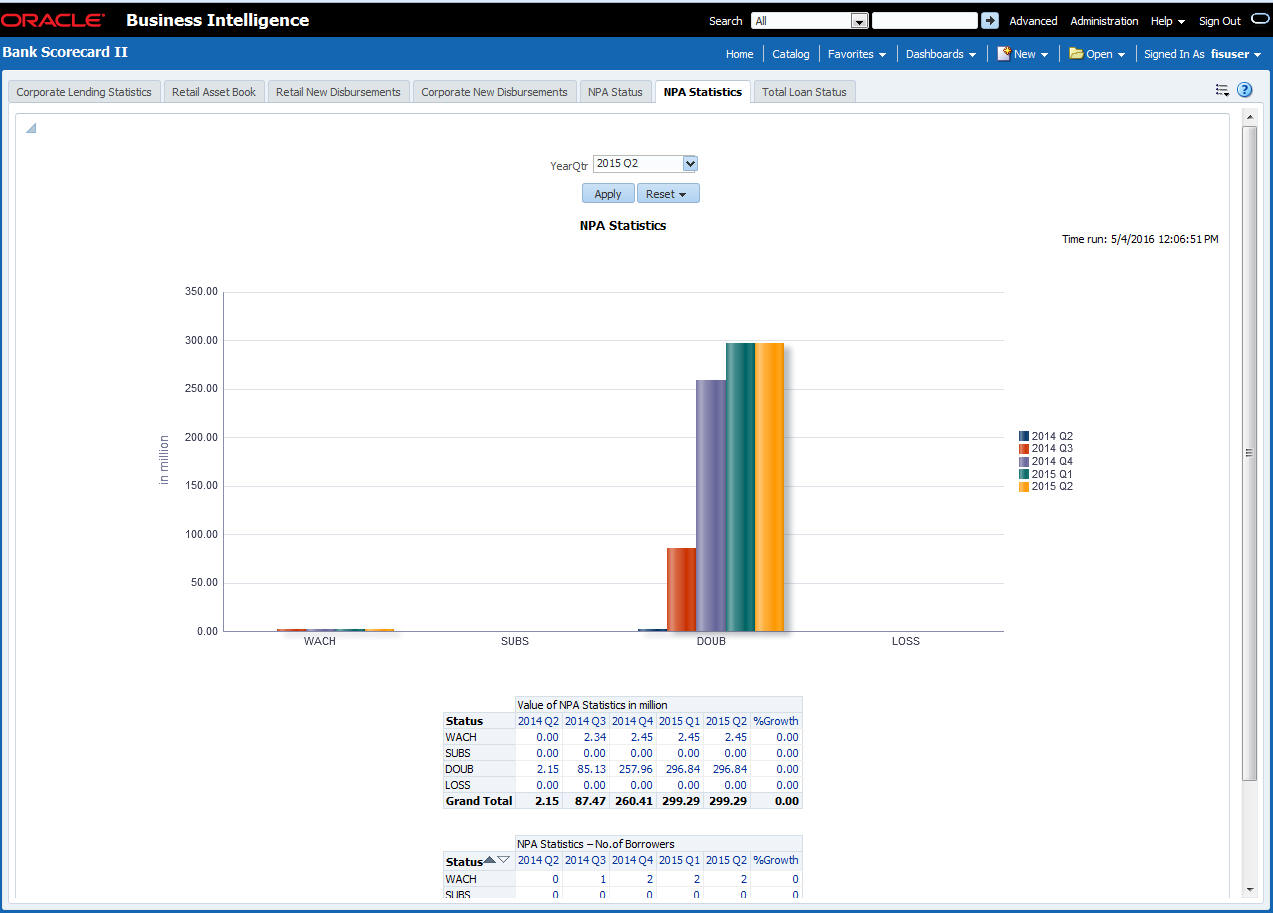
You can view the following details:
- Value of total NPA status in millions for the selected quarter and four previous quarters
- Number of borrowers based on NPA status for the selected quarter and four previous quarters
You can drill down to further levels by clicking the links.
The following actions are supported from this screen:
- Refresh - Click this link to refresh the data in the report
- Print - Click this link to print the report
- Export - Click this link to export the report in a different format
2.3.7 Total Loan Status
This report shows the status of loans for each quarter. The generated report is as follows:
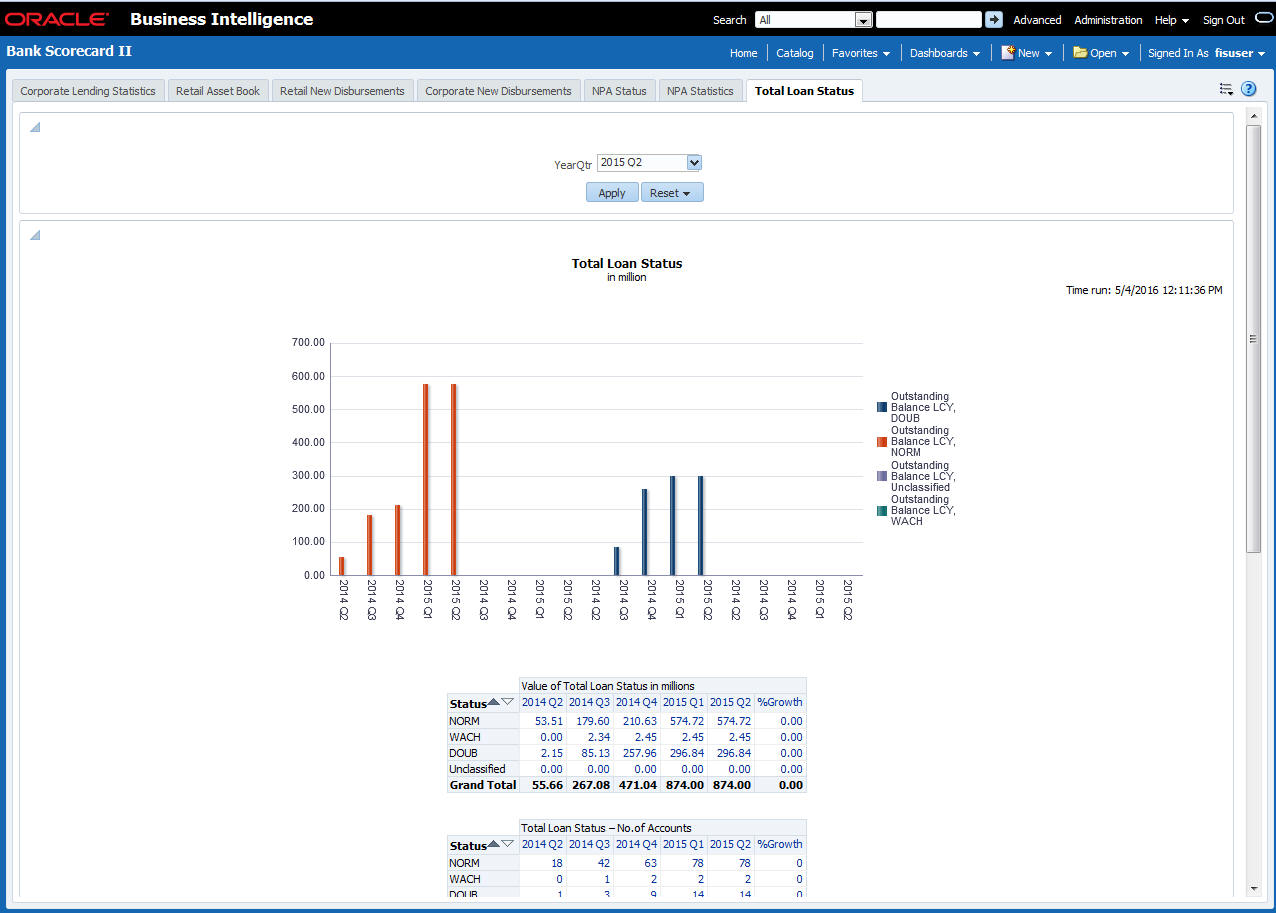
You can view the following details:
- Value of total loans in millions across loan statuses, for the selected quarter and four previous quarters
- Value of total loan status by segment
- Number of loan accounts across loan statuses for the selected quarter and four previous quarters
- Number of loan accounts by segment "
The following actions are supported from this screen:
- Refresh - Click this link to refresh the data in the report
- Print - Click this link to print the report
- Export - Click this link to export the report in a different format
2.4 Bank Scorecard III
This section contains the following topics:
- Section 2.4.1, "Interest Earned and Interest Paid"
- Section 2.4.2, "Interest Paid"
- Section 2.4.3, "Interest Earned"
2.4.1 Interest Earned and Interest Paid
This report shows the interest earned and the interest paid for all loan accounts (active or liquidated) and accounts (open or closed) across quarters. Accruals are considered for this interest calculation. However, Nostro and Vostro accounts are not included. Select the year quarter and click ‘Apply’ button.
Note
Bank Scorecard III will be deployed for Non Islamic Sites and Sites having both CL and CI accounts.
The generated report is as follows:
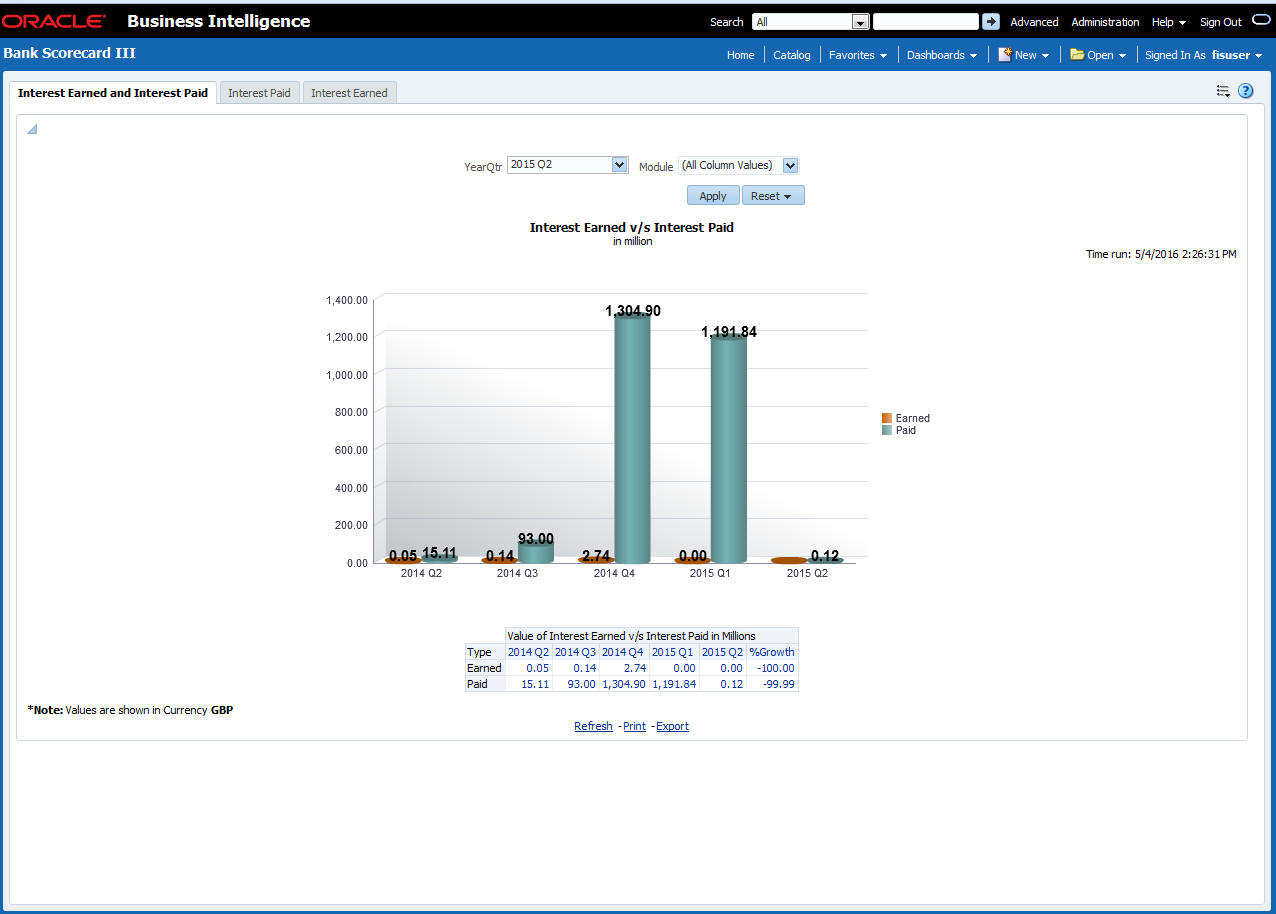
You can view the following details:
- Interest Earned and Interest Paid in Millions
- Interest earned for the selected quarter and four previous quarters and growth percentage
- Interest paid for the selected quarter and four previous quarters and growth percentage
- You can select the report based on the module from the ‘Module’ filter
The following actions are supported from this screen:
- Refresh - Click this link to refresh the data in the report
- Print - Click this link to print the report
- Export - Click this link to export the report in a different format
2.4.2 Interest Paid
This report shows the interest amount paid by the bank across account types for each quarter. Accruals are considered for these interest calculations. The generated report is as follows:
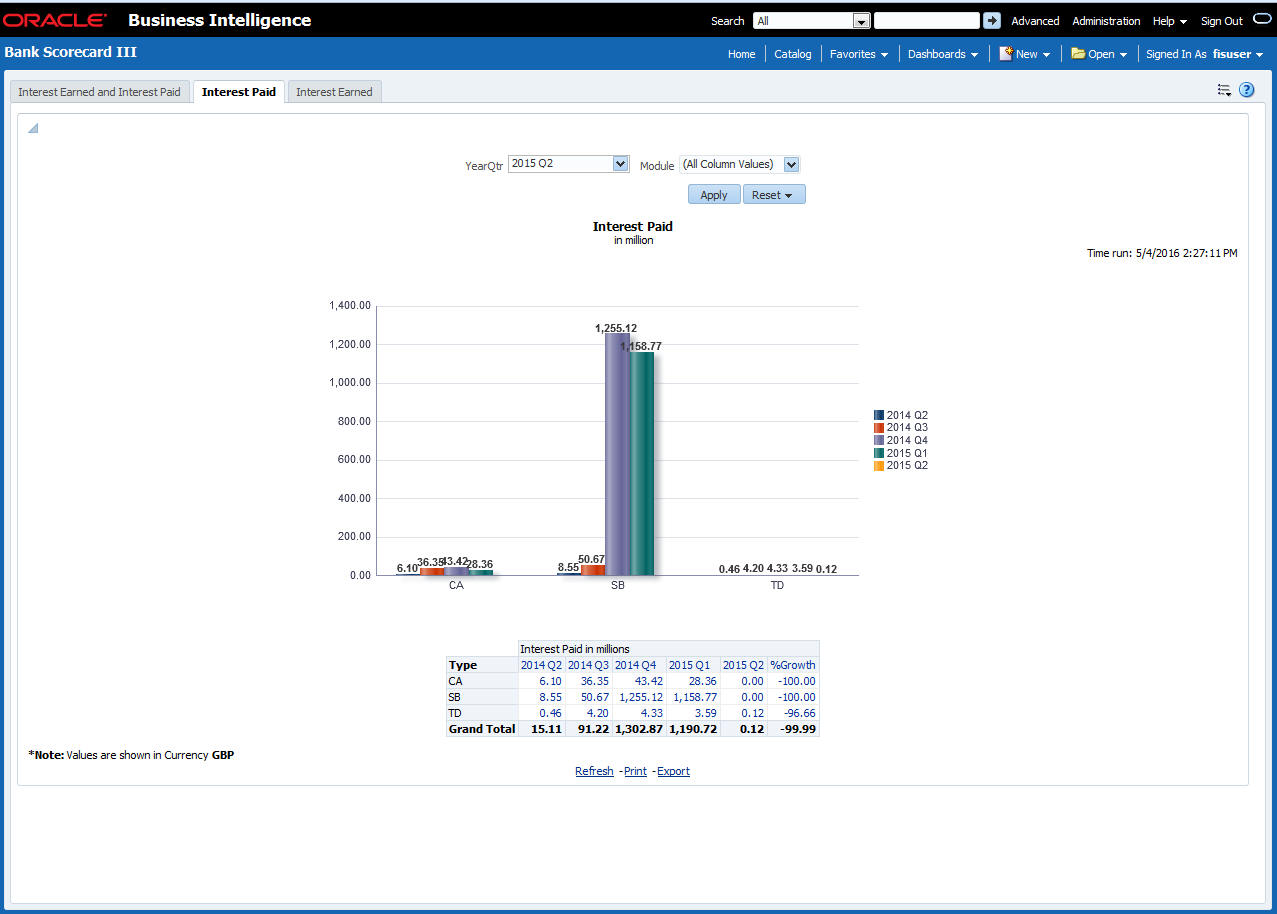
You can view the following details:
- Value of Interest Earned in Millions
- Interest paid in millions for the selected quarter and four previous quarters and growth percentage for account types
- Interest paid for the selected quarter and four previous quarters and growth percentage for account types
- Interest paid for the selected quarter and four previous quarters and growth percentage for account types
The following actions are supported from this screen:
- Refresh - Click this link to refresh the data in the report
- Print - Click this link to print the report
- Export - Click this link to export the report in a different format
2.4.3 Interest Earned
This report shows the interest earned across loan types for each quarter. The generated report is as follows:
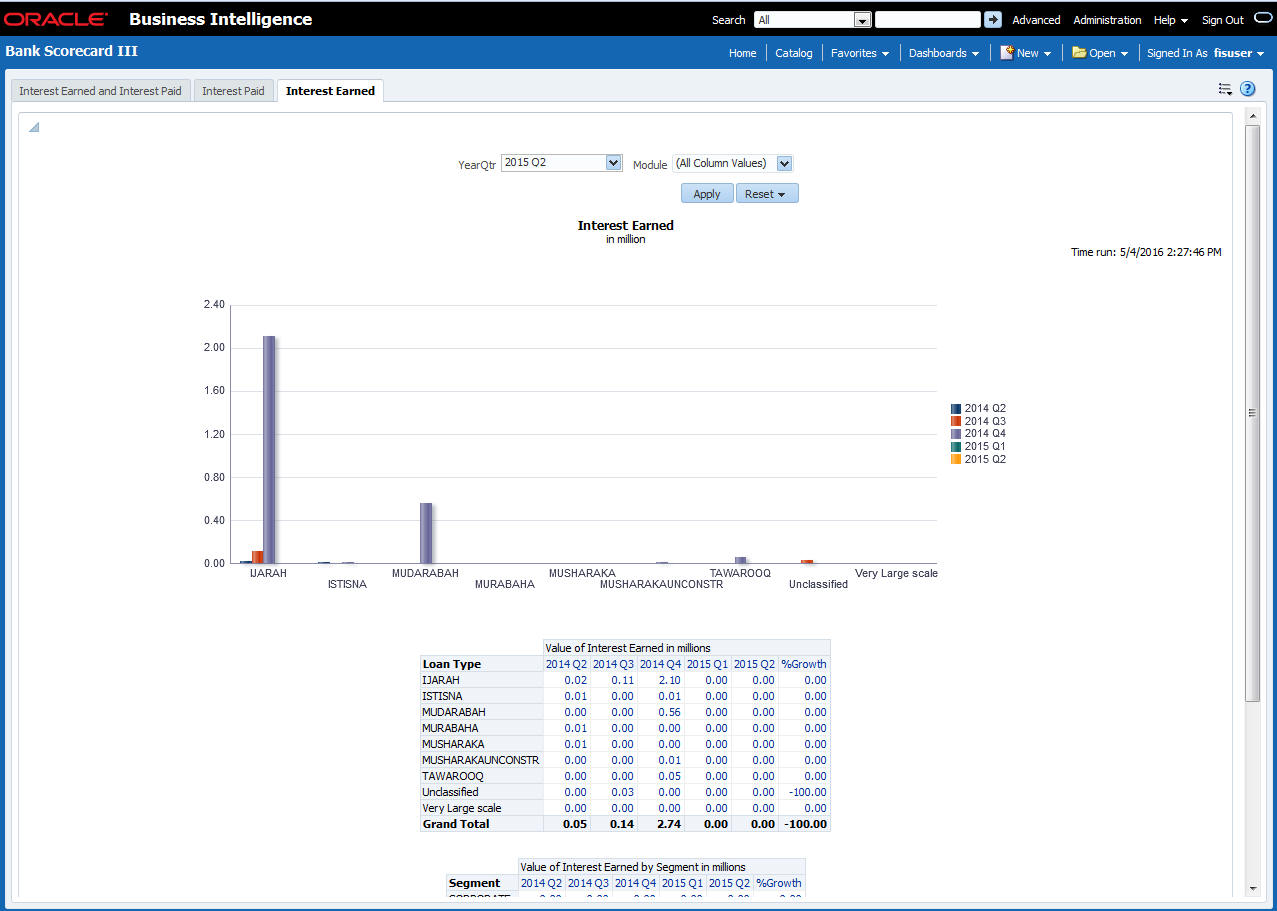
You can view the following details:
- Value of Interest Earned in Millions
- Interest earned for the selected quarter and four previous quarters and growth percentage for loan types
- Value of Interest Earned by Segment in Millions
- Interest earned for the selected quarter and four previous quarters and growth percentage for segments
- You can select the report based on the module from the ‘Module’ filter
The following actions are supported from this screen:
- Refresh - Click this link to refresh the data in the report
- Print - Click this link to print the report
- Export - Click this link to export the report in a different format
2.5 Enterprise Limits and Collateral Management
This section contains the following topics:
- Section 2.5.1, "New Sanctioned Limit"
- Section 2.5.2, "Unutilized Limit"
- Section 2.5.3, "Expired Line Status"
- Section 2.5.4, "Expired Line Details"
- Section 2.5.5, "Limits Sanctioned Vs Utilized"
- Section 2.5.6, "Limit Details"
- Section 2.5.7, "Credit Rating"
- Section 2.5.8, "Overdrawn Lines"
- Section 2.5.9, "Overdue Amount Recovery"
- Section 2.5.10, "Exposure Details"
- Section 2.5.11, "Exposure Top 10 Liabilities"
The reports that you can view from the dashboard are discussed below.
2.5.1 New Sanctioned Limit
The New Sanctioned limit report displays the details of new limit amounts sanctioned by the bank for all type of customers in a quarter and also it provides the pictorial representation of the newly sanctioned limit across various quarters
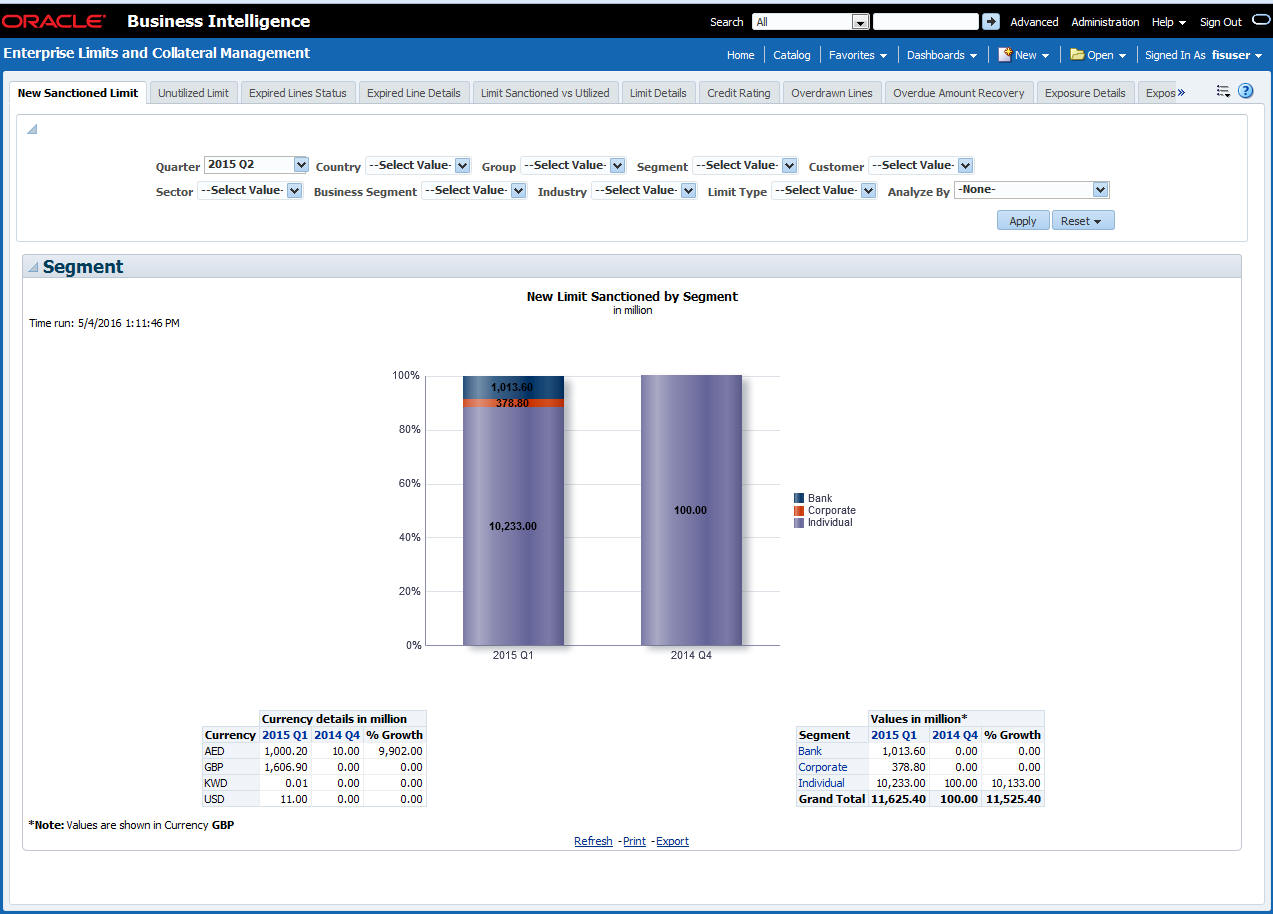
Analyze By
You can analyse the report by the following parameters.
- Segment
- Country
- Business segment
- Quarter
- Sector
- Limit type
- Group
- Liab Number
- Industry
Select the appropriate dimension from the drop down list and click ‘Apply’ button. The system displays the details of the new sanctioned limits in graph and tables, analysed based on the selected dimension.
You can also filter the reports based on the following parameters:
- Quarter
- Country
- Group
- Segment
- Customer
- Sector
- Business segment
- Industry
- Limit type
You can drill down to further levels by clicking the respective links, as illustrated below.
Analyze by Report |
Drill Down values |
Report |
Drill down values |
|
Segment |
Bank |
New Limit Sanctioned by Segment - Bank |
|
|
Corporate |
New Limit Sanctioned by Segment - Corporate |
Group Code and Unclassified |
New Limit Sanctioned by Segment Corporate - Customer |
|
Individual |
New Limit Sanctioned by Segment - Individual |
|
|
|
Country |
Countries of the customers where new limits has been sanctioned |
New limit Sanctioned by Various list of countries |
|
|
Business Segment |
List of Business Segments and Unclassified |
New Limit Sanctioned by Business Segment Secured & Unsecured |
Secured |
New Limit Sanctioned by Business Segment - Secured |
Unsecured |
New Limit Sanctioned by Business Segment - UnSecured |
|||
Quarter |
NA |
|
|
|
Sector |
List of Sectors and Unclassified |
New Limit Sanctioned by Sector - Secured & Unsecured |
|
|
Limit Type |
Secured |
New Limit Sanctioned by Type- Secured |
Utilized |
New Limit Sanctioned by Type-Secured - Utilized - Business Segment |
Unutilized |
New Limit Sanctioned by Type-Secured - UnUtilized - Business Segment |
|||
Unsecured |
New Limit Sanctioned by Type- UnSecured |
Utilized |
New Limit Sanctioned by Limit Type - Unsecured - Utilized - Business Segment |
|
|
|
|
Unutilized |
New Limit Sanctioned by Limit Type - UnSecured - Unutilized - Business Segment |
Group |
Group Codes and Unclassified |
New Limit Sanctioned by Group- Customer |
|
|
Liability No |
List of liability number |
|
|
|
Industry |
Industries and Unclassified |
New Limit Sanctioned by Industry Secured & Unsecured |
Secured |
New Limit Sanctioned by Industry-Secured |
|
Unsecured |
New Limit Sanctioned by Industry-Unsecured |
The following actions are supported from this screen:
- Refresh - Click this link to refresh the data in the report
- Print - Click this link to print the report
- Export - Click this link to export the report in a different format
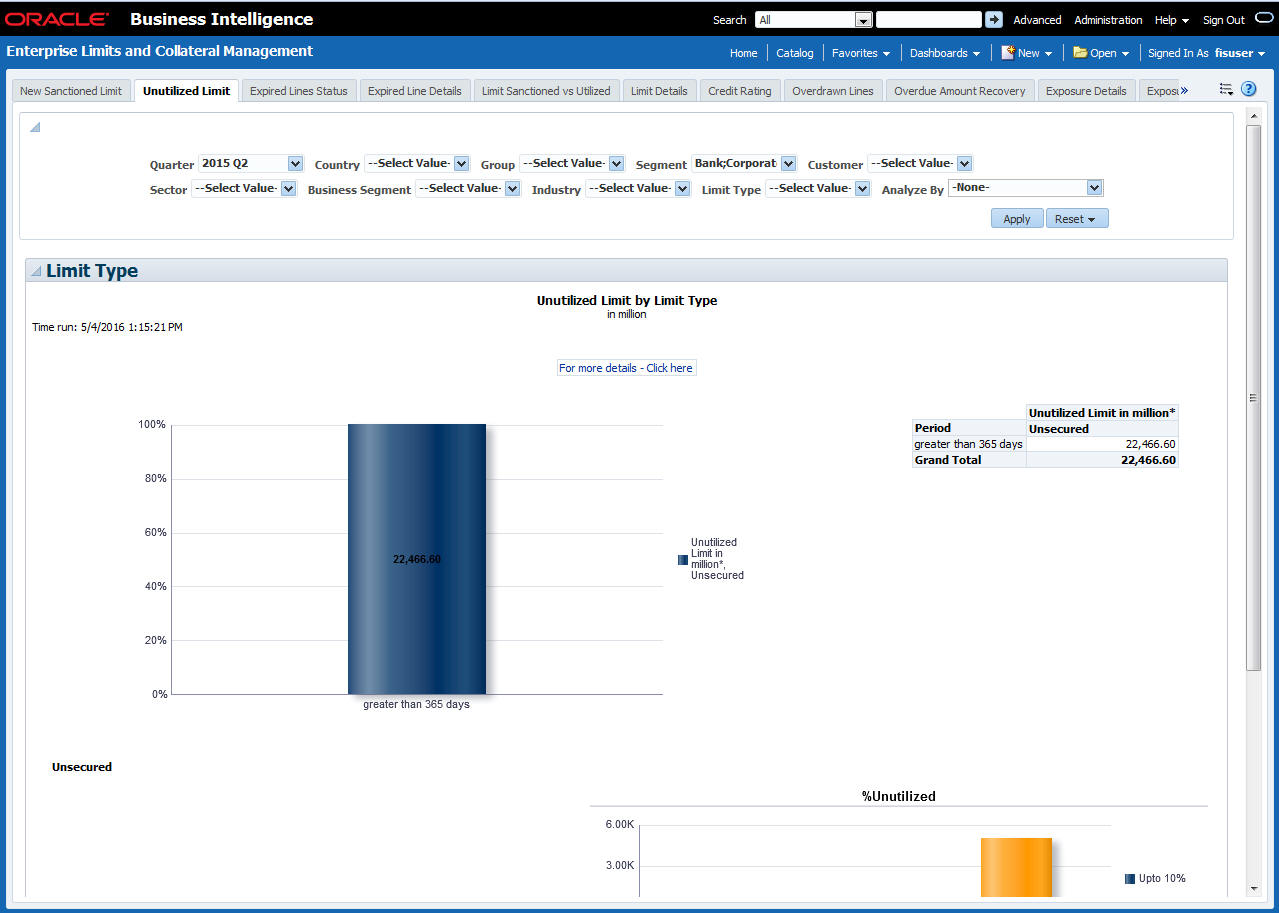
2.5.2 Unutilized Limit
Unutilized limit report shows the details of limits which are not utilized in current quarter:
Analyze By
You can analyse the report by the following parameters.
- Segment
- Country
- Business segment
- Quarter
- Sector
- Limit type
- Group
- Liab Number
- Industry
Select the appropriate dimension from the drop down list and click ‘Apply’ button. The system displays the details of the unutilised limits analysed based on the selected dimension.
You can also filter the reports based on the following parameters:
- Quarter
- Country
- Group
- Segment
- Customer
- Sector
- Business segment
- Industry
- Limit type
- You can drill down to further levels by clicking the respective links,
as illustrated below
Analyze By Report
Drill Down values
Report
Drill Down Values
Report
Segment
Bank
Unutilized Limit by Segment - Bank
Corporate
Unutilized Limit by Segment - Corporate
Group Code and Unclassified
Unutilized Limit by Segment - Corporate - Liability No
Individual
Unutilized Limit by Segment - Individual
Country
Countries of the customers where the limit is utilized.
Business Segment
List of Business Segments and Unclassified
Quarter
NA
Sector
List of Sectors and Unclassified
Limit Type
Secured
Unutilized Limit Secured
Unsecured
Unutilized Limit un secured
Group
Group Codes and Unclassified
Liab No
List of liability number
Industry
Industries and Unclassified
- The following actions are supported from this screen:
- Refresh - Click this link to refresh the data in the report
- Print - Click this link to print the report
- Export - Click this link to export the report in a different format
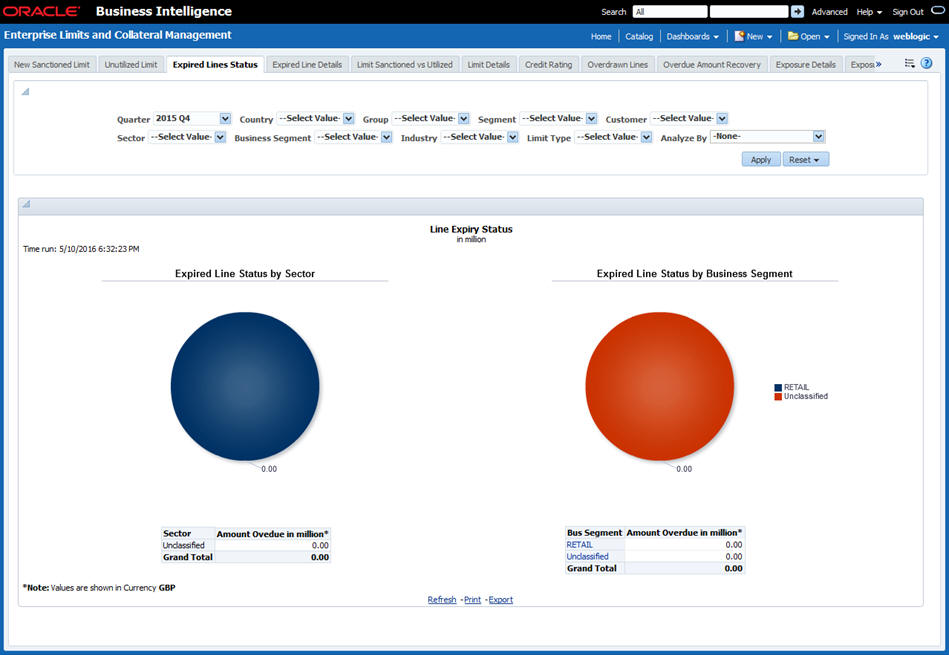
2.5.3 Expired Line Status
This report displays the list of lines which are in expired status, By default it displays the report by sector and Business segment. User can also generate the report as per below mentioned parameters
Analyze By
You can analyse the report by the following parameters.
- Segment
- Country
- Business segment
- Quarter
- Sector
- Limit type
- Group
- Liab Number
- Industry
Select the appropriate dimension from the drop down list and click ‘Apply’ button. The system displays the details of the expired lines analysed based on the selected dimension.
You can also filter the reports based on the following parameters:
- Quarter
- Country
- Group
- Segment
- Customer
- Sector
- Business segment
- Industry
- Limit type
You can drill down to further levels by clicking the respective links, as illustrated below.
Analyze By Report |
Drill Down values |
Report |
Drill Down Values |
Report |
Segment |
Bank |
Line Expired Status by Segment - Bank |
|
|
Corporate |
Line Expired Status by Segment - Corporate |
Group Code and Unclassified |
Line Expired Status by Segment - Corporate - Liability No |
|
Individual |
Line Expired Status by Segment - Individual |
|
|
|
Country |
Countries of the customers that are in expired status |
|
|
|
Business Segment |
List of Business Segments and Unclassified |
Line Expiry Status by Business Segment - Details |
List of Business Segments and Unclassified |
Line Expiry Status by Business Segment - Limit - Details |
Quarter |
NA |
Line Expiry Status by Quarter Details |
|
|
Sector |
List of Sectors and Unclassified |
|
|
|
Limit Type |
NA |
|
|
|
Group |
Group Codes and Unclassified |
|
|
|
Liab No |
List of liability number |
|
|
|
Industry |
Industries and Unclassified |
|
|
|
The following actions are supported from this screen:
- Refresh - Click this link to refresh the data in the report
- Print - Click this link to print the report
- Export - Click this link to export the report in a different format
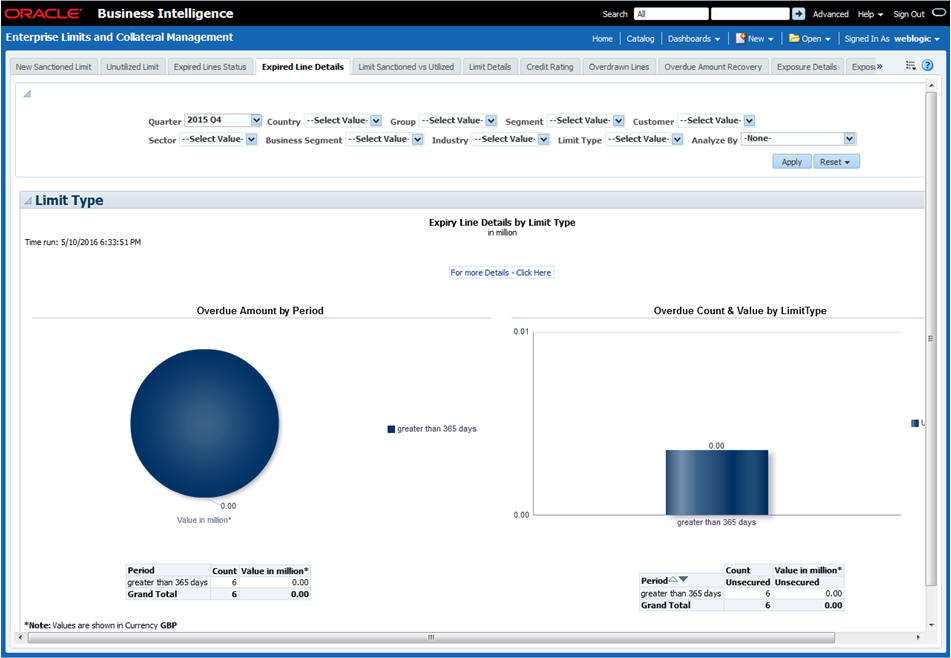
2.5.4 Expired Line Details
Expired line details report shows the list of expired lines, by default system shows the list of Overdue amount by period and Overdue count & value by limit type
Analyze By
You can analyse the report by the following parameters.
- Segment
- Country
- Business segment
- Quarter
- Sector
- Limit type
- Group
- Liab Number
- Industry
Select the appropriate dimension from the drop down list and click ‘Apply’ button. The system displays the details of the expired lines analysed based on the selected dimension.
You can also filter the reports based on the following parameters:
- Quarter
- Country
- Group
- Segment
- Customer
- Sector
- Business segment
- Industry
- Limit type
The following actions are supported from this screen:
- Refresh - Click this link to refresh the data in the report
- Print - Click this link to print the report
- Export - Click this link to export the report in a different format
You can view the following details:
You can drill down to further levels by clicking the respective links, as illustrated below
Analyze By Report |
Drill Down values |
Report |
Segment |
Bank |
Expiry Line Details by Period - Details |
Corporate |
|
|
Individual |
|
|
Country |
Countries of the customers that are in expired Line status |
Expiry Line Details by Period - Details |
Business Segment |
List of Business Segments and Unclassified |
Expiry Line Details by Period - Details |
Quarter |
NA |
Expiry Line Details by Period - Details |
Sector |
List of Sectors and Unclassified |
Expiry Line Details by Period - Details |
Limit Type |
NA |
Expiry Line Details by Period - Details |
Group |
Group Codes and Unclassified |
Expiry Line Details by Period - Details |
Liab No |
List of liability number |
Expiry Line Details by Period - Details |
Industry |
Industries and Unclassified |
Expiry Line Details by Period - Details |
The following actions are supported from this screen:
- Refresh - Click this link to refresh the data in the report
- Print - Click this link to print the report
- Export - Click this link to export the report in a different format
2.5.5 Limits Sanctioned Vs Utilized
This report shows the details by comparing the limit sanctioned with utilized limits:
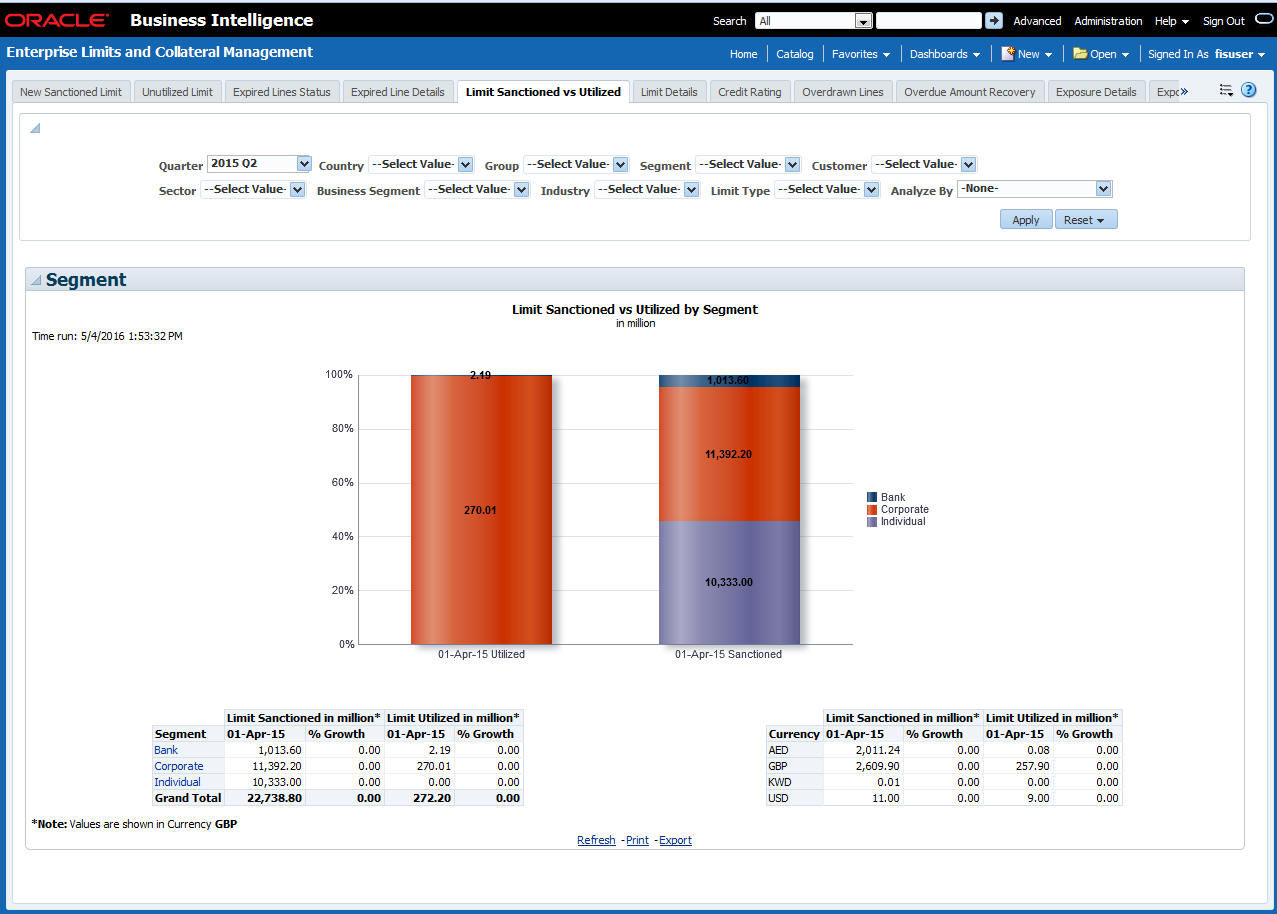
This report shows the details of sanctioned limits and the utilized limits:
Analyze By
You can analyse the report by the following parameters.
- Segment
- Country
- Business segment
- Quarter
- Sector
- Limit type
- Group
- Liab Number
- Industry
Select the appropriate dimension from the drop down list and click ‘Apply’ button. The system displays the details of the sanctioned and utilized limits based on the selected dimension.
You can also filter the reports based on the following parameters:
- Quarter
- Country
- Group
- Segment
- Customer
- Sector
- Business segment
- Industry
- Limit type
You can drill down to further levels by clicking the respective links, as illustrated below.
Analyze By Report |
Drill Down values |
Report |
Drill Down Values |
Report |
Drill Down Values |
Report |
Segment |
Bank |
Segment - Group - Details |
Group Codes and Unclassified |
Segment - Group - Customer Details |
|
|
Corporate |
Segment - Group - Details |
Group Codes and Unclassified |
Segment - Group - Customer Details |
|
|
|
Individual |
Segment - Group - Details |
Group Codes and Unclassified |
Segment - Group - Customer Details |
|
|
|
Country |
Display the country of the customer where Limit is sanctioned and utilized |
|
|
|
|
|
Business Segment |
List of Business Segments and Unclassified |
Business Segment wise Sanc - Utilized Details |
Liab No and Unclassified |
Business Seg wise Sanc - Utilized Details Report |
|
|
Quarter |
NA |
|
|
|
|
|
Sector |
List of Sectors and Unclassified |
Sector - Sanctioned iutilized Limit - Type Details |
List of Sectors and Unclassified |
Sector - Sanctioned Limit - Group - Details |
List of Groups and Unclassified |
Sector - Sanc Limit - Top20 & Others Cust Details |
Limit Type |
Secured |
Sanctioned - utlized Limit- Secured |
|
|
|
|
|
|
|
|
|
||
Unsecured |
Sanctioned -Utilized Limit- Un Secured |
|
|
|
|
|
Group |
Group Codes and Unclassified |
Group - Liability No Details |
|
|
|
|
Liab No |
List of liability number |
|
|
|
|
|
Industry |
List of Industries and Unclassified |
Industry - Sanctioned Limit - Type - Details |
List of Industries and Unclassified |
Industry - Sanctioned Limit - Group - Details |
List of Groups and Unclassified |
Industry - Sanc Limit - Top20 & Others Cust Details |
The following actions are supported from this screen:
- Refresh - Click this link to refresh the data in the report
- Print - Click this link to print the report
- Export - Click this link to export the report in a different format
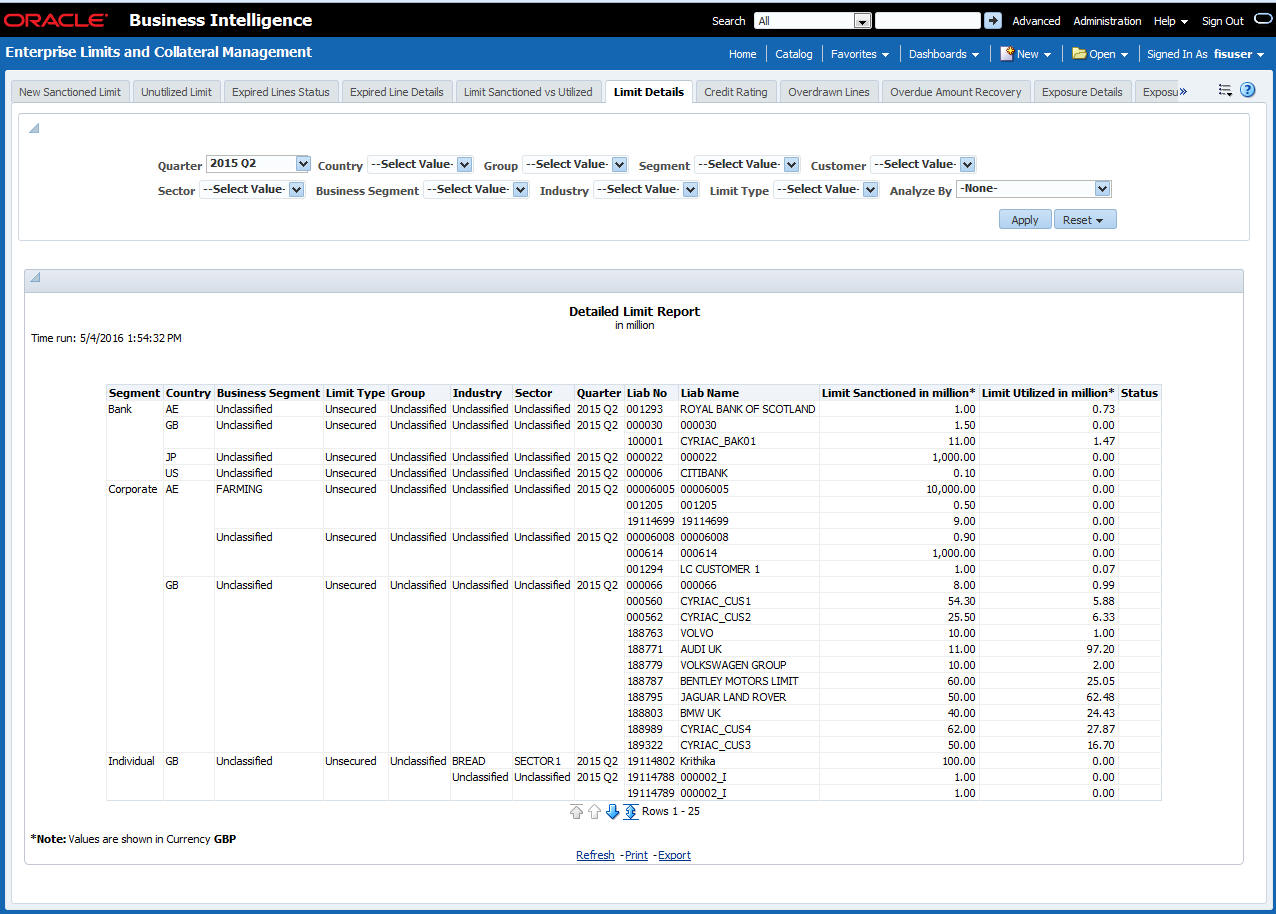
2.5.6 Limit Details
Limit details report shows the details of limits maintained in the system. This report is displayed in table format.
Analyze By
You can analyse the report by the following parameters.
- Segment
- Country
- Business segment
- Quarter
- Sector
- Limit type
- Group
- Liab Number
- Industry
Select the appropriate dimension from the drop down list and click ‘Apply’ button. The system displays the details of limits based on the selected dimension.
You can also filter the reports based on the following parameters:
- Quarter
- Country
- Group
- Segment
- Customer
- Sector
- Business segment
- Industry
- Limit type
The following actions are supported from this screen:
- Refresh - Click this link to refresh the data in the report
- Print - Click this link to print the report
- Export - Click this link to export the report in a different format
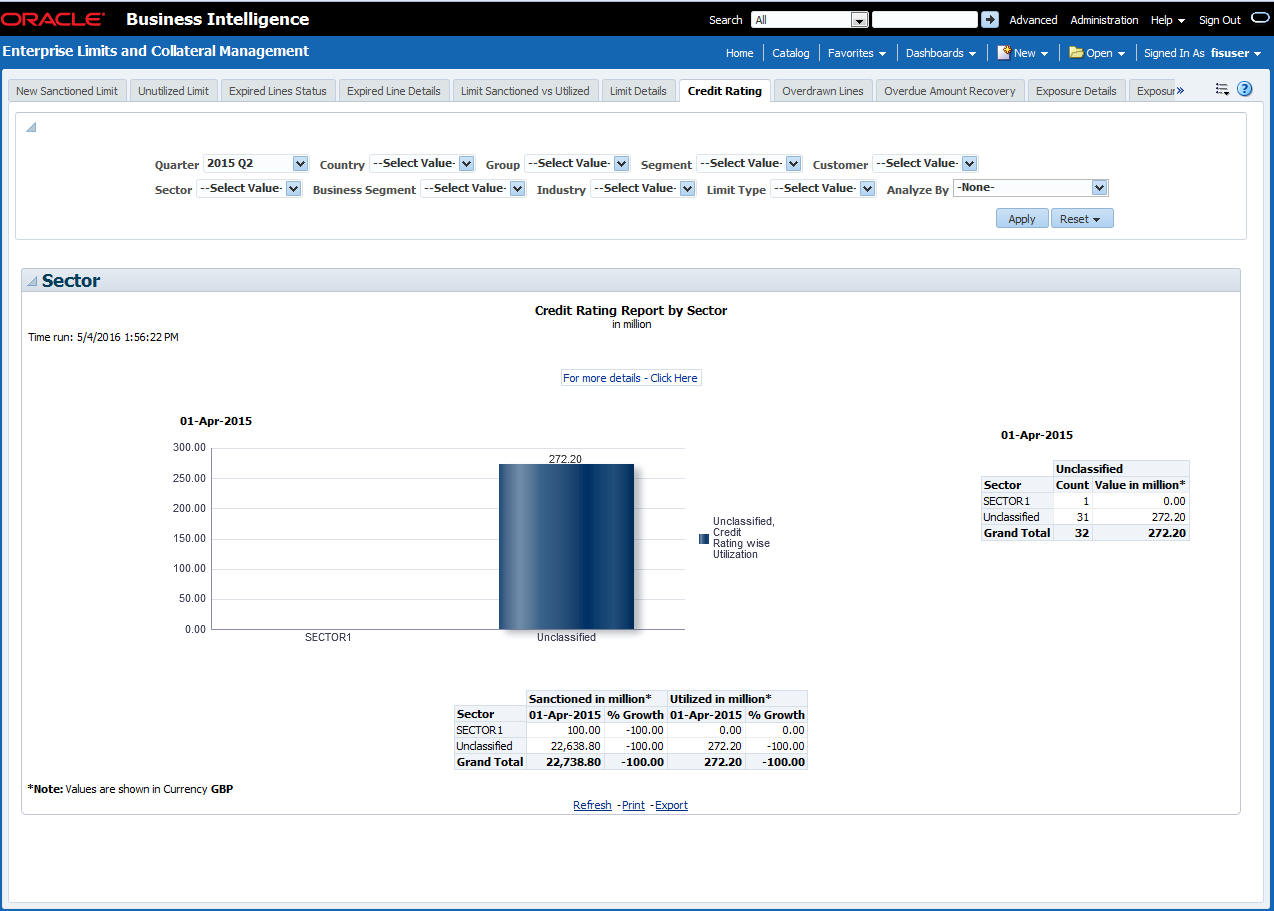
2.5.7 Credit Rating
Credit rating report shows the details of credits provided to various sectors classified based on the credit rating.
Analyze By
You can analyse the report by the following parameters.
- Segment
- Country
- Business segment
- Quarter
- Sector
- Limit type
- Group
- Liab Number
- Industry
Select the appropriate dimension from the drop down list and click ‘Apply’ button. The system displays the details of the credit ratings based on the selected dimension.
You can also filter the reports based on the following parameters:
- Quarter
- Country
- Group
- Segment
- Customer
- Sector
- Business segment
- Industry
- Limit type
You can drill down to further levels by clicking the respective links, as illustrated below..The following actions are supported from this screen:
Analyze By Report |
Drill Down values |
Report |
Segment |
Bank |
Credit Rating wise Utilization Report |
|
Corporate |
|
|
Individual |
|
Country |
Display the country of the customer where credit rating was performed. |
|
Business Segment |
List of Business Segments and Unclassified |
Credit Rating wise Utilization Report |
Quarter |
NA |
Credit Rating wise Utilization Report |
Sector |
List of Sectors and Unclassified |
Credit Rating wise Utilization Report |
Limit Type |
NA |
Credit Rating wise Utilization Report |
Group |
Group Codes and Unclassified |
Credit Rating wise Utilization Report |
Liab No |
List of liability number |
Credit Rating wise Utilization Report |
Industry |
Industries and Unclassified |
|
- Refresh - Click this link to refresh the data in the report
- Print - Click this link to print the report
- Export - Click this link to export the report in a different format
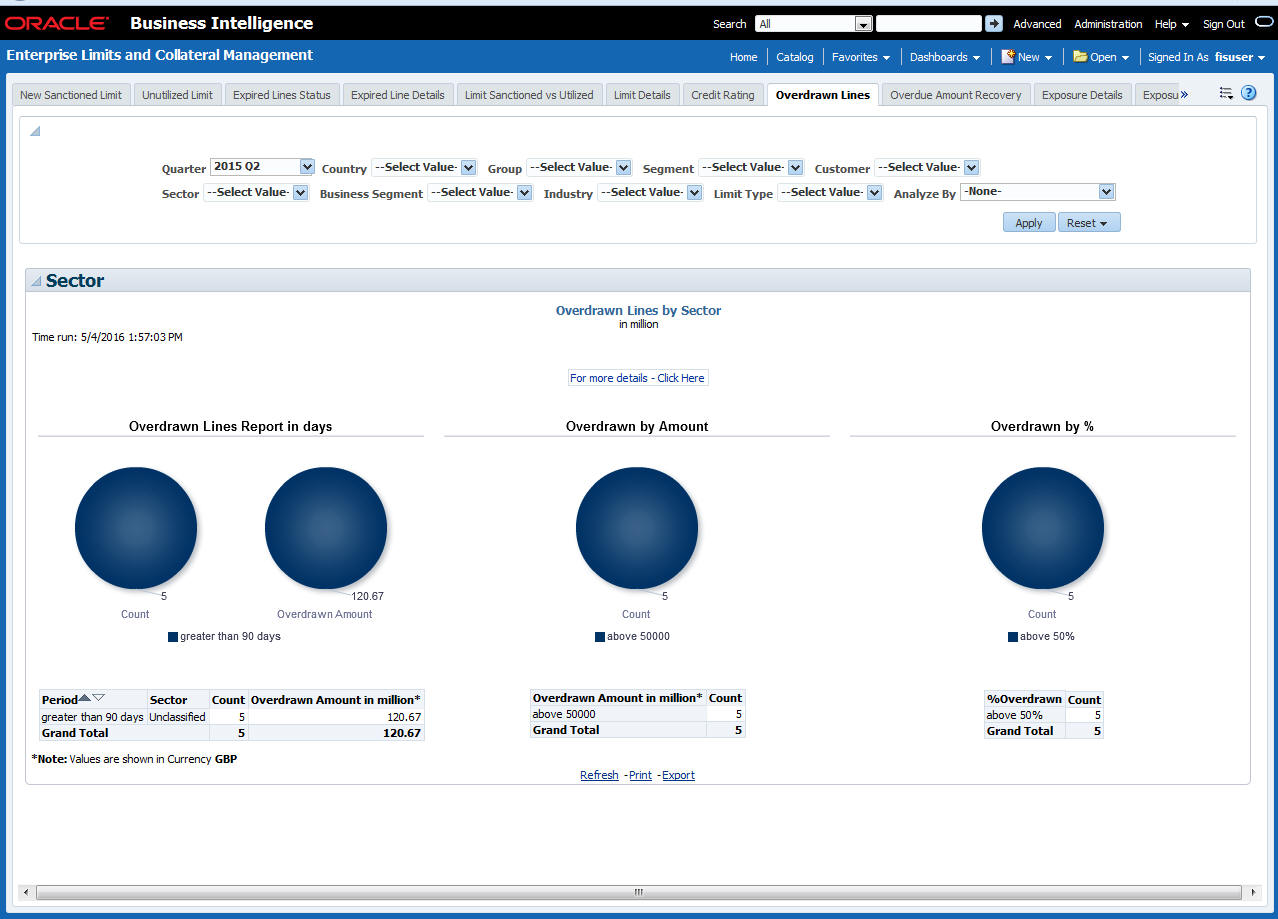
2.5.8 Overdrawn Lines
This report shows the details of overdrawn lines.
Analyze By
You can analyse the report by the following parameters.
- Segment
- Country
- Business segment
- Quarter
- Sector
- Limit type
- Group
- Liab Number
- Industry
Select the appropriate dimension from the drop down list and click ‘Apply’ button. The system displays the details of the overdrawn lines based on the selected dimension.
You can also filter the reports based on the following parameters:
- Quarter
- Country
- Group
- Segment
- Customer
- Sector
- Business segment
- Industry
- Limit type
You can drill down to further levels by clicking the respective links, as illustrated below.
The following actions are supported from this screen:
- Refresh - Click this link to refresh the data in the report
- Print - Click this link to print the report
- Export - Click this link to export the report in a different format
2.5.9 Overdue Amount Recovery
This report displays the details of overdue amounts and the recovery status
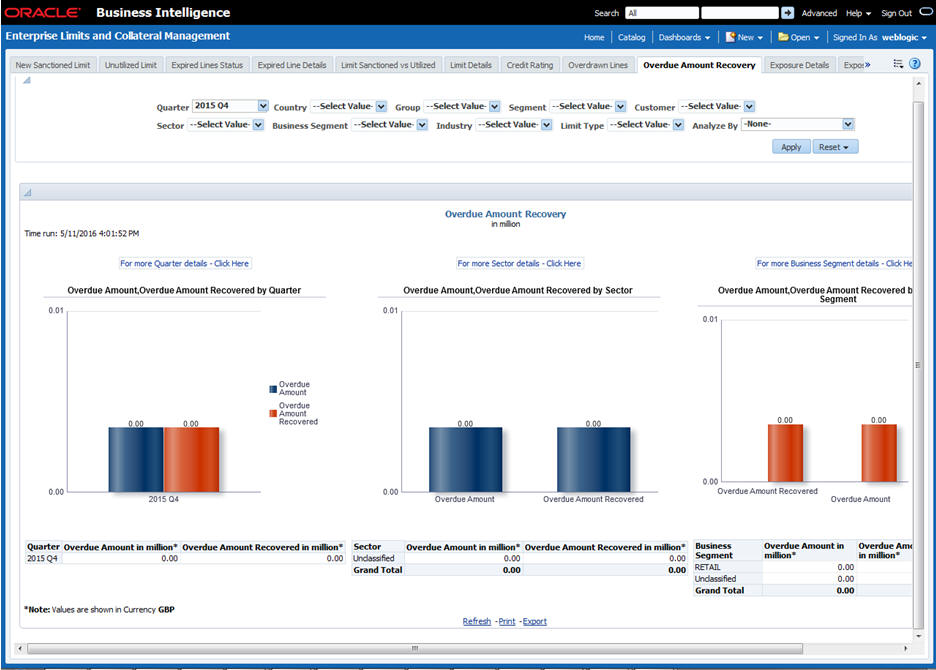
Analyze By
You can analyse the report by the following parameters.
- Segment
- Country
- Business segment
- Quarter
- Sector
- Limit type
- Group
- Liab Number
- Industry
Select the appropriate dimension from the drop down list and click ‘Apply’ button. The system displays the recovery details of the overdue amount based on the selected dimension.
You can also filter the reports based on the following parameters:
- Quarter
- Country
- Group
- Segment
- Customer
- Sector
- Business segment
- Industry
- Limit type
You can drill down to further levels by clicking the respective links, as illustrated below.
Analyze By Report |
Drill Down values |
Report |
Segment |
Bank |
Overdue Amount Recovery Details |
Corporate |
|
|
Individual |
|
|
Country |
Display the country of the customer overdue details are maintained. |
Overdue Amount Recovery Details |
Business Segment |
List of Business Segments and Unclassified |
Overdue Amount Recovery by Business Segment Details |
Quarter |
List of quarters |
Overdue Amount Recovery by Quarter Details |
Sector |
List of Sectors and Unclassified |
Overdue Amount Recovery by Sector Details |
Limit Type |
NA |
Overdue Amount Recovery Details |
Group |
Group Codes and Unclassified
|
Overdue Amount Recovery Details |
Liab No |
List of liability number
|
Overdue Amount Recovery Details |
Industry |
Industries and Unclassified |
Overdue Amount Recovery Details |
The following actions are supported from this screen:
- Refresh - Click this link to refresh the data in the report
- Print - Click this link to print the report
- Export - Click this link to export the report in a different format
2.5.10 Exposure Details
This report displays the details of exposure.
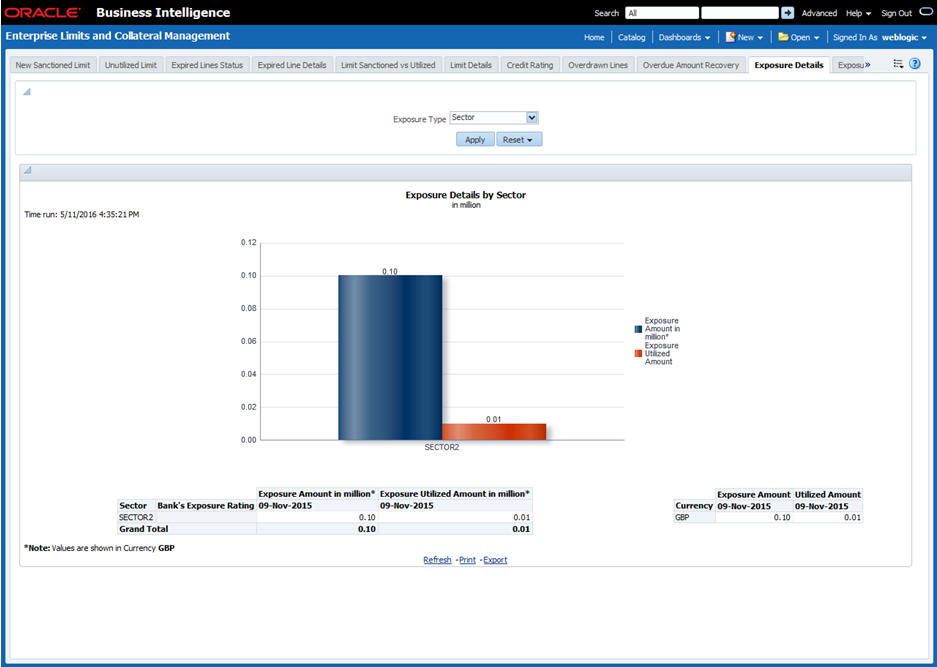
You can view this report for the following exposure types:
- Sector
- Currency
- Country
The following actions are supported from this screen:
- Refresh - Click this link to refresh the data in the report
- Print - Click this link to print the report
- Export - Click this link to export the report in a different format
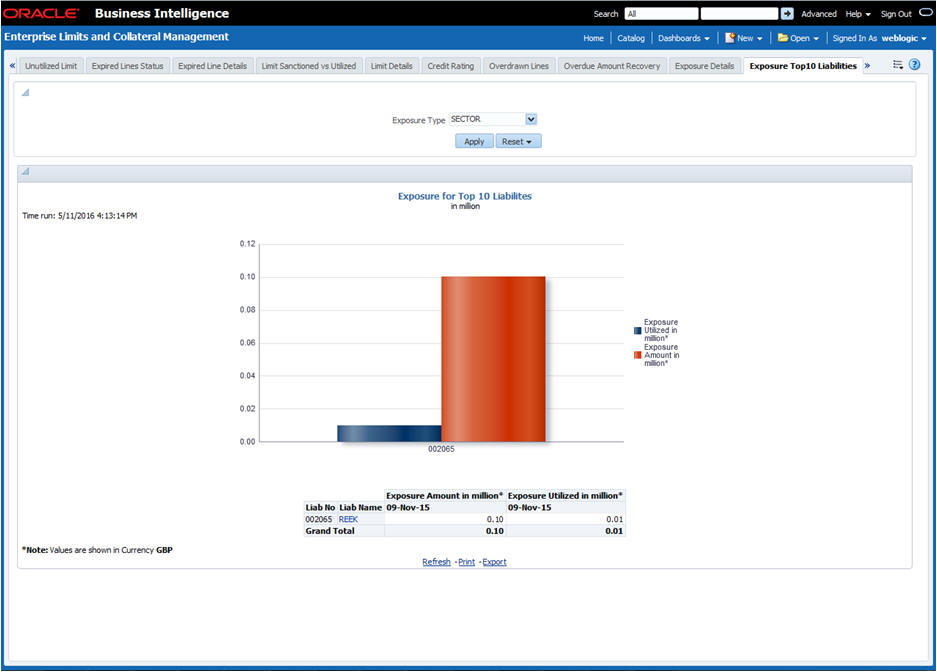
2.5.11 Exposure Top 10 Liabilities
This report shows the exposure details for the top ten liabilities in the system
The following actions are supported from this screen:
- Refresh - Click this link to refresh the data in the report
- Print - Click this link to print the report
- Export - Click this link to export the report in a different format
2.6 Islamic Bank Scorecard
This section contains the following topics:
- Section 2.6.1, "Profit Earned and Profit Paid"
- Section 2.6.2, "Profit Paid"
- Section 2.6.3, "Profit Earned"
2.6.1 Profit Earned and Profit Paid
This report shows the profit earned and the profit paid for all Islamic loan accounts (active or liquidated) and accounts (open or closed) across quarters. Accruals are considered for this profit calculation. However, Nostro and Vostro accounts are not included. Select the year quarter and click ‘Apply’ button.
Note
Islamic Bank Scorecard will be deployed for Islamic Sites.
The generated report is as follows:
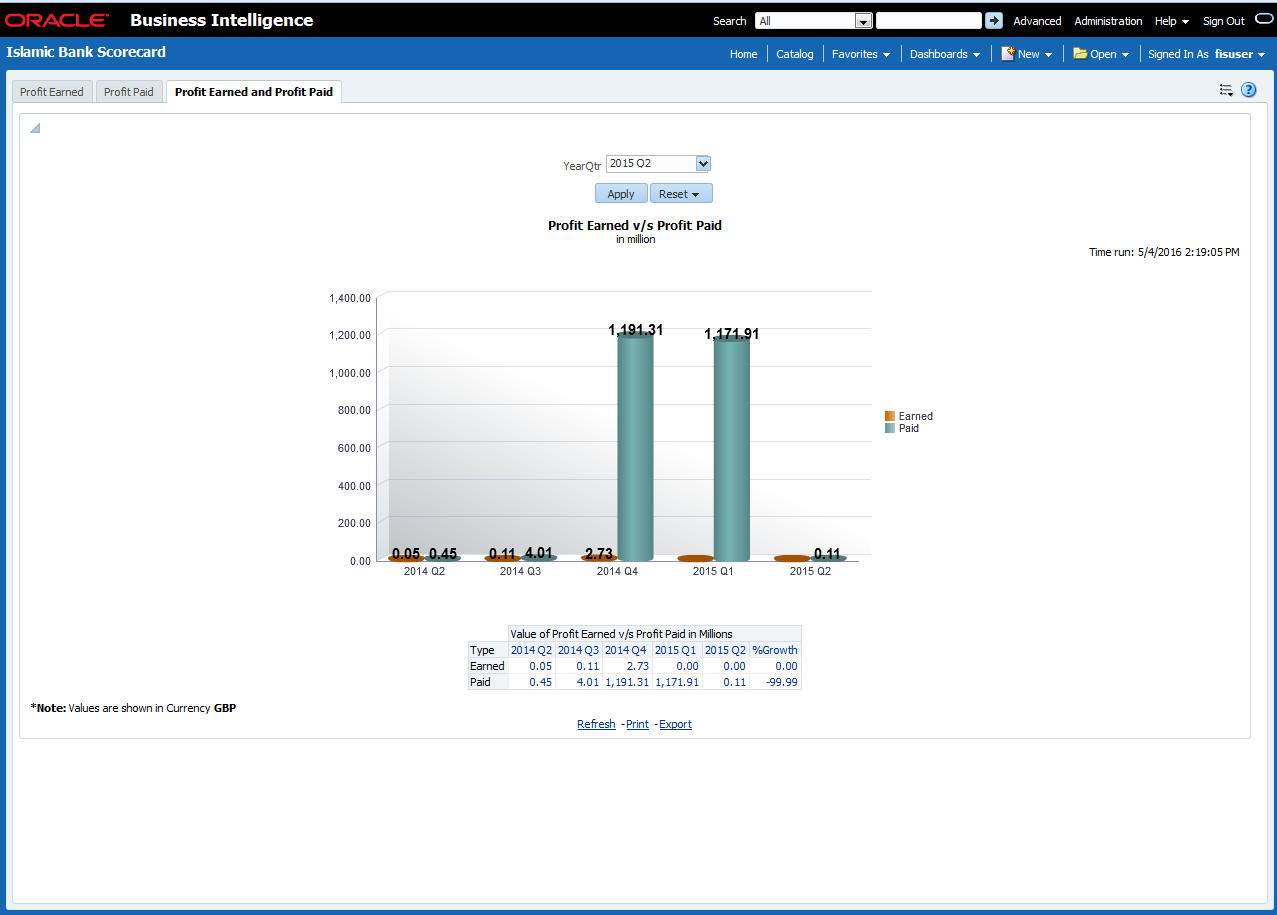
You can view the following details:
- Profit Earned and Profit Paid in Millions
- Profit earned for the selected quarter and four previous quarters and growth percentage
- Profit paid for the selected quarter and four previous quarters and growth percentage
- You can select the report based on the module from the ‘Module’ filter
The following actions are supported from this screen:
- Refresh - Click this link to refresh the data in the report
- Print - Click this link to print the report
- Export - Click this link to export the report in a different format
2.6.2 Profit Paid
This report shows the profit amount paid by the bank across account types for each quarter. Accruals are considered for these profit calculations. The generated report is as follows:
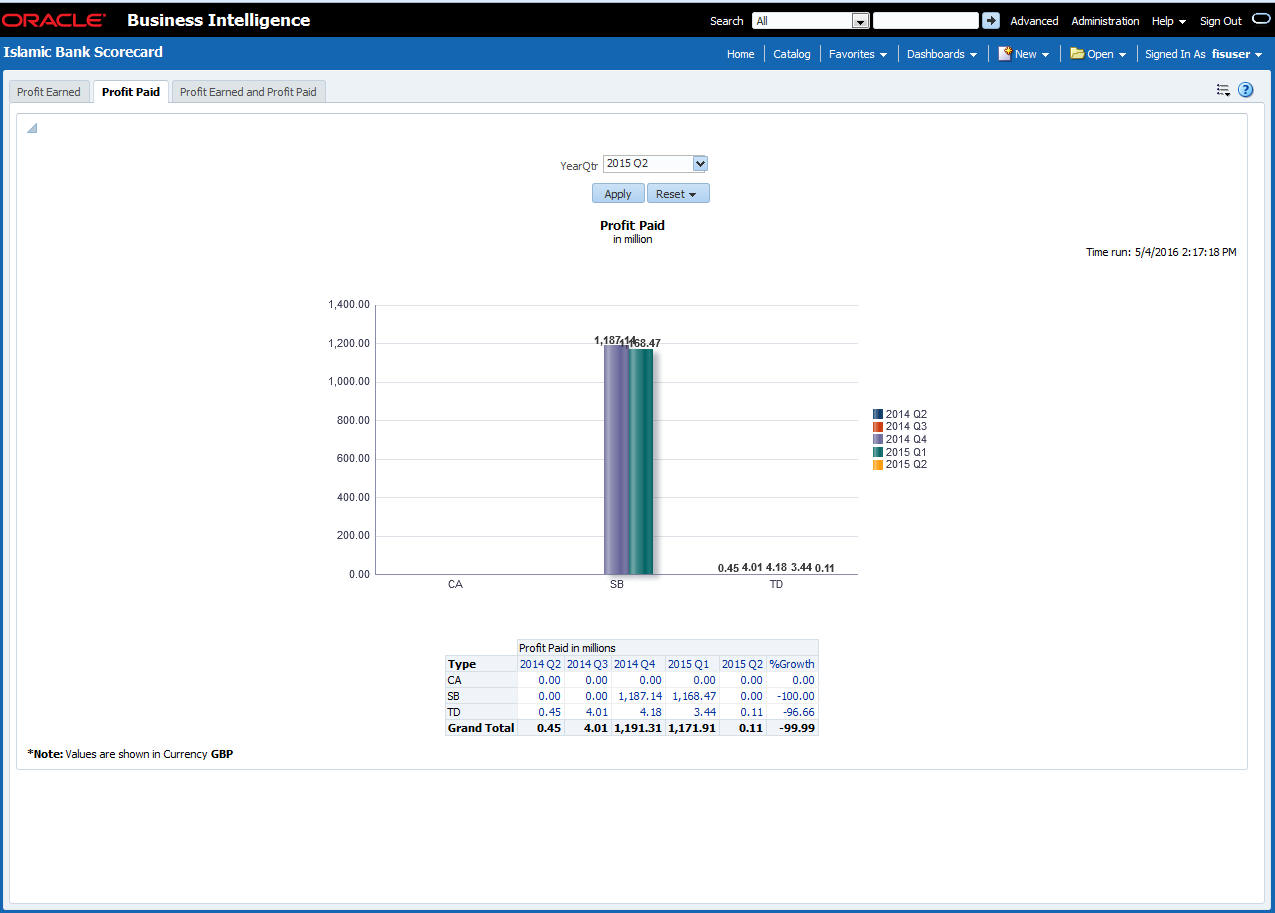
You can view the following details:
- Value of Profit Earned in Millions
- Profit paid in millions for the selected quarter and four previous quarters and growth percentage for account types
- Profit paid for the selected quarter and four previous quarters and growth percentage for account types
- Profit paid for the selected quarter and four previous quarters and growth percentage for account types
The following actions are supported from this screen:
- Refresh - Click this link to refresh the data in the report
- Print - Click this link to print the report
- Export - Click this link to export the report in a different format
2.6.3 Profit Earned
This report shows the profit earned across Islamic loan types for each quarter.
Note
Loan Type value will be defaulted to Loan Product Category.
The generated report is as follows:
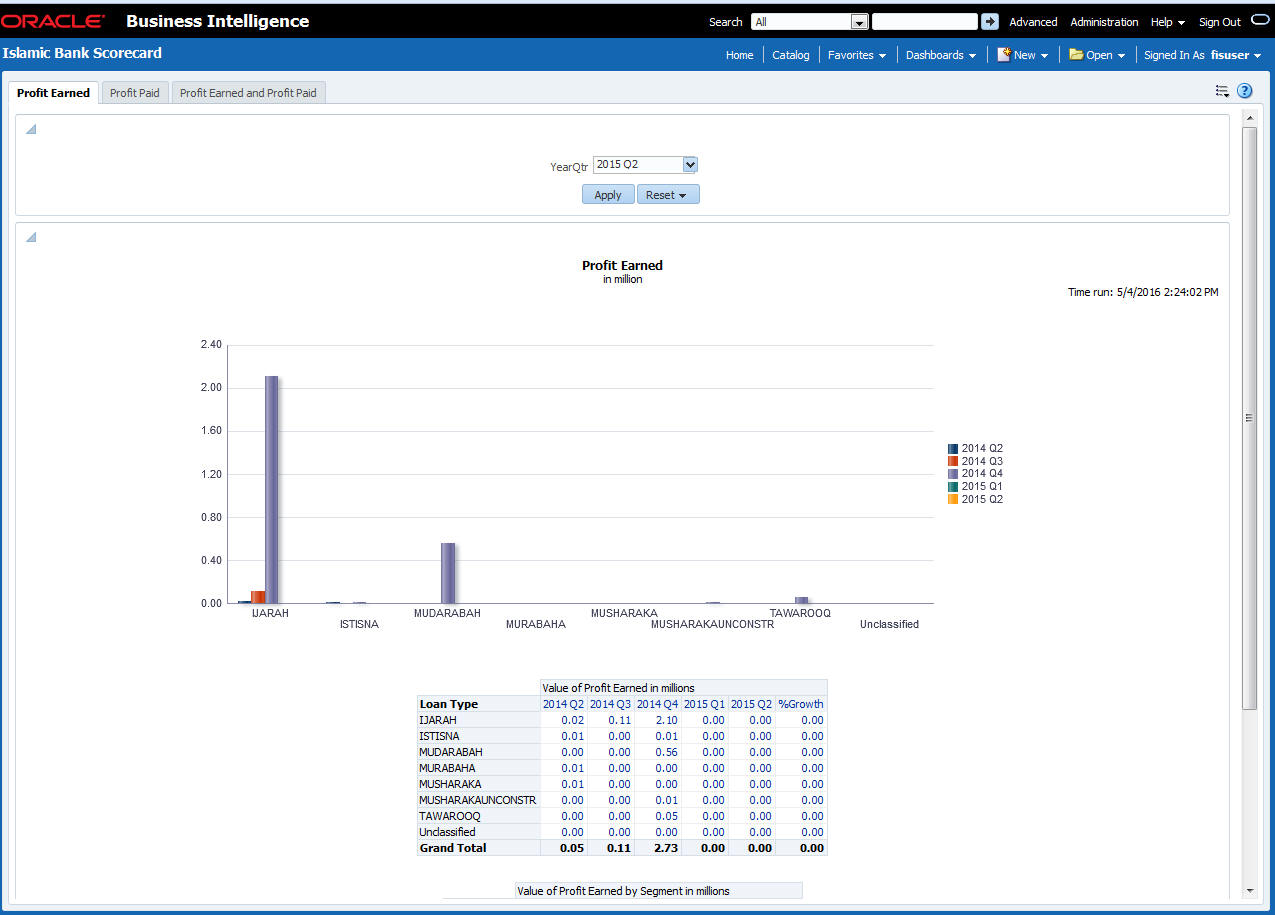
You can view the following details:
- Value of Profit Earned in Millions
- Profit earned for the selected quarter and four previous quarters and growth percentage for loan types
- Value of Profit Earned by Segment in Millions
- Profit earned for the selected quarter and four previous quarters and growth percentage for segments
- You can select the report based on the module from the ‘Module’ filter
The following actions are supported from this screen:
- Refresh - Click this link to refresh the data in the report
- Print - Click this link to print the report
- Export - Click this link to export the report in a different format
2.7 Dynamic Reports
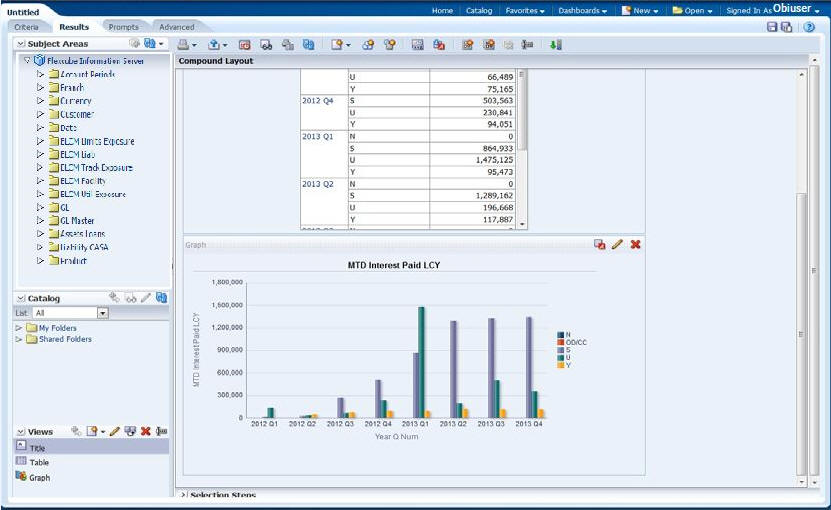
You can create dynamic reports using the Oracle FLEXCUBE Information Server RPD. In order to start with creation of a dynamic report, login to OBIEE system.
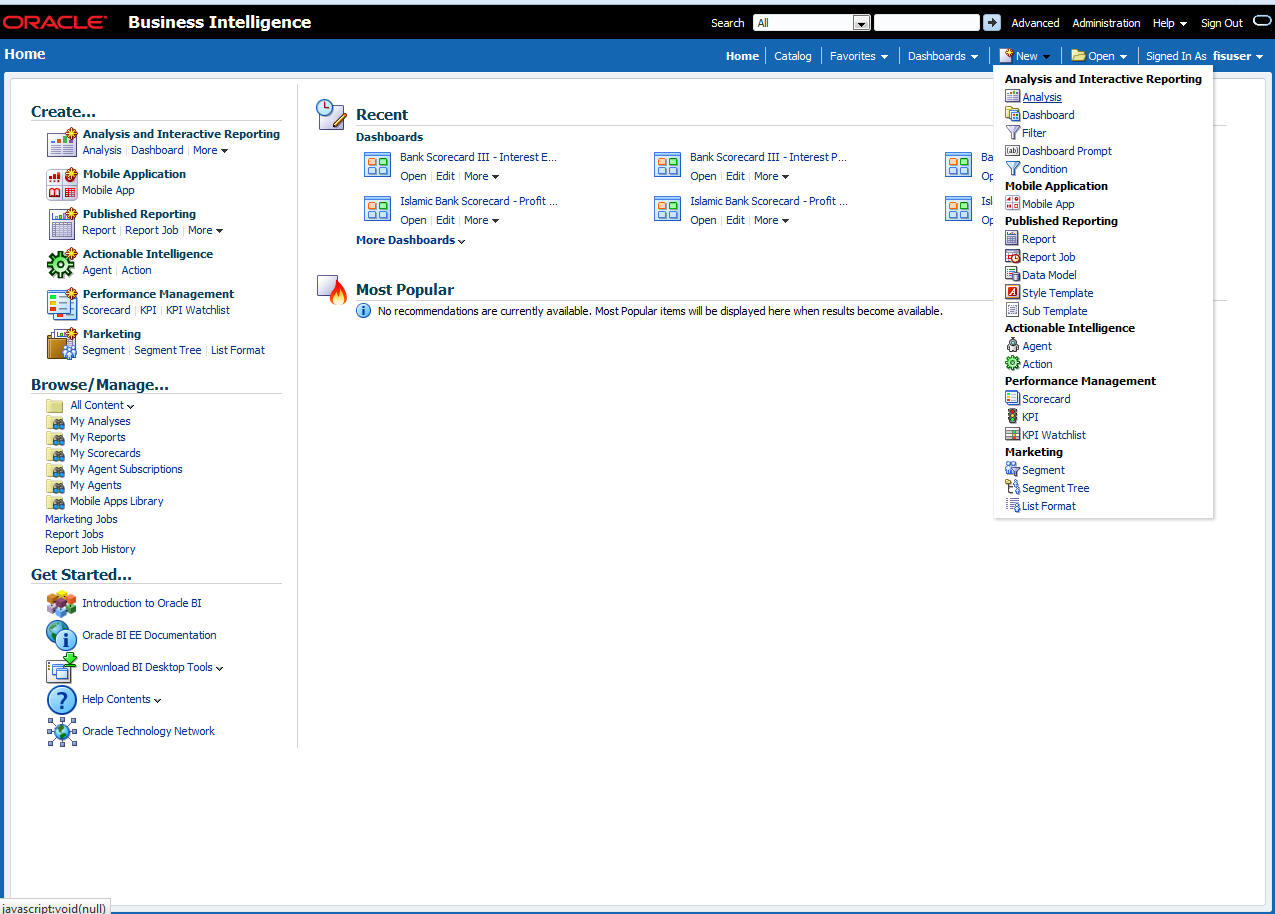
Click ‘New’ on the toolbar and select ‘Analysis’. You will be prompted to select the Subject Area.
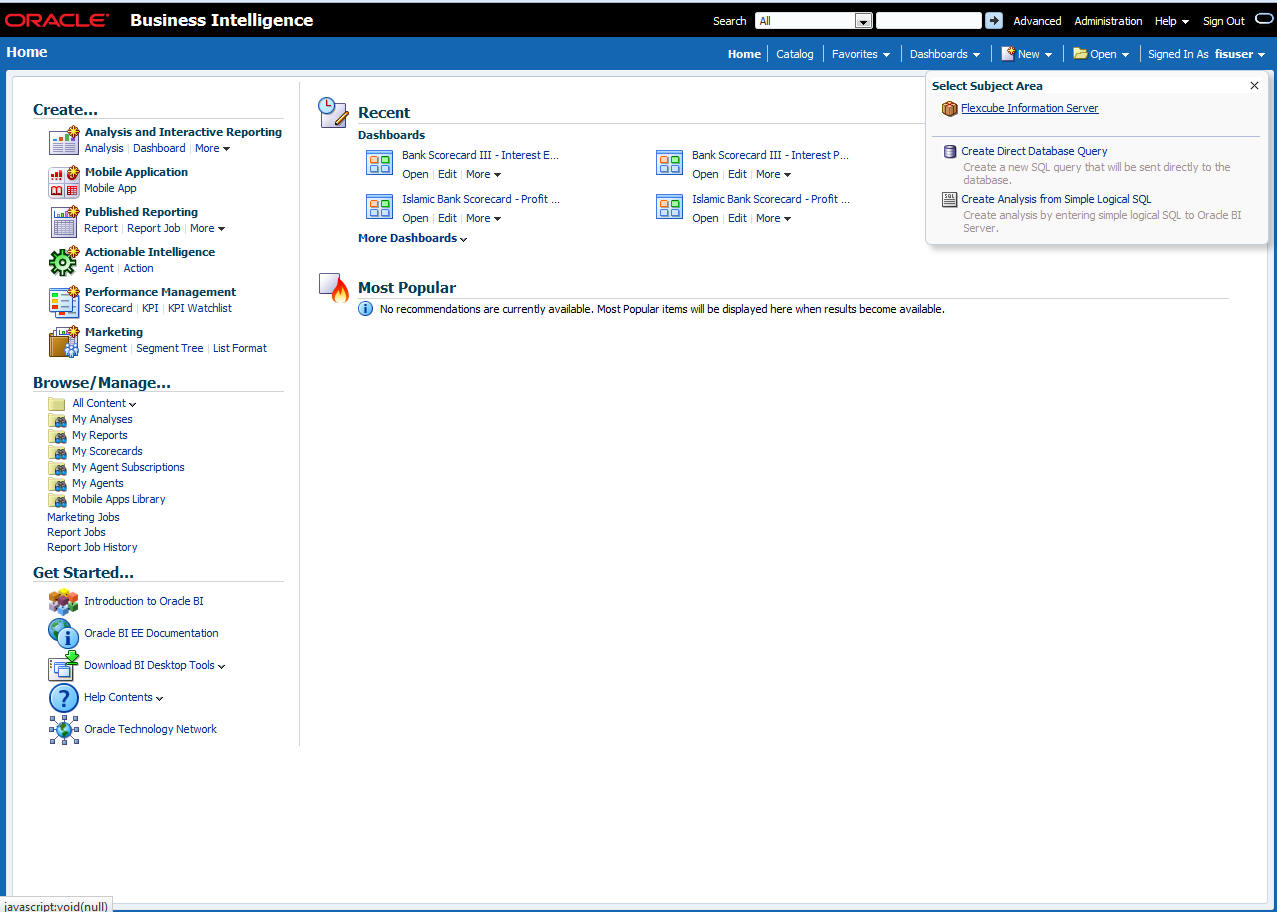
Select ‘FLEXCUBE Information Server’ from the list.
Navigate to ‘Criteria’ tab.
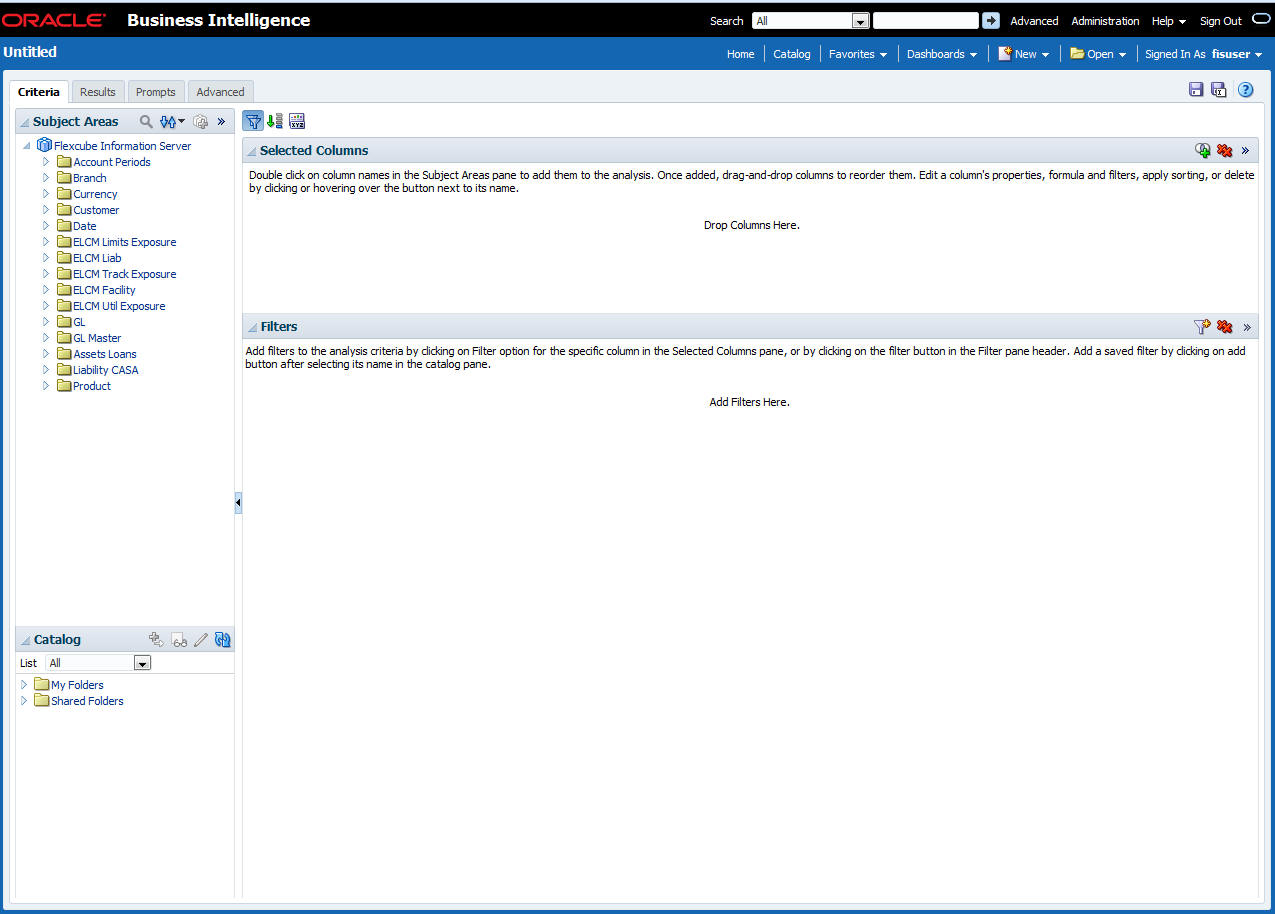
On the left pane, expand the ‘FLEXCUBE Information Server’ subject area. You can find the following folders.
Folder |
Data Type |
Description |
Account Periods |
Dimensional data |
Displays the accounting periods maintained for the bank |
Branch |
Dimensional data |
Displays all the branches maintained for the bank |
Currency |
Dimensional data |
Displays all the currencies maintained for the bank |
Customer |
Dimensional data |
Displays all the customers maintained for the bank. |
Date |
Dimensional data |
Displays all the dates from the start of accounting period to the end of accounting period |
ELCM Limits Exposure |
Dimensional Data |
Displays limits exposure details maintained for the bank |
ELCM Liab |
Dimensional Data |
Displays all the liabilities maintained for the bank |
ELCM Track Exposure |
Fact Data |
Displays tracking details for exposure maintained for the bank |
ELCM Facility |
Fact Data |
Displays facility details maintained for the bank |
ELCM Util Exposure |
Fact Data |
Displays utilization and exposure details |
GL |
Fact data |
This displays the general ledger balances available in the system |
GL Master |
Dimensional data |
Displays all the general ledgers that are maintained in the system |
Asset Loans |
Fact data |
Displays all the assets of the bank, i.e. loans and overdrafts with negative balance |
Liability CASA |
Fact data |
Displays the liabilities of the bank, i.e. the current and saving accounts Overdraft accounts with positive balance are displayed here |
Product |
Dimensional data |
Displays all the products that are maintained in the system |
The subject areas and their descriptions are available in the following table:
Folder |
Field |
Description |
Account Periods |
Period Code |
Code that identifies the period |
|
Branch Code |
Branch code |
|
Start Date |
Start date of the account period |
|
End Date |
End date of the account period |
|
Financial Cycle |
Financial cycle |
|
Year |
Year of the account period |
|
Half |
Half year of the account period |
|
Quarter |
Quarter of the year of account period |
|
Month |
Month of the period code |
Branch |
Branch Code |
Branch code |
|
Branch Name |
Name of the branch |
|
Branch Address 1 |
First line of the branch address |
|
Branch Address 2 |
Second line of the branch address |
|
Branch Address 3 |
Third line of the branch address |
|
Branch LCY |
Local currency of the branch |
|
Closure Date |
Date of closure of the branch |
|
Country Code |
Country code |
|
Parent Code |
Parent branch code |
|
Parent Name |
Parent branch name |
|
Regional Office Code |
Regional office code |
|
Regional Office Name |
Name of the regional office |
Currency |
Currency Code |
Currency code |
|
Currency Description |
Currency description |
Customer |
Customer No |
Customer number |
|
Customer Name |
Name of the customer |
|
Short Name |
Short name of the customer |
|
Creation Date |
Date of customer creation |
|
Local Branch |
Local branch of the customer |
|
Customer type |
Type of customer |
|
Customer Status |
Status of the customer. ‘O’ indicates ‘Open’ and ‘C’ indicates ‘Closed’. |
|
Customer Category |
Category to which the customer belong |
|
Customer Classification |
Classification of the customer |
|
Customer Segment |
Segment of the customer |
|
Sex |
Gender of the customer |
|
Date of Birth |
Date of birth of the customer |
|
Deceased |
Whether the customer is deceased or not |
|
Frozen |
Whether the customer details are frozen or not |
|
Language |
Language of the customer |
|
Country |
Country to which the customer belongs |
|
Nationality |
Nationality of the customer |
|
Whereabouts Unknown |
Whether the whereabouts of the customer is known or not |
|
Address Line 1 |
First line of the customer’s address |
|
Address Line 2 |
Second line of the customer’s address |
|
Address Line 3 |
Third line of the customer’s address |
|
Address Line 4 |
Fourth line of the customer’s address |
|
Credit Rating |
Credit rating of the customer |
|
Business Segment Code |
Business Segment Code of the customer |
|
Industry Code |
Industry Code of the customer |
|
Sector Code |
Sector Code of the customer |
|
Group Code |
Group Code of the customer |
|
Exposure Country |
Exposure Country of the customer |
Date |
Calendar Date |
Calendar date, all dates from the start and end of accounting periods are available |
Is Last Qtrday |
The last working day of the quarter |
|
Is Last Monthday |
The last working day of the month |
|
Half Year |
Denotes whether it is the first half/second half of the financial year |
|
Week Day |
Shows whether the day is a weekday/weekend |
|
Year Number |
The year of the selected calendar date |
|
Year Q Num |
The quarter of the year of the selected calendar date |
|
Quarter Name |
The name of the quarter, i.e. Q1, Q2, Q3 or Q4 |
|
Quarter Number |
The quarter number of the calendar date, i.e. 1, 2, 3 or 4 |
|
Month Name |
The name of the month |
|
Month Number |
The number that represents the month based on the financial year. Q1 will have 1, 2, 3 or 4, Q2 will have 4, 5, 6 or 7 and so on. |
|
Day Weekname |
The name of the day of the calendar date, i.e. Monday, Tuesday etc. |
|
ELCM Limits Exposure
|
End Date |
The calendar date in Yyyymm format |
Exposure ID |
Exposure ID |
|
Exposure Name |
Exposure Name |
|
Exposure Rating |
Exposure Rating |
|
Exposure Type |
Exposure Type |
|
Start Date |
Start Date |
|
Utilization Type |
Type of Utilization |
|
Valid Flag |
Valid flag for validation |
|
Exposure Code |
Exposure Code |
|
ELCM Liab |
Liab Branch |
Liability Branch Code |
Liab Ccy |
Liability Currency Code |
|
Liab Name |
Liability Name |
|
Liab No |
Liability Number |
|
Valid Flag |
For validation |
|
Main Liab ID |
Main Liability ID |
|
ELCM Track Exposure |
Exposure Currency |
Exposure Currency |
Exposure ID |
Exposure ID |
|
MIS Date |
MIS Date |
|
Available Amount FCY |
Amount Available in Foreign Currency |
|
Available Amount LCY |
Amount Available in Local Currency |
|
Exposure Amount FCY |
Exposure Amount in Foreign Currency |
|
Exposure Amount LCY |
Exposure Amount in Local Currency |
|
Utilisation FCY |
Utilisation Amount in Foreign Currency |
|
Utilisation LCY |
Utilisation Amount in Local Currency |
|
ELCM Facility |
Currency |
Currency Code |
|
Facility ID |
ID of each facility |
|
Limit Type |
Type of limit; Secured or unsecured |
|
Main Liab ID |
Main Liability ID |
|
Liability Number |
Liability Number |
|
Line Code |
Identifier for the line |
|
Limit Sanctioned Date |
Date on which limit is sanctioned |
|
Limit Sanctioned FCY |
Limit sanctioned in foreign currency |
|
Limit Sanctioned LCY |
Limit sanctioned in local currency |
|
Limit Utilized FCY |
Limit utilized in foreign currency |
|
Limit Utilized LCY |
Limit utilized in local currency |
|
Line Amount Recovered FCY |
Amount recovered in foreign currency |
|
Line Amount Recovered LCY |
Amount recovered in local currency |
|
Line Exp Amount FCY |
Expired amount in foreign currency |
|
Line Exp Amount LCY |
Expired amount in local currency |
|
Line Expiry Date |
Date on which line is expired |
|
Matured Util Amount |
Utilized amount matured |
|
Mis Date |
Business Date |
|
Module |
Module |
|
New Liab Qtr |
Flag for the new liability in the quarter |
|
Overdrawn Amount Fcy |
Amount overdrawn in foreign currency |
|
Overdrawn Amount LCY |
Amount overdrawn in local currency |
|
Overdrawn Date |
Date on which amount is overdrawn |
|
Recovery Date |
Date on which amount is recovered |
|
Revolving Line |
Flag to indicate that the line is Revolving |
|
Util Date |
Date on which amount is utilized |
|
Status |
Line status |
|
Unutilized Limit LCY |
Amount not utilized in local currency |
|
% Unutilized |
Percentage of unutilization |
|
Prev Recovery Amount LCY |
Amount recovered on previous date in local currency |
ELCM Util Exposure |
Available Amount FCY |
Available amount in foreign currency |
|
Available Amount LCY |
Available amount in local currency |
|
Exposure Amount FCY |
Exposure amount in foreign currency |
|
Exposure Amount LCY |
Exposure amount in local currency |
|
Exposure ID |
Exposure ID |
|
Utilization FCY |
Utilization in foreign currency |
|
Utilization LCY |
Utilization in local currency |
|
Exch Rate |
Exchange rate |
|
Exp Ccy |
Exposure currency |
|
Liab ID |
Liability ID
|
|
Main Liab ID |
Main Liability ID |
|
Util Amt |
Utilization Amount |
|
Util Ccy |
Utilization Currency |
|
Util ID |
Utilization ID |
|
Liab Name |
Liability Name |
|
Liab No |
Liability Number |
|
Exp Util Fcy |
Exposure utilized in foreign currency |
|
Exp Util Lcy |
Exposure utilized in local currency |
|
Mis Date |
Business Date |
|
Cparty Appetite FCY |
Counterparty appetite in foreign currency |
|
Cparty Appetite LCY |
Counterparty appetite in local currency |
GL
|
Account Period Key |
Account Period Key |
|
ACY Today Turn Over Credit |
Today’s credit turnover in account currency |
|
ACY Today Turn Over Debit |
Today’s debit turnover in account currency |
|
Branch Code |
Branch code |
|
Branch Key |
Branch Key |
|
Credit balance |
Credit balance |
|
Credit Balance LCY |
Credit balance in local currency |
|
Currency |
Currency code |
|
Currency Key |
Currency Key |
|
Date Key |
Date key |
|
Debit Balance |
Debit balance |
|
Debit Balance LCY |
Debit balance in local currency |
|
Fct GI Key |
Fct GI Key |
|
Fin Year |
Financial year |
|
GL Code |
General ledger code |
|
GL Key |
General Ledger Key |
|
LCY Today Turn Over Credit |
Today’s credit turnover in local currency |
|
LCY Today Turn Over Debit |
Today’s debit turnover in local currency |
|
MIS Date |
The Oracle FLEXCUBE system date on which GL balance information was extracted |
|
Period Code |
Period code |
|
Asset/Liability Balance |
Balance in asset or liability |
GL Master |
Category |
The category of the GL |
|
GL Code |
The general ledger code |
|
GL Description |
The description of the general ledger |
|
GL Key |
General Ledger Key |
|
Leaf |
GL that reports to a node GL and is not reported by any other GL |
|
Parent GL |
The parent GL |
Liability CASA
|
Branch Key |
Branch Key |
|
Currency Key |
Currency Key |
|
Customer Key |
Customer Key |
|
Date Key |
Date Key |
|
MIS Date |
The Oracle FLEXCUBE system date on which CASA information was extracted |
|
Account Open Date |
Date on which the account was opened |
|
Account Status |
Status of the account |
|
Account Type |
Type of the account |
|
Account Number |
Account number |
|
Credit Accr Interest |
Credit accrual interest |
|
Credit interest |
Credit interest |
|
Dormant Account |
Dormant account |
|
Fct CASA Key |
Fct CASA Key |
|
Interest Pay Freq |
Frequency of interest payment |
|
Interest Rate |
Rate of interest |
|
Maturity Date |
Maturity date |
|
Branch Code |
Branch code |
|
Currency |
Currency |
|
Customer ID |
Customer ID |
|
Module |
Module |
|
Product |
Product code |
|
TD Maturity Days |
Number of days left for the TD to mature (Maturity Date - MIS Date) |
|
Tenor Days |
Tenor days |
New Account Qtr |
If the account is created during the current quarter, this is set to ‘Y’. Otherwise it is set to ‘N’.. |
|
|
Account Creation Date |
Date of creation of account |
|
Report Account Type |
Report Account type |
|
Maturity Amount |
Maturity amount |
|
Maturity Amount LCY |
Maturity amount in local currency |
|
Credit interest LCY |
Credit interest in local currency |
|
Account Balance |
Account balance |
|
Account Balance LCY |
Account balance in local currency |
|
Debit Accr Interest |
Debit accrual interest |
|
Debit Interest |
Debit interest |
|
Debit Interest LCY |
Debit interest in local currency |
|
Monthly Credit Interest |
Monthly credit interest |
|
Monthly Credit Interest LCY |
Monthly credit interest in local currency |
|
Monthly Debit Interest |
Monthly debit interest |
|
Monthly Debit Interest LCY |
Monthly debit interest in local currency |
|
Product Key |
Product Key |
|
Projected Interest Till Maturity LCY |
Projected interest in local currency till maturity |
|
Projected Interest Till Maturity |
Projected interest till maturity |
|
TD Amount |
TD amount |
|
TD Amount LCY |
TD amount in local currency |
|
MTD Interest Paid LCY |
MTD interest paid terms of local currency |
|
Interest Earned LCY |
Interest earned in terms of local currency |
|
Total No of Liabilities |
Total number of liabilities |
Assets Loans |
|
|
|
Acc Type |
Account type |
|
Account Number |
Loan account number |
|
Account Status |
Account status |
|
Branch Key |
Branch Key |
|
Currency Key |
Currency Key |
|
Customer Key |
Customer Key |
|
Date Key |
Date key |
|
Fct Loan Key |
FCT Loan Key |
|
Maturity Date |
Maturity Date of the loan |
|
MIS Date |
The Oracle FLEXCUBE system date on which loans information was extracted |
|
Product Key |
Product key |
|
User Defined Status |
User defined status |
|
Value Date |
Value date of the loan |
|
Loan Type |
Loan Type Conventional Loans - Loan Type is a Loan Type product UDF Islamic Loans - Loan Type is the Product Category |
|
Customer ID |
Customer ID |
|
Module |
Module |
|
Product |
Product code |
|
Branch Code |
Branch code |
|
Currency |
Currency code |
|
New Account Qtr |
If the account is created during the current quarter, this is set to ‘Y’. Otherwise it is set to ‘N’.. |
|
Loan Book Date |
Loan book date |
|
Industry |
Industry |
|
Amount Disbursed |
Amount disbursed |
|
Amount Disbursed LCY |
Amount disbursed in local currency |
|
Amount Financed |
Amount financed |
|
Amount Financed LCY |
Amount financed in terms of local currency |
|
Monthly Amount Disbursed |
Monthly amount disbursed |
|
Monthly Amount Disbursed LCY |
Monthly amount disbursed in terms of local currency |
|
Monthly Interest Earned |
Monthly interest earned |
|
Monthly Interest Earned LCY |
Monthly interest earned in terms of local currency |
|
Outstanding Balance |
Outstanding balance |
|
Outstanding Balance LCY |
Outstanding balance in terms of local currency |
|
Total No of Assets |
Total number of assets |
Product |
Asset/Liability |
Asset or Liability |
|
Module |
Module |
|
Product Code |
Product Code |
|
Product Description |
Product Description |
|
Product End Date |
End Date of the product |
|
Product Key |
Product Key |
|
Product Start Date |
Start date of the product |
|
Product Type |
Type of the product |
For further details on ‘Branch’ and ‘Currency’, see Core Services user manual.
For further details on ‘Customer’, see Core Entities user manual.
For further details on ‘GL Master’, see General Ledger user manual.
For further details on ‘Liability CASA’, see Current Account and Savings Account user manual.
For further details on ‘Asset Loans’, see Retail lending user manual.
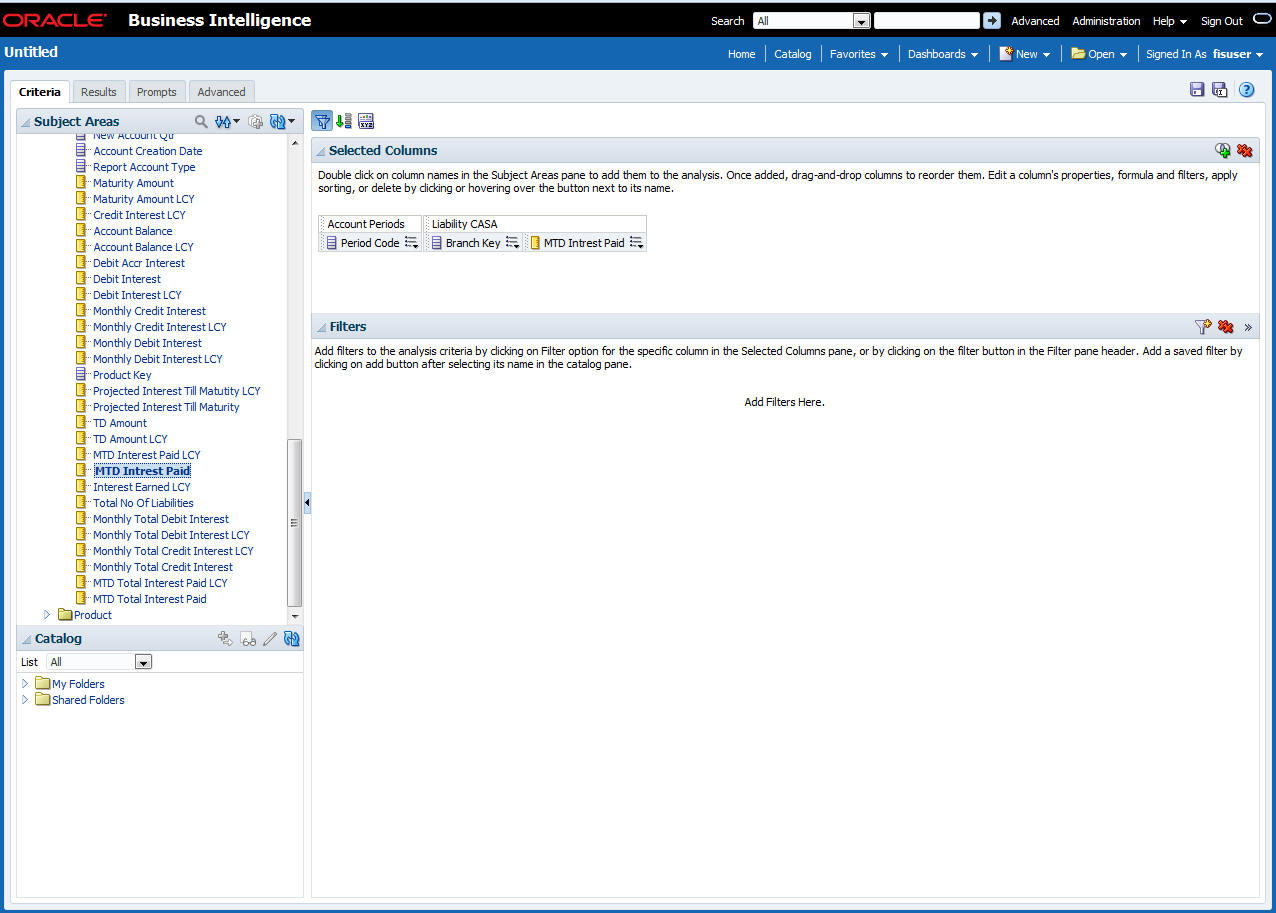
The subject areas that you select for a particular report decide the data that needs to be taken for generating the report. You can expand the folders mentioned above and select the columns that are required in the report.
Double-click a column name to add it to the report. The selected columns are displayed on the screen.
In order to add filters to the report, click the ‘Filter’ icon.
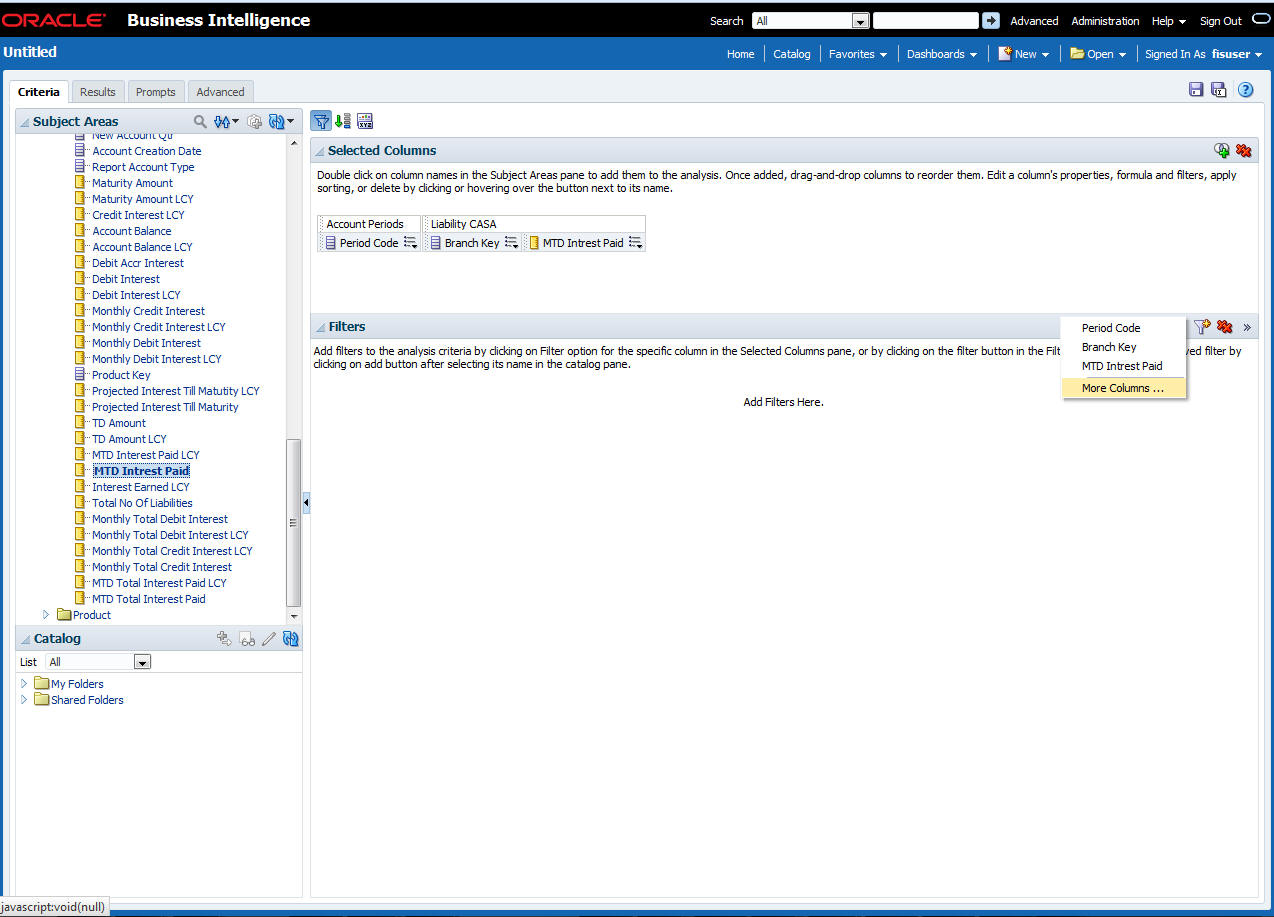
Click ‘Filter’ icon and select ‘More Columns’ to select the filters that you need to apply.
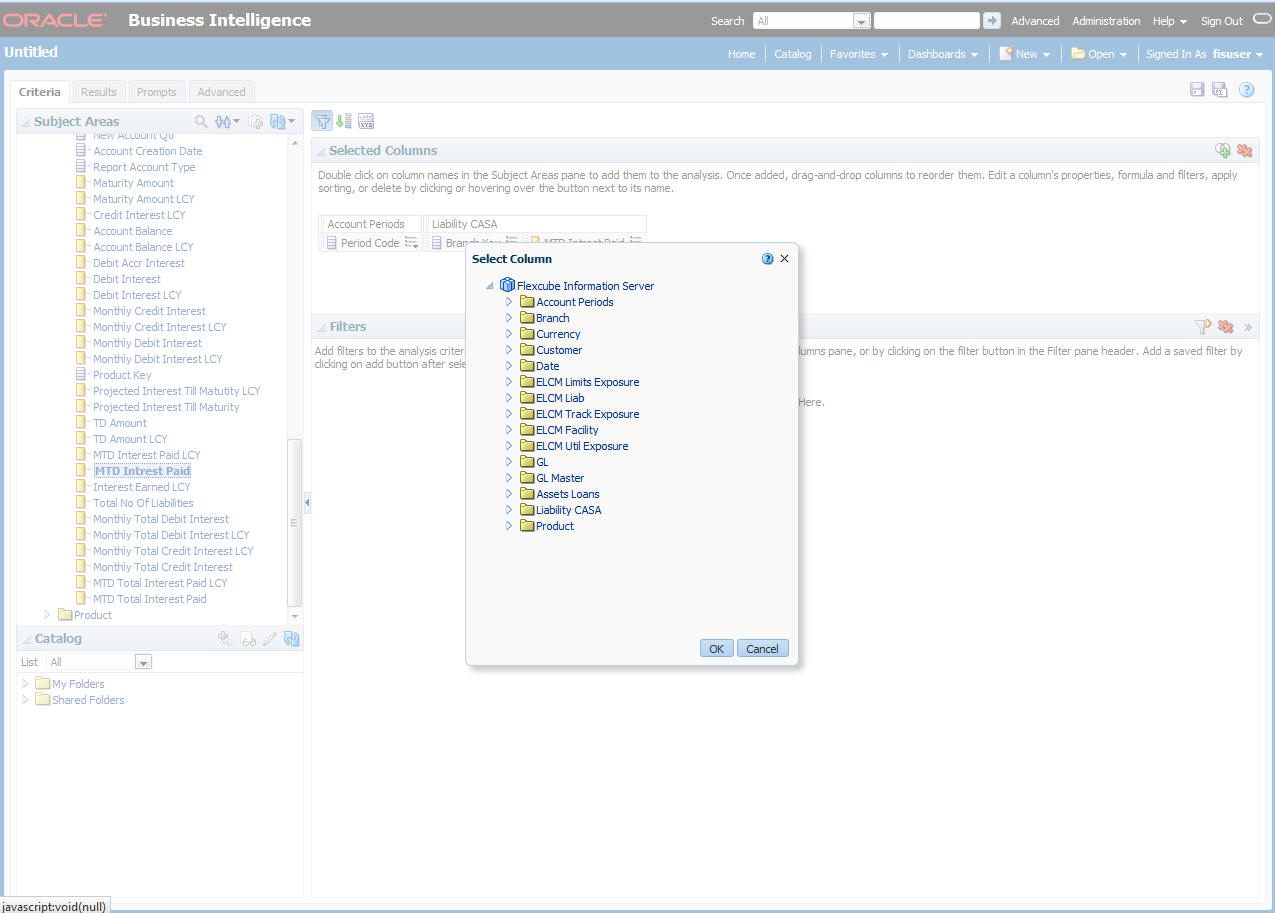
Select the required column and click ‘OK’ button. You will see the ‘New Filter’ window.
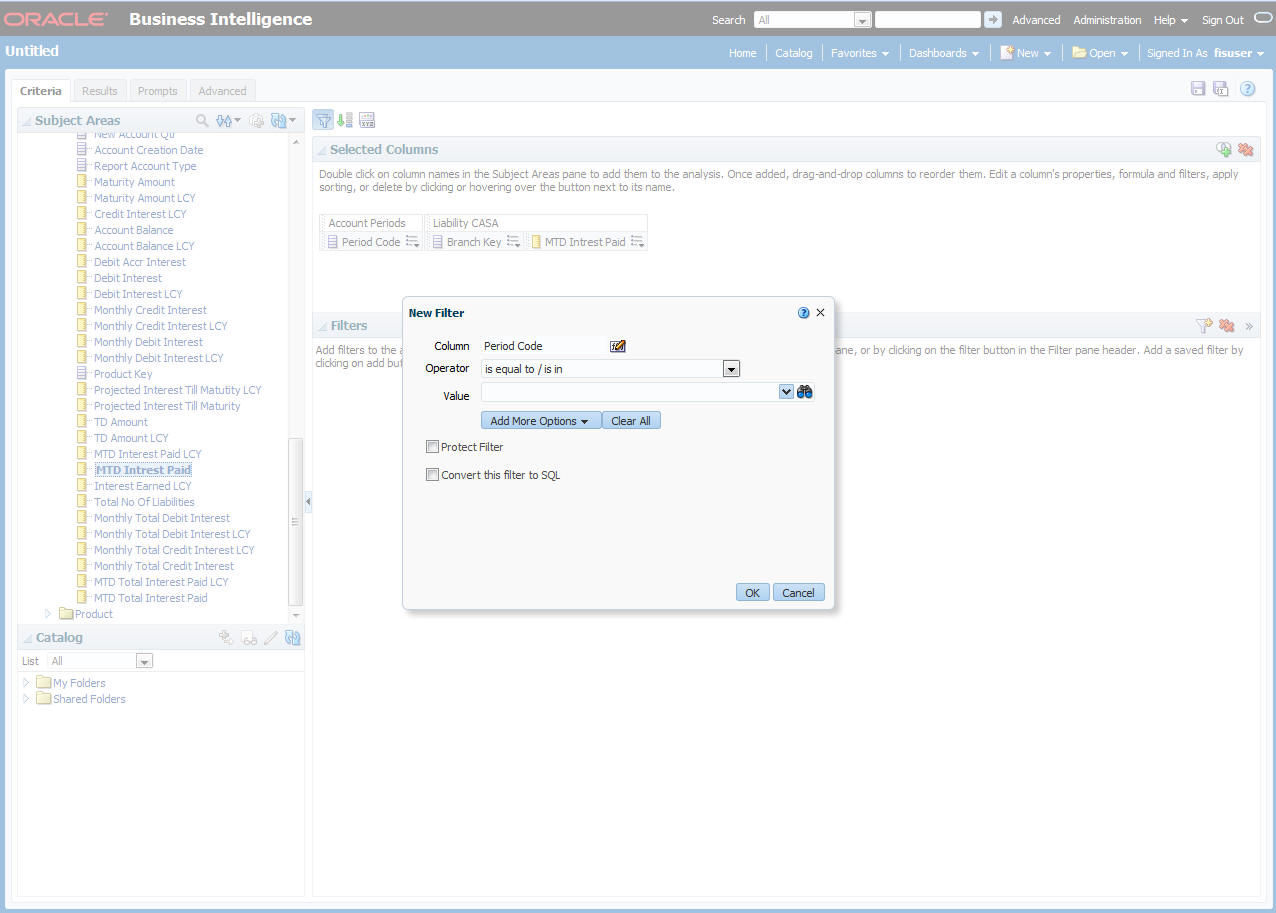
Select the operator and value. Click ‘OK’ button to add the filter. You can add more filters in the same manner.
The ‘Filters’ section of the screen displays all the selected filters.
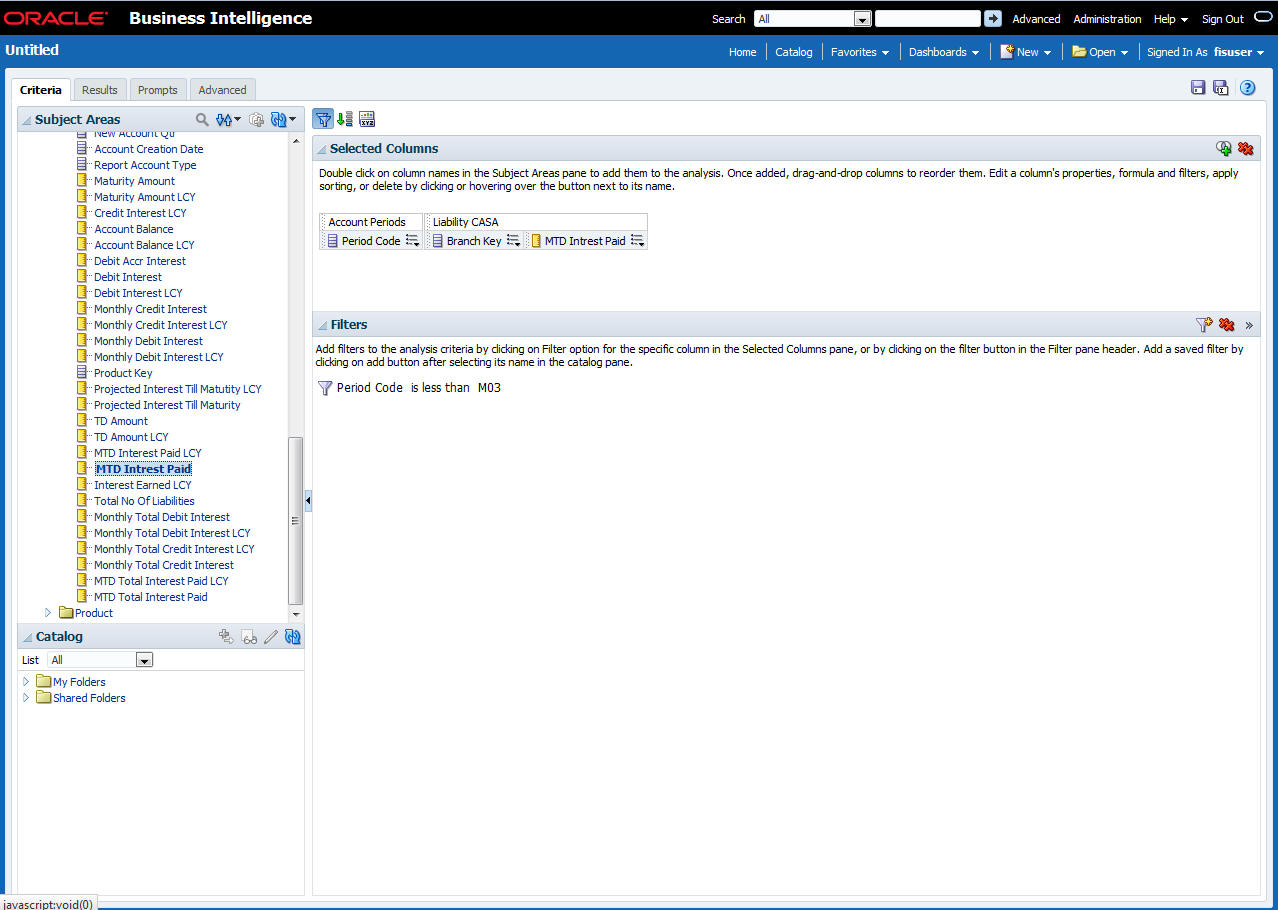
Once you have added the filters and done the required edits, click ‘Results’ tab.
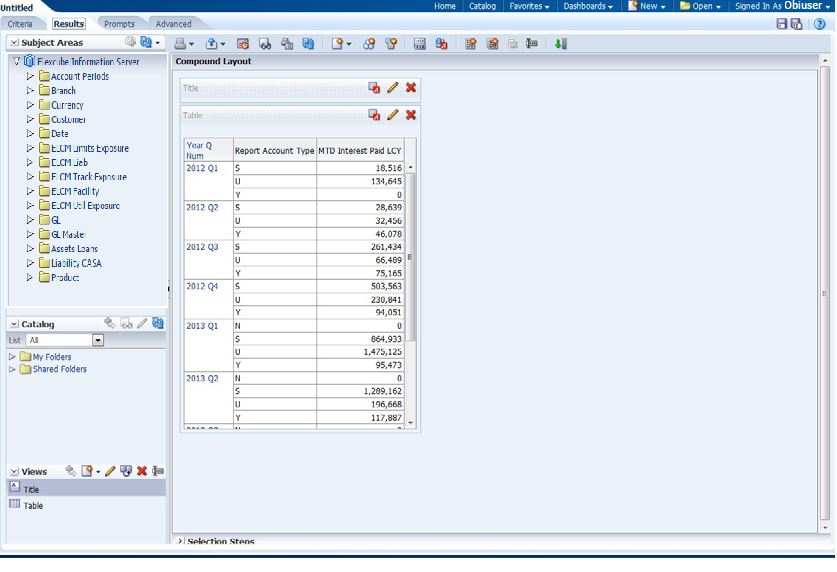
From this tab, you can add graphical representation of the data by using the new view button.
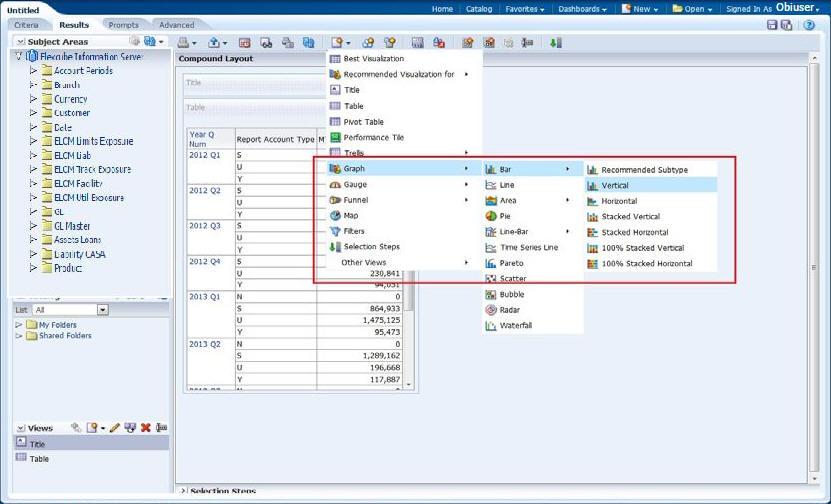
Select the type of graphical representation that you need to add.
OBIEE will display the graph in the result area.
You can drag and drop the items in the result and rearrange the display. If you wish to edit the properties of the graph, click Edit icon on the graph item toolbar,
Once the changes are made, click Save icon to save the report that you have created. OBIEE prompts you to specify the name of the report to save
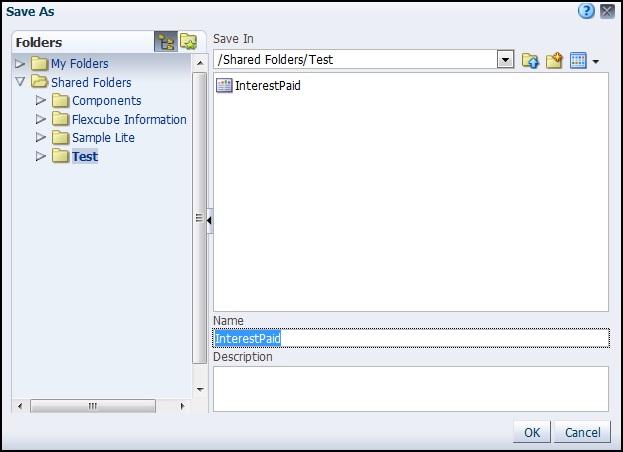
Give an appropriate name to the report and click ‘OK’ button to save it.
You may also add this dynamic report to a dashboard in OBIEE.
For details on creating dashboards and adding reports to dashboard, refer to the documentation of Oracle Business Intelligence Enterprise Edition.