| Oracle® Retail Predictive Application Server Cloud Edition Administration Guide Release 19.0 F25569-31 |
|

 Previous |
 Next |
| Oracle® Retail Predictive Application Server Cloud Edition Administration Guide Release 19.0 F25569-31 |
|
Previous |
Next |
This chapter describes the RPASCE Performance Diagnostic Tool. It contains the following sections:
The Performance Diagnostic Tool is a set of administrative reports that an application administrator or system integrator can use to monitor, identify, and review any RPASCE performance issues. In this way, the system administrator or system integrator has access to the information necessary to take action. The Performance Diagnostic Tool Template is accessed in the System Administration Tasks tab, and is available to administration users. It provides details about potential performance trouble areas, focusing on common workbook and batch operations, including workbook open, commit, and calculations. The data can be viewed at aggregate levels, or down at the user level, if an administrator must work with a specific end user who has expressed concerns regarding RPASCE system performance. For the batch, it provides visibility into the more common batch operations that require a long time to complete, such as measure and hierarchy load and rule groups calculated during the batch. Based on the information provided in the Performance Diagnostic Tool, the administration user has a clearer understanding of where the issue is, which can help the user address the issue.
The Performance Diagnostic Tool monitors and analyzes two kinds of performance metrics: operational performance data and system metrics. RPASCE provides various means to collect the required data.
Operational performance data includes elapsed time for various workbook and batch operations. Workbook operations include Workbook Build, Open, Refresh, Commit, Custom Menu, and Calc. For Workbook Build, Refresh, Commit, and Custom Menu, elapsed time is also collected for each expression. Batch Operations include measure load, hierarchy load, and evaluating rule groups using the mace service.
RPASCE collects operation performance data in real time with minimal impact. The collection of operational performance data is built into the RPASCE core and does not need to be turned on or off. Data collection is available.
System metrics collected include Dimension Size, Measure Size, Workbook Size, and the Domain's Disk Usage. RPASCE collects the system metrics using a set of batch scripts provided as part of the release. The administrator can set up repeating jobs to execute these scripts on a daily or weekly basis. These scripts generate data files that are named: YYYYMMDD[metric].csv, where YYYYMMDD is the timestamp such as 20180101 and metric is the metric name, such as workbook_size, item_size, measure_size, and dimension_size. The data is stored as plain text in .csv format. This data is only meant for RPASCE internal use.
For support, both operational performance data and system metrics are automatically copied during the domain cloning or the copying process. This process does not need to be turn on or off. Since these files are text files without outside dependency, to preserve disk space, it is recommended that batch jobs be set up on the server to remove files older than a pre-defined number of days, such as 15 days. The system only retains the performance data for the last 15 days to preserve disk space. However, if any performance issues are observed for a particular period of time, it is recommended that the relevant performance data be preserved for analysis.
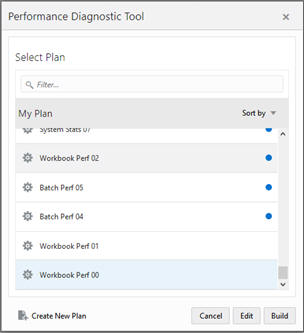
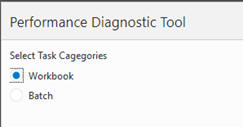
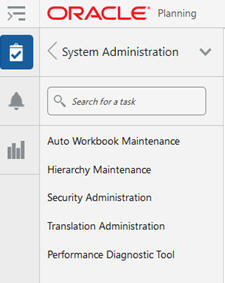
The Performance Diagnostic Tool is available to administration users as a workbook template, located in the template group System Administration, available from the task flow menu under Administration. To access the template, the user must login as an administration user, go to the System Administration Task Flow, and select the Performance Diagnostic Tool, shown in Figure 16-1.
Figure 16-1 Select Performance Diagnostic Tool
The Segment dialog box, which shows all previously defined segments, is displayed, as shown in Figure 16-2. This is used to select a predefined segment in order to modify it or copy it.
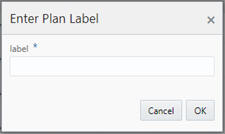
To define a new segment, select Create New Plan.The Enter Plan Label dialog box is displayed. Enter a label and click OK.
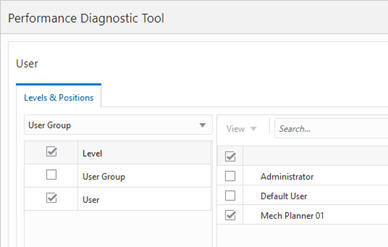
Then, select users from the list of users in the Levels and Positions tab shown in Figure 16-4. This contents of this list depends on whether or not performance data exists for this user in the domain. The administration user must pick at least one user to examine the performance data.
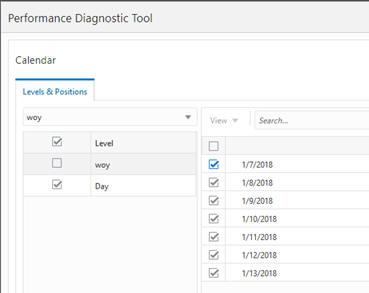
Select the calendar range, as shown in Figure 16-5. The calendar range is defined at the lowest calendar level of the domain, usually the day level. The days are arranged by the availability of performance data for the previously selected user.
Select either Workbook or Batch, as shown in Figure 16-6.
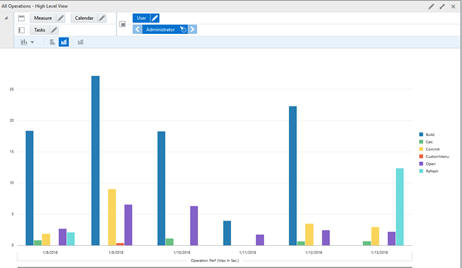
The segment, once fully specified, it is submitted to the RPASCE Task Daemon to build the workbook. The status of the workbook build can be tracked using the Task Status Dashboard or the Notification tab. When the workbook is being built, the performance data is loaded using a set of RPASCE rules that create the customized hierarchies for examining the performance data and the actual performance measure that holds the performance data. Once the workbook is successfully built, it can be opened via the Notification tab or from the segment window. By default, the workbook opens as shown in Figure 16-7.
By default, this view displays the Maximum Running Time, in seconds, for different types of Workspace operations such as Build and Calc, along with the calendar dimension, in a bar chart. The maximum running time is shown at aggregated level. For example, the maximum build time for a particular day is the maximum build time for all the workbooks that the specific user built on that day. Using this view, administration users can identify the type of workbook operations that require the longest time and how that time changes from day to day.
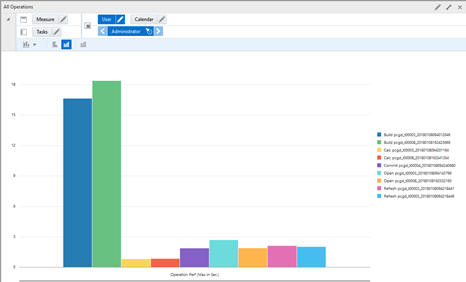
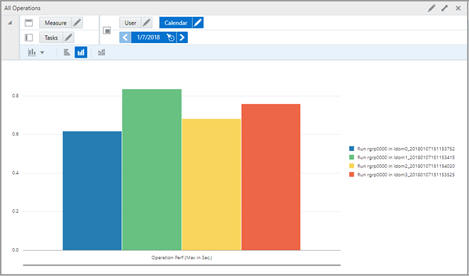
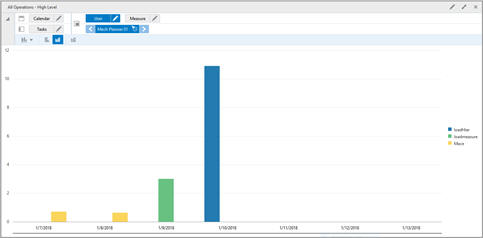
Since the data is presented at a high level in this view, the administration user can use this as a starting point for an investigation to identify which workbook build is actually taking the time. For more detailed information, the administration user can view the more detailed All Operations view, for specific day/user combination, as shown in Figure 16-8.
The All Operations bar chart shows the various workbook operations performed by the specific day/user combination, with the detailed workbook name.
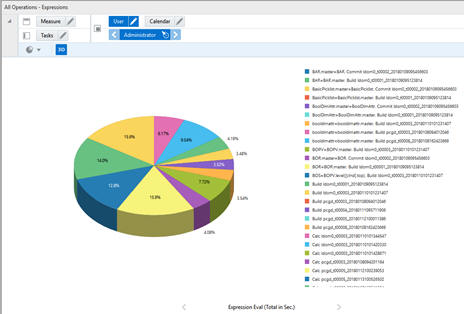
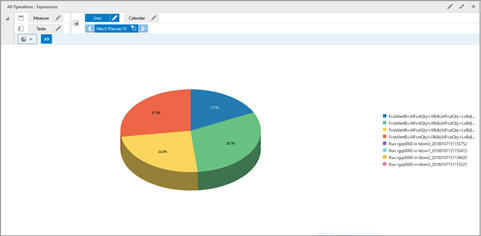
Using the Performance Diagnostic Tool, an administration user can drill down to the execution time at the expression level. However, only the expression execution times for full mode evaluation (Workspace build, Commit, Refresh, and Custom Menu) are captured. The expression execution time for incremental mode evaluation by Workbook Calc operations are not captured, as the individual expression's incremental evaluation time is generally at the level of milliseconds. To examine the expression level performance data, the user can examine the All Operations - Expressions view, shown in Figure 16-9.
The expression level, by default, displays each expression's execution time for the user/day combination in a pie chart. This reveals the longest running expressions for a specific workbook operation. Mousing over the pie chart shows the actual expression for the slice.
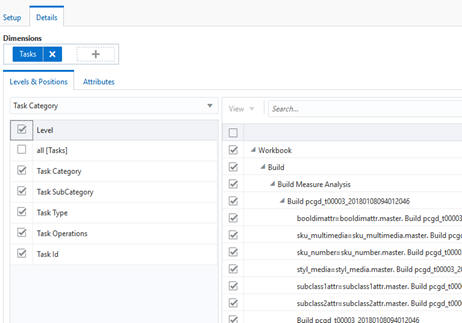
From the execution time at the expression level to the overall maximum running time for the type of workbook operations, the level of granularity is controlled by a customized hierarchy called Tasks. The Tasks hierarchy is built on demand when the workbook is created, using the data in the performance log files. The user can arrange the Tasks hierarchy to drill down to operations belonging to a specific workbook template or to a specific workbook. The user can arrange and manipulate the Tasks hierarchy using the Tasks tab, via the Tasks Hierarchy dialog box shown inFigure 16-10.
The Task hierarchy is made up of five levels.
The lowest level is Task ID, which is used by the Expression level view. Each Task ID represents an individual Expression evaluation. Task ID aggregates to the Task Operation level, which maps to each specific workbook operation, such as Build Operation for workwork pcgd_t00003.
The Task Operations level is the level shown in the All Operations view. Task Operations aggregates to the Task Type level, which maps to a specific workbook operation type/template name combination (for example, Build Operation for Measure Analysis template).
The Task Type level aggregates to the Task Subcategory level, which is the level shown in the All Operations - High Level view.
The Task Subcategory maps to each of the workbook operations such as Build, Calc, and Refresh.
The top level of the Task Hierarchy is the Task Category, which has only two positions: Workbook and Batch. Only one of these can be shown for each Performance Diagnostic workbook. The level names in the Task Hierarchy are generic, such as Categories, IDs, or Types, because the hierarchy definition is shared between the Workbook and Batch operations.
To view performance data, the user selects the Batch Operation choice in the wizard. RPASCE collects batch performance data for hierarchy and measure loads and mace rule group evaluation through the mace service (rpasce_run mace). When the workbook is opened, the set of views available are the same, but the levels in the task hierarchy map to different batch operations. The All Operations - High Level View is shown in Figure 16-11.
Figure 16-11 All Operations High Level View
The High Level view shows the maximum running time for each type of batch operations for calendar. In this example, only one type of batch has been executed for each day: the mace service for the first two days, then the execution of load measure, and loadHier on the fourth day.
All Operations by default displays the maximum running time at the Task Operations level. For the mace service, the Task Operations displays the individual mace run for each local domain.
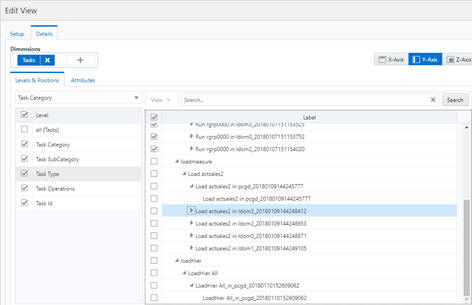
For the Expression Level view, similarly to Workbook Operations, the execution time for each expression is displayed, as shown in Figure 16-13. Data is only available for the mace service that evaluates the rule group, as there are no expressions to evaluate for load measure or load hierarchy data.
Figure 16-13 All Operations Expressions Execution Time
Compared to the Task Hierarchy for the Batch Operation views, the Hierarchy dialog box displays the same five Task Levels, but with a different meaning. For the mace run rule group, the Task Operations level displays the rule group evaluation in one local domain, identified by a time stamp. This helps to differentiate the same rule group being evaluated multiple times in the same day. The Task Type displays the Mace and Rule Group name being evaluated. The Task Subcategory displays the mace command. And the Task Category is batch.
Figure 16-15 Task Category - Load Measure

Neither loadHier and loadMeasure have any expression to evaluate, so the positions on the Task ID level are duplicates of the Task Operations, as RPASCE does not allow positions at an aggregated level without a position at the base level.
For loadHier:
The Task Operations display the loadHier call in the master domain, the hierarchy name(s) being loaded, All in the example to signify that this is a loadHier -loadAll call, and the time stamp.
The Task Type is loadHier and the hierarchies being loaded, no timestamp. So if the user made multiple loadHier calls for the same set of hierarchies, there will be multiple Task Operations, one for each loadHier call, but only one Task Type position. If the user made two loadHier calls for the same day, two Task Types will be displayed for that day, one for the loadHier product and another for the loadHier location. Each Task Type also has a corresponding Task Operation with a timestamp.
The Task SubCategory is loadHier.
The Task Category is batch.
For loadMeasure, similarly to loadHier:
The Task ID has same positions as Task Operation.
Each loadMeasure call for a specific list of measures, plus a timestamp, constitutes a unique Task Operation.
The Task Type is load Measure and the loaded measure list combination.
The Task SubCategory is simply the LoadMeasure utility.
The Task Category is batch.
Using the Operations view, administration users can investigate performance issues down to the expression or utility level. A slow utility run or expression evaluation is usually linked to disk usage or to a large population count of measures. System metrics are always included in the Performance Diagnostic Tool workbook, regardless of whether the user selects Batch or Workbook Operations to build the workbook.
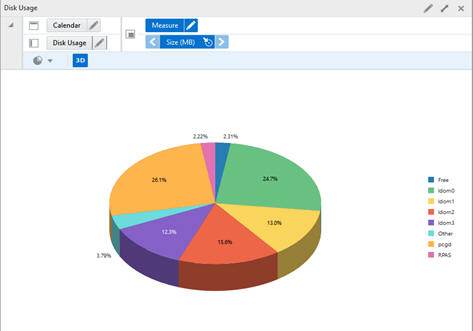
Administration users can use the Disk Usage view to analyze the overall disk utilization by RPASCE. By default, the Disk Usage view displays the total disk usage by MB for each sub-domain, the master domain, and the rpas home directory, along calendar dimension.
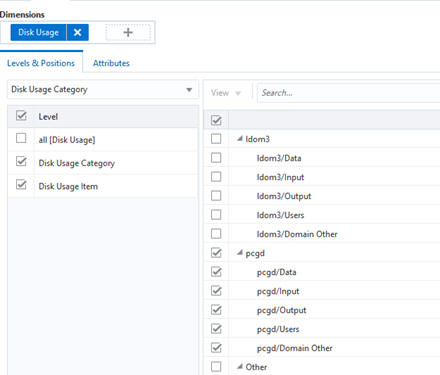
The disk usage is organized by the customized Disk Usage hierarchy. The user can explore and arrange the positions in this hierarchy via the Disk Usage tab, which displays the hierarchy dialog box.
The Disk Usage Category level displays the domain level information. Each domain maps to a position at the Disk Usage Category level. The Disk Usage Item level maps to each sub-directory per domain. The user can view a particular domain and examine how the disk usage is distributed in the directories of that domain. Figure 16-19 displays the master domain pcgd's usage.
A high level of disk usage in the Users directory suggests a large number of saved workbooks. A large input directory may indicate that some large measure load files are remaining.
The user can also view how the disk usage changes over the calendar dimension by positions along the calendar. The change in disk usage over the calendar may be a result of data load, batch calculations run over night, or large workbook build/commits that occur during the day.
To obtain the latest disk usage information, run the OAT task Monitor Disk Usage and rebuild the Performance Diagnostic Tool workbook.
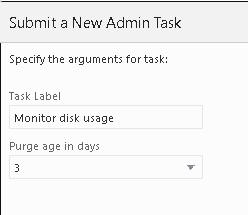
This task is used to get the latest disk usage information present in the domain which is then fed as input to the Performance Diagnostic Tool workbook. You can access the Monitor Disk Usage task from the System Admin Tasks, as shown in Figure 16-20
The option, Purge age in days, purges disk usage output files older than the specified number of days. After the latest disk usage information is provided to the user, the disk usage information files older than purge age will be deleted.
The Workbook Size view displays the Workbook Size by MB, identified by the segment label. The default view is shown in Figure 16-21. Here, the user can identify the largest workbooks in each domain.
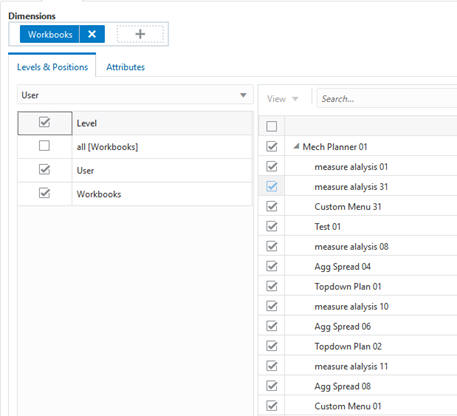
Workbook sizes are organized by the customized hierarchy Workbooks, which can be explored using the Hierarchy dialog box.
The customized Workbooks hierarchy has only two levels. The root level is the workbook itself identified by the segment label, and it rolls up to each user. The user can collapse the level to display the total workbook usage by each user within each domain.
Since the workbook size view is defined on the Calendar dimension, the user can roll over calendars to see how the workbook size changes, which may be caused by calculations that occurred in the workbook.
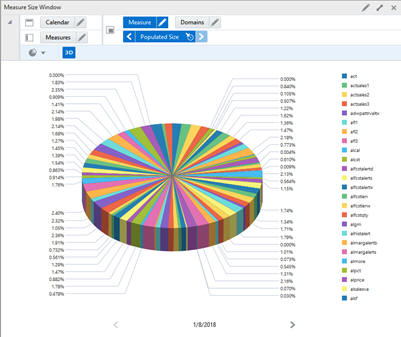
Measure Size, especially the populated size, is an important performance factor behind many operations, such as batch calculation and measure load. The user can explore both the logical and the populated size of measures using the Measure Size view. The Measure Size view displays the populated size across the global domain as shown in Figure 16-23, so that the user can identify the largest populated measures in the entire domain.
The user can explore the Domain dimensions to find the largest measures within each sub-domain, or the master domain itself if the measure is HBI.
The user can also explore how the measure size changes over the calendar dimension by viewing the days. The measure size changes over the calendar either because of large data load during the batch run or due to the calculation or workbook commits.
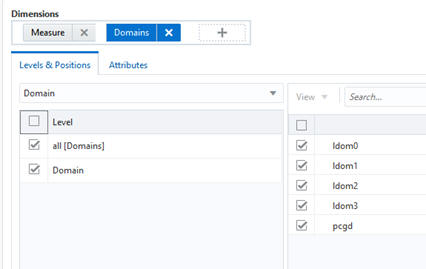
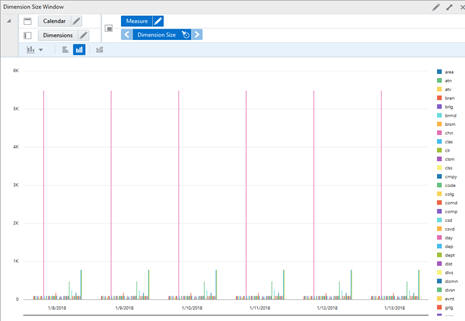
Dimension size affects a measure's logical size. A large dimension may also affect to performance in loadHier or a batch calculation where the NOB (number of observation) iteration must be performed instead of the POP iteration. The user can use the Dimension Size view to explore the Dimension Size within the domain. By default, the Dimension Size Window displays the actual dimension size along the calendar dimension, so the user can identify the largest dimension and how its size changes over time, which is usually caused by a loadhier run.