| Oracle® Retail Demand Forecasting Cloud Service User Guide Release 19.0 F24922-17 |
|

 Previous |
 Next |
| Oracle® Retail Demand Forecasting Cloud Service User Guide Release 19.0 F24922-17 |
|
Previous |
Next |
Preprocessing is a filtering module that automatically adjusts historical data to correct data points that do not represent general demand pattern. Essentially, it smooths out spikes and dips in historical sales data, replacing stock-out data and data from short term events, such as promotions and temporary price changes, with data points that more accurately represent typical sales for that period. By adjusting the historical sales, Preprocessing can provide smarter data to the RDF Causal Engine, thus creating a smarter baseline forecast.
|
Note: There are no workspaces associated with Preprocessing - it is available as a configuration option. |
Common Preprocessing corrections are:
Out of stock - Interfaced from RMS, weekly or daily
Outliers - Indicator not required, depends on method
Short term events - Promotions, temporary price changes
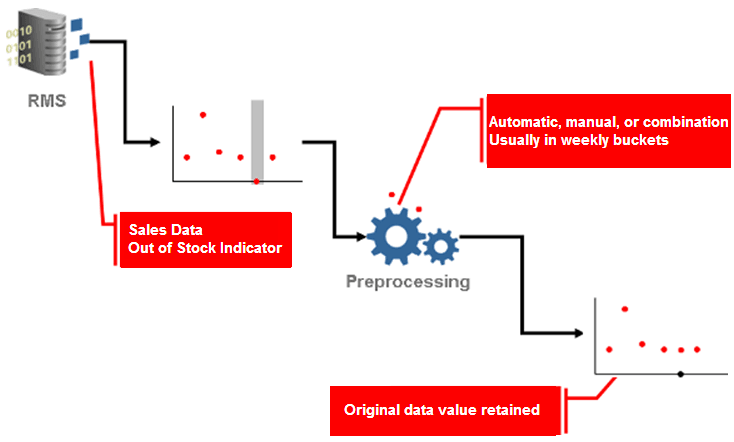
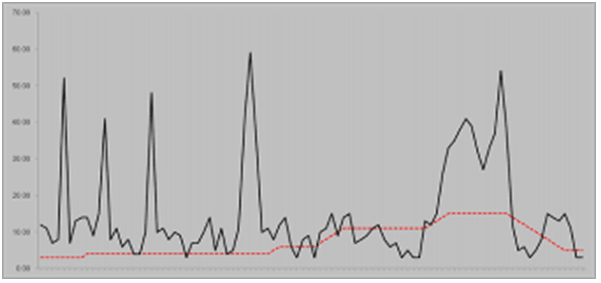
For example, Figure C-1 illustrates how Preprocessing adjusts for stock-outs.
In Figure C-1, RMS sends historical sales data to RDFCS. In that sales data, RMS has flagged out-of-stock instances with indicators (the gray portion of the first data set). Preprocessing takes note of that out-of-stock indicator and adjusts the sales for that time period to reflect a more typical sales quantity that better reflects unconstrained demand. Note in Figure C-1 that Preprocessing has removed the dip in sales in the second data set and has replaced it with a new data point.
|
Note: In order to run any preprocessing method, there needs to be at least three periods with non-zero data in the preprocessing window. If there are less than three periods with non-zero data, then the time series is skipped. |
Preprocessing uses several methods to massage historical data. The following sections detail these methods:
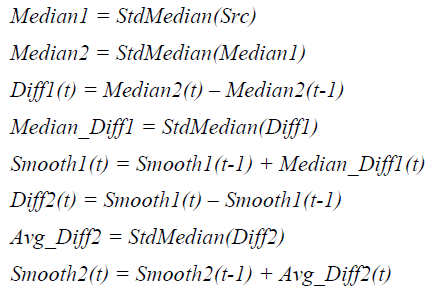
Standard Median calculates baselines on long time ranges.
Input: None
Optional parameter: Window length
When data points for the full window are not available, Preprocessing pads the beginning and end of the time series with the first and the last data points, respectively, so that there are values for the full window.
Retail Median calculates baselines on long time ranges and improves side effects by making five standard median filter passes.
Input: none
Optional parameter: window length
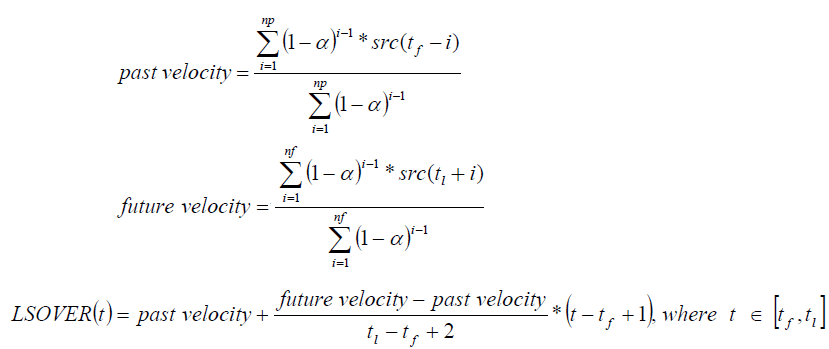
Standard Exponential Smoothing removes spikes (such as promotional promo, temporary price changes, and so on), as well as filling the gaps (out of stock, unusual events such as a fire or hurricane).
Input: An Event Indicator that indicates which periods should be preprocessed.
Optional Parameters:
The following table details the optional parameters for Standard Exponential Smoothing.
| Optional Parameters | Description |
|---|---|
| ES (Exponential Smoothing) | The alpha parameter that determines the weight put on observations of periods included in the calculations. |
| Number of future periods (nfut) | The number of periods after an outage periods that are considered in the calculation of the future velocity.
Note that if during these periods an event flag or a event indicator is on, the particular period is excluded from the calculation. |
| Number of past periods (npast) | The number of periods before an outage periods that are considered in the calculation of the past velocity.
Note: When calculating the past velocity and the first period in the preprocessing window is flagged, then the past velocity is calculated using earlier periods outside the preprocessing window. Note that if during these periods an event flag or a event indicator is on, the particular period is excluded from the calculation. |
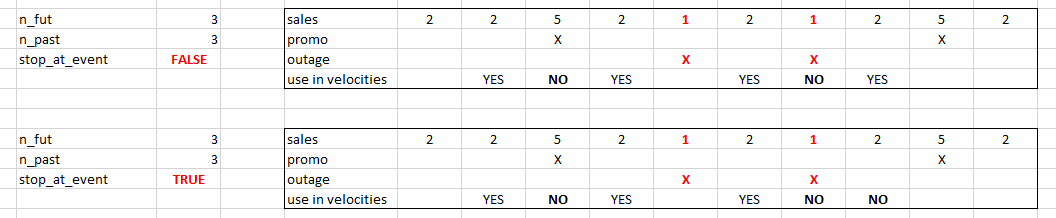
| Event flag | This parameter is an additional indicator that determines if a period should be excluded from the calculation of past or future velocities as defined by the number of past and future periods. For instance, if correcting for stock outs, you may not want to consider promoted periods to avoid over-inflating demand. |
| Stop at event flag | This parameter determines which periods are included in the calculation of past/future velocities.
If the flag is set to True, then the algorithm only includes periods before the first event flag or event indicator. If the flag is False, then all available, non-flagged periods, within the windows defined by nfut and npast, are used in the calculation of the past and future velocities. The default setting for the flag is False. |
| Mode | This parameter decides which adjustments are allowed for a particular run. The options are:
|
When event flags exist within the future and past velocity windows, rather than consider the entire window, Preprocessing only considers unflagged data points after the last event flag in the history window to compute the past velocity. It does a similar process for the future window by using the unflagged data points prior to the first event flag in the future window to compute the future velocity. Consecutive events are smoothed using the same velocities. A data point becomes flagged, and hence not part of the future/past velocity calculation, if either the event indicator or the optional event flag are on.
If future velocities cannot be calculated, then the past velocities, if they exist, are used as future and past velocities, and vice versa. When neither of the velocities can be calculated, there is no adjustment.
If the velocity window contains all zero values, then the calculated velocity is zero. A velocity of zero is a legitimate value if it occurs within the selling window. A velocity of zero is not acceptable if it is calculated based on values outside of the selling window.
Figure C-8 shows an example to better illustrate the use of the Event Flag. The preprocessing run corrects for stock-outs. The first run has the Stop at Event flag turned off, and you can see how more periods are included in the velocities calculations than in the second run when the flag is turned on.
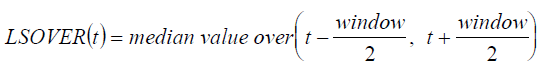
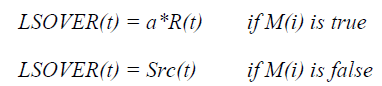
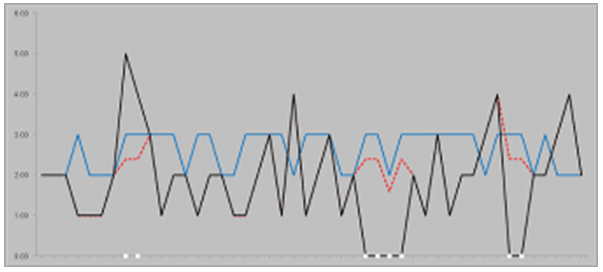
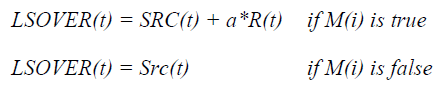
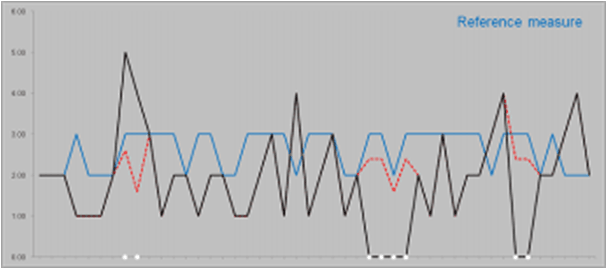
Override fills gaps in data when a reference measure exists.
Input: reference measure (R(t)) to copy data from
Optional parameter: outage/mask (M(i)), adjustment ratio (a)
Formula: Overrides LSOVER with the Src adjusted by the adjustment ratio according to the mask:
Increment updates gaps or outliers in data when a reference measure exists.
Input: reference measure (R(t)) to copy data from
Optional parameter: outage/mask (M(i)), adjustment ratio (a)
Increments the Src with the reference adjusted by the adjustment ratio according to the mask:
DePrice removes the pricing effects.
Inputs: price, maximum price
Optional parameters: none
Formula:
Smoothed = original * (price/maxprice) ^2
This method can be used for depromoting sales instead of Standard Exponential Smoothing. It is especially beneficial when there are extensive consecutive promoted periods. In such cases interpolating can remove unwanted information, such as seasonality.
DePromote uses promotion effects to remove promo lifts. It is an iterative process that runs preprocessing, then estimation to determine the promotion effects and seasonality a few times until a stable state is reached. Details on how to enable and control this process can be found in the Oracle Retail Demand Forecasting Cloud Service Implementation Guide.
This Preprocessing method clears the Preprocessing adjustments from previous runs and also clears the lsover measure.
LSOVER(t) = 0
LS(t) = 0
This Preprocessing method does not filter the source data.The preprocessing adjustments are cleared and lsover is set to the source data.
LS(t) = 0
LSOVER(t) = SRC(t)
When using Preprocessing to correct for stock-outs, the system expects out-of-stock indicators from a merchandising system like RMS. The system can be set up for automatic adjustment of sales history to correct for stock-outs as well as for manual user overrides under exception cases.
When set to automatically adjust sales history to correct stock-outs, Preprocessing takes into account trending and seasonality and adjusts the sales that were flagged by the out-of-stock indicator to reflect a more typical sales quantity.
When using Preprocessing to correct for outliers, the system expects outlier indicators. These are typically loaded.
Preprocessing adjusts promotional data in a similar way that it does stock-outs. Typically, historical data shows a higher rate of sales during promotional periods. Were these spikes in sales to be left in historical sales data and loaded in the RDF Causal Engine, the baseline forecast created from this data would reflect similar spikes in future sales.
In most RDFCS implementations, the out-of-stock and outlier flags are interfaced into RDF. However, not all retailers keep track of outages and outliers, or they are not very exact.
The following are some rules that populate these indicators. Note that they are a point of view, and you are encouraged to further refine them to fit your business needs.
If we call OOS the out-of-stock indicator, and outliers the outlier flag, the logic to populate the flags can be:
If the rate of sales of an item is lower than the threshold, then the OOS is false.
Otherwise, make sure the item has been selling for a while and that it does not have extensive periods with zero sales. If it is a New Item, you do not want to start correcting the demand until the patterns become stable/predictable. Also, if the sales history has many zeroes, this may be an indication of a bigger issue, and you may want to correct by taking action in your Source Measure Maintenance workspace.
If these conditions are fulfilled, and the sales are still considered low, then mark the week as out-of-stock.
The pseudocode can look like:
If threshold 1a < rate of sales < threshold 1b
   If minimum number of sales periods > threshold 2a
                         &&
      number of periods with zero sales < threshold 3a
                         &&
      sales < percent 1a * rate of sales
   then OOS = TRUE
 elseif rate of sales > threshold 1b
   If minimum number of sales periods > threshold 2b
                         &&
      number of periods with zero sales < threshold 3b
                         &&
      sales < percent 1b * rate of sales
   then OOS = TRUE
For the outlier creation, the logic can be:
For weeks with regular demand (no event, discount, etc, is active), if the sales are deemed to be too high then mark the period as an outlier.
The pseudocode can look like:
If sales > rate of sales * multiplier
                         &&
   Period is not promoted
Then outliers = TRUE