| Oracle® Retail Category Management User Guide for the RPAS Fusion Client Release 14.1.1 E62413-01 |
|

 Previous |
 Next |
| Oracle® Retail Category Management User Guide for the RPAS Fusion Client Release 14.1.1 E62413-01 |
|
Previous |
Next |
This chapter describes the Assortment Planning Analysis task. This task enables retailers to analyze their current assortment and past assortment (last year, last plan) from a performance perspective, consumer segment perspective, and market perspective.
Consumer insights are core to this task, using external market and consumer data. This task also provides visibility to the retailer's category versus competitors versus the market place as a whole. (Examples of external market data providers include Nielsen, Symphony IRI, Axciom, and FICO.)
The task facilitates analyzing current assortments, determining the appropriate market coverage, rationalizing (validation of necessary add, drop, and keep) the assortment, and quantifying the assortment decisions.
The task uses assortment clusters (or clusters) received from the Advanced Clustering (AC) solution, based on ORASE, to ensure that assortments are tailored to specific markets and primary consumer segments. Note that it is possible to feed these clusters from external sources as well. Stores are pre-clustered or grouped into assortment clusters based on various parameters like consumer segment profiles, store attributes, performance attributes, product attributes, and so on.
This task also takes present targets and recommendations from different sources in the category scorecard for alignment of assortment plans to them. These targets and recommendations consist of:
Category roles, strategies, tactics, and category plan financial targets
MFP targets
MSO recommendations for space and gross profit
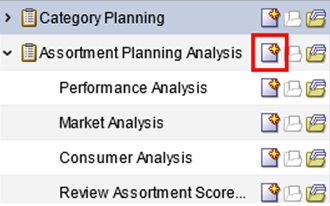
To create the workbook:
Select the New Workbook icon in the Assortment Planning Analysis task.
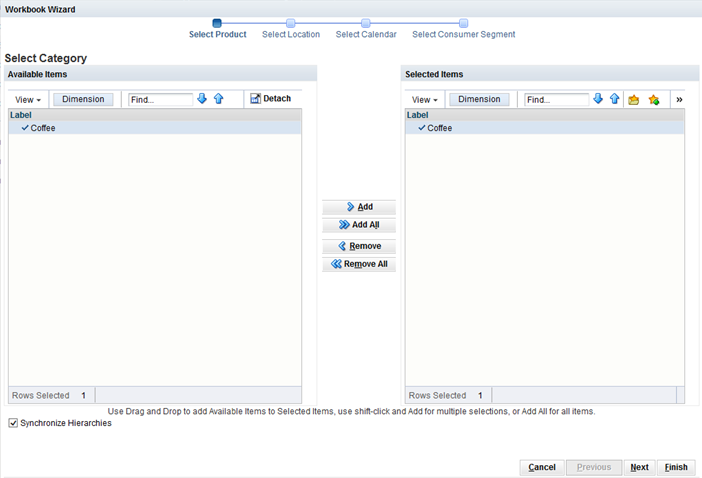
Select only one category and move it to the Selected Items box. Click Next.
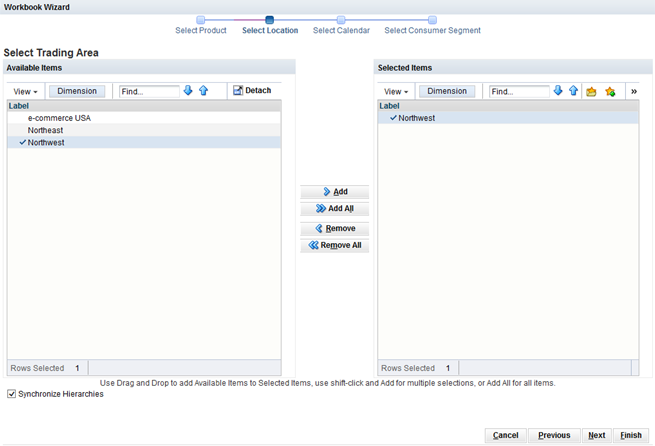
Select the trading areas and move them to the Selected Items box. Click Next.
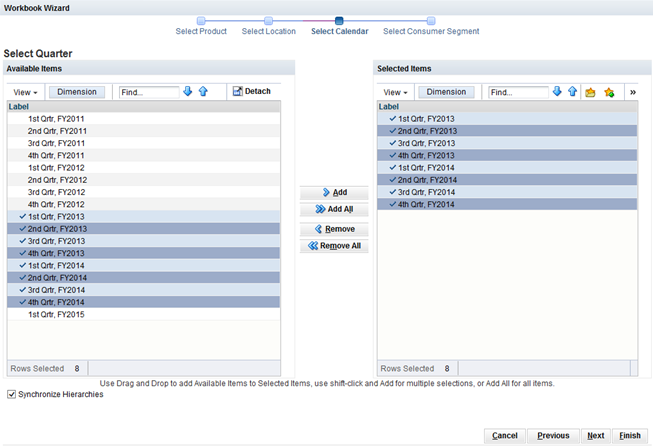
Select the quarters and move them to the Selected Items box. Click Next.
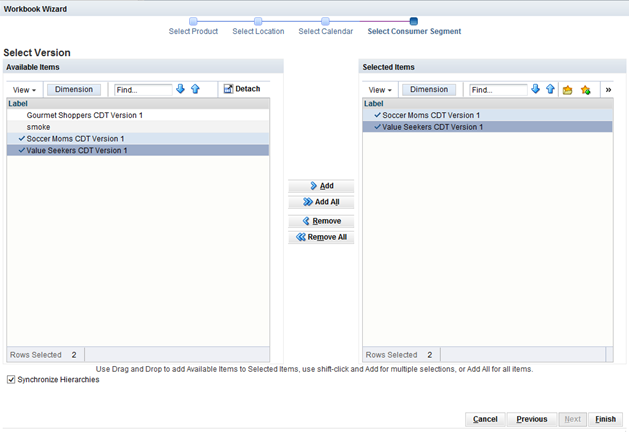
Select the Consumer Segments and move them to the Selected Items box. Click Finish.
The workbook is created.
Performance Analysis presents cross-category quantitative analysis for a retailer's business. Use this step to analyze a category's performance based on historical sales and forecast, if available. SKU level analysis is available to gauge the performance at the lowest level in the assortment. Sub-category and category level analyses are available in quadrant analysis for cross-category performance comparisons.
This step has the following tabs and views:
Performance Quadrant Analysis Tab:
1. Gross Profit and Inventory Turns View
2. Sales Revenue and Sales Units View
This tab has one view.
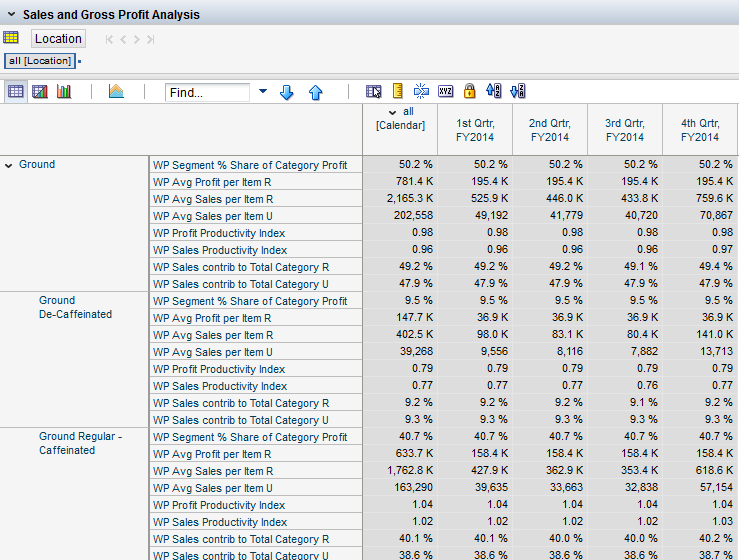
Use this view to analyze the contribution of sales and profits from each sub-category to the category total. It is possible to drill down to the cluster level in this view. It represents actuals for elapsed periods and planned values for future periods.
Table 7-1 lists the measures available in this view.
Table 7-1 Sales and Gross Profit Analysis Measures
| Label | Definition |
|---|---|
|
WP Segment % Share of Category Profit |
The percentage share contribution of a particular product segment (sub-category, CDT segment, and so on) towards the overall gross profit of the category. |
|
WP Avg. Profit per Item R |
The average gross profit retail per item in the working plan assortment for the cluster. |
|
WP Avg. Sales per Item R |
The average sales retail per item in the working plan for the cluster. |
|
WP Avg. Sales per Item U |
The average sales units per item in the working plan for the cluster. |
|
WP Profit Productivity Index |
An index to average measure to gauge the relative profit productivity (or profit contribution) of a SKU or a sub-category within a category. It is calculated by dividing gross profit retail value per SKU with average gross profit retail value per SKU for the entire category. |
|
WP Sales Productivity Index |
An index to average measure to gauge the relative sales productivity (or sales contribution) of a SKU or a sub-category within a category compared to the rest of category's assortment. It is calculated by dividing gross profit retail value per SKU with average gross profit retail value per SKU for the entire category. |
|
WP Sales contrib to Total Category R |
The contribution, in percentage points, of a sub-category's sales retail value to the overall category sales retail value. |
|
WP Sales contrib to Total Category U |
The contribution, in percentage points, of a sub-category's units' value to the overall category sales units value. |
This tab has four views.
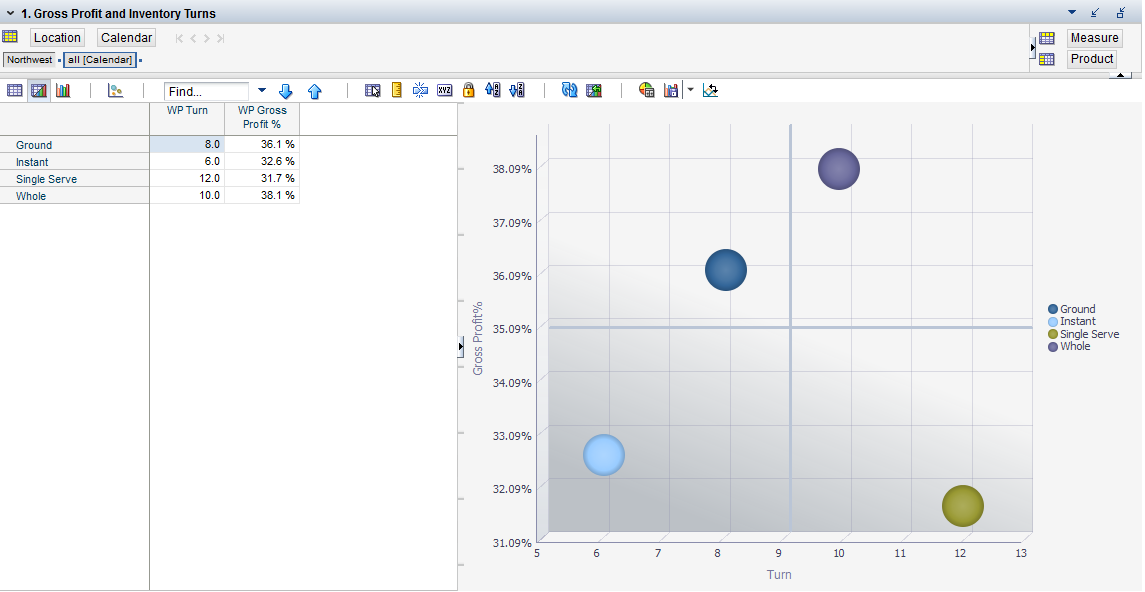
Use this view to analyze gross profit and inventory turns. This information is best displayed as a bubble chart.
Table 7-2 lists the measures available in this view.
Table 7-2 1. Gross Profit and Inventory Turns Measures
| Label | Definition |
|---|---|
|
Target Gross Profit % |
The approved and targeted gross profit percentage for a category or sub-category at the trading area level in the category plan. |
|
Target Turn |
The approved and targeted inventory turns for a sub-category or category at the trading area level in the category plan. |
|
WP Gross Profit % |
The gross profit percentage from the merchandise in the working plan assortment. This measure is different from the WP Assort Gross Profit % measure as it reflects gross profit percentage for all items irrespective of whether or not these items are part of the working plan assortment. |
|
WP Turn |
Inventory turns in the working plan version of the category plan. It is the number of times the average inventory carried can be sold over a specified period of time. In other words, it reflects the speed of inventory movement. |
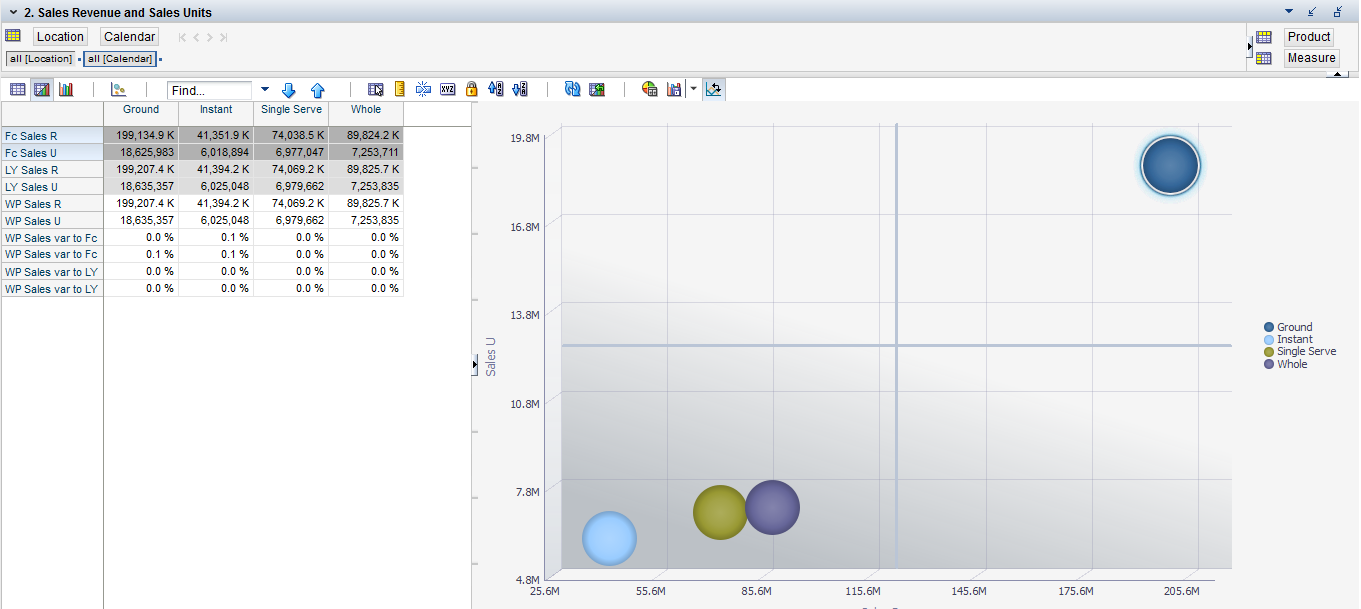
Use this view to analyze sales revenue and sales units. This information is best displayed as a bubble chart.
Table 7-3 lists the measures available in this view.
Table 7-3 2. Sales Revenue and Sales Units Measures
| Label | Definition |
|---|---|
|
Fc Sales R |
Sales retail value for a time period per the forecast. |
|
Fc Sales U |
Sales units for a time period per the forecast. |
|
LY Sales R |
Last year's assortment's sales retail value. |
|
LY Sales U |
Last year's assortment's sales units. |
|
WP Sales R |
The working plan sales retail value. This measure is different from the WP Assort Sales R measure as it reflects the sales retail value for all items irrespective of whether or not these items are part of the working plan assortment. |
|
WP Sales U |
The working plan sales units. This measure is different from the WP Assort Sales U measure as it reflects the sales units for all items irrespective of whether or not these items are part of the working plan assortment. |
|
WP Sales var to Fc R |
Sales retail value's variance between working plan and forecast. |
|
WP Sales var to Fc U |
Sales units' variance between working plan and forecast. |
|
WP Sales var to LY R |
Sales retail value's variance between working plan and last year's actuals. |
|
WP Sales var to LY U |
Sales units' variance between working plan and last year's actuals. |
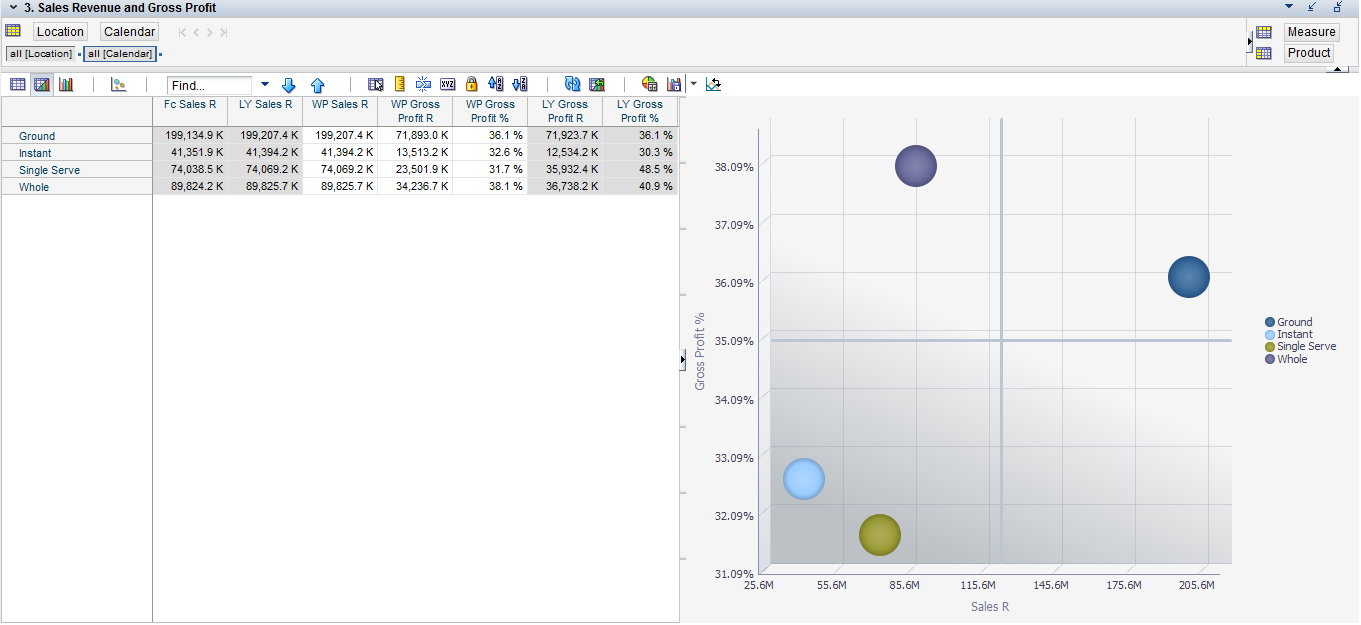
Use this view to analyze gross profit and sales. This information is best displayed as a bubble chart.
The chart shown in Figure 7-9 analyzes Sales R versus Gross Profit% for each sub-category in the Coffee category. Note that this analysis is possible at multiple product hierarchy levels. The chart indicates that the Ground Coffee sub-category is part of the top-right quadrant with high sales retail value and high gross profit percentage. In comparison, Whole Bean is in the top-left quadrant with high gross profit percentage and low sales retail value. The other two sub-categories, Instant and Single Serve, are part of the bottom-left quadrant with low sales retail value and gross profit percentage. It is important to note here that irrespective of the position of a sub-category in the quadrant chart, each sub-category has to play a part in category's (or retailer's) business, depending upon the respective role, strategies, and tactics assignment.
Table 7-4 lists the measures available in this view.
Table 7-4 3. Sales Revenue and Gross Profit Measures
| Label | Definition |
|---|---|
|
Fc Sales R |
Sales retail value for a time period per the forecast. |
|
LY Gross Profit R |
The gross profit retail value from the merchandise. This measure is different from the LY Assort Gross Profit R measure as it reflects gross profit retail for all items irrespective of whether or not these items are part of last year's assortment. |
|
LY Gross Profit % |
The gross profit percentage from the merchandise in last year's assortment. This measure is different from the LY Assort Gross Profit % measure as it reflects gross profit percentage for all items irrespective of whether or not these items are part of last year's assortment. |
|
LY Sales R |
Last year's assortment's sales retail value. |
|
WP Sales R |
The working plan sales retail value. This measure is different from the WP Assort Sales R measure as it reflects the sales retail value for all items irrespective of whether or not these items are part of the working plan assortment. |
|
WP Gross Profit R |
The gross profit retail from the merchandise in the working plan assortment. This measure is different from the WP Assort Gross Profit R measure as it reflects gross profit retail for all items irrespective of whether or not these items are part of the working plan assortment. |
|
WP Gross Profit % |
The gross profit percentage from the merchandise in the working plan assortment. This measure is different from the WP Assort Gross Profit % measure as it reflects gross profit percentage for all items irrespective of whether or not these items are part of the working plan assortment. |
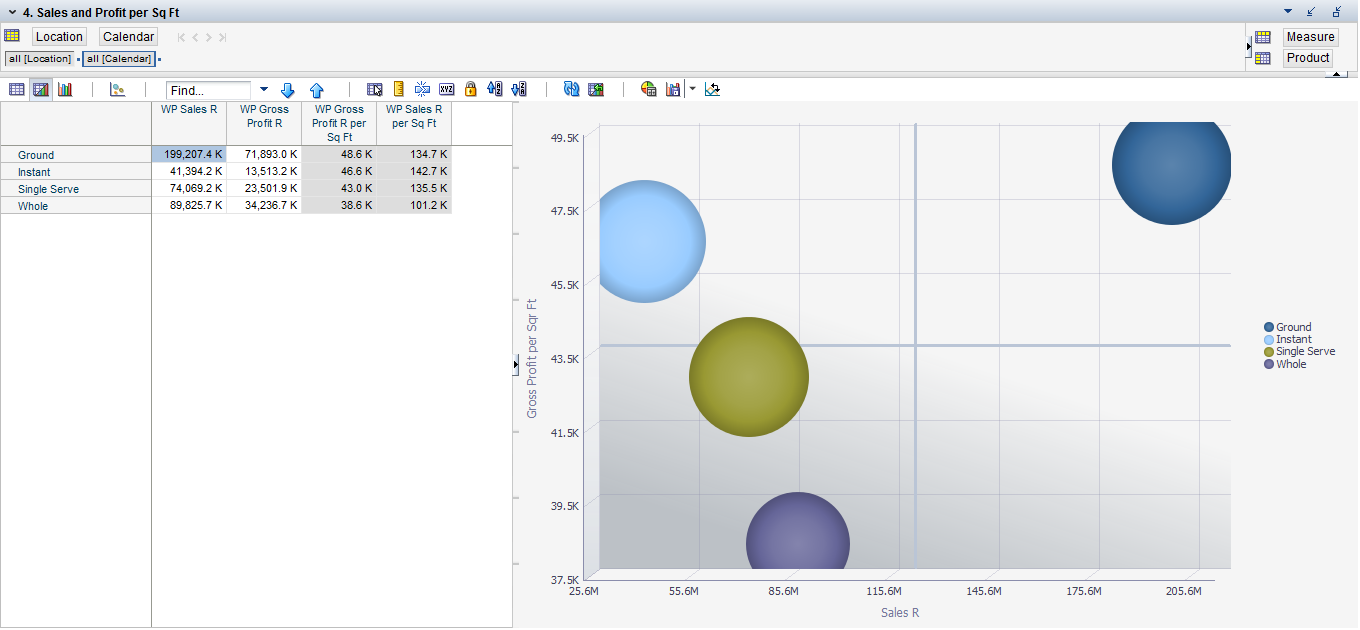
Use this view to analyze profit and sales per square foot. This information is best displayed as a bubble chart.
Table 7-5 lists the measures available in this view.
Table 7-5 4. Sales and Profit per Square Foot Measures
| Label | Definition |
|---|---|
|
WP Gross Profit R |
The gross profit retail from the merchandise in the working plan assortment. This measure is different from the WP Assort Gross Profit R measure as it reflects gross profit retail for all items irrespective of whether or not they are part of the working plan assortment. |
|
WP Gross Profit R per Sq Ft |
The gross profit retail return per square feet from the merchandise in the working plan assortment. It is calculated by dividing Gross Profit Retail Value from the merchandise by the space (area) allocated to the merchandise in square feet. |
|
WP Sales R |
The working plan sales retail value. This measure is different from the WP Assort Sales R measure as it reflects the sales retail value for all items irrespective of whether or not they are part of the working plan assortment. |
|
WP Sales R per Sq Ft |
The working plan assortment's sales retail return per square feet. It is calculated by dividing sales retail value by the space (area) allocated to that particular merchandise in square feet. |
Use this step to evaluate market coverage for each category by store cluster based on the standard hierarchy or by CDTs.
Market coverage is defined as the extent of sales covered by an assortment or a set of items. Market coverage is the percentage of the total sales of the market that the retailer's assortment covers. That is, the percentage market share of the overall combined market sales (say for a trading area) of the products in retailer's assortment represents the market coverage of retailer's assortment.
For example, a retailer can carry 100 SKUs for a product category out of 150 SKUs sold in the whole market. If the combined market sales of these 100 SKUs have a market share of 90 percent, the market coverage of the retailer's assortment is 90 percent.
Market coverage based analysis is based on market data that is sourced from third parties such as Nielsen, IRI, and so on, that provide syndicated data.
The concept of market coverage is used to look at the spread and contribution of sales in the retailer's business in relation to the market. It facilitates the determination of target market coverage for a retailer's assortment.
Key analyses under the Market Analysis step:
Fragmentation Analysis
Provides insights concerning what percentage of SKUs make up certain pre-defined breakpoints, leveraging user-selected key performance indicators such as Sales U and Sales Retail.
Helps answer the question: How many SKUs represent 50 percent of category sales, 75 percent of category sales, and so on. A highly fragmented category or sub-category indicates that the a large number of SKUs contribute to net category sales. A category or sub-category in which a small number of SKUs represent the majority of the category and sub-category sales is considered to have a low degree of fragmentation.
Provides an understanding of how fragmented the category and sub-category sales are compared to the market.
Item Contribution Analysis
An analogous concept is item contribution analysis, which can be considered the inverse way of examining the above information.
Provides an explanation for the contribution of items to the category, leveraging user-selected key performance indicators such as Sales U and Retail.
Helps identify the percentage of items contributing to 50 percent of the SKUs to category and sub-category sales, 75 percent, and so on. For example, 50 percent of SKUs contribute to 80 percent of sales.
This step has the following tabs and views:
Performance Based Fragmentation Analysis Tab:
1. Performance Based Fragmentation Market Analysis Data View
2. Performance Based Fragmentation Retail Data Analysis View
Item Contribution Analysis Tab:
1. Market Share Assessment View
Use this tab to define the measures for Performance Based Fragmentation Analysis, Item Contribution Analysis, Proliferation Analysis, and Accumulative Ranking Analysis. These analyses are described in this chapter.
The user also needs to set the breakpoints to view Performance Based Fragmentation Analysis and Item Contribution Analysis at the retailer level and market level.
This tab has two views.
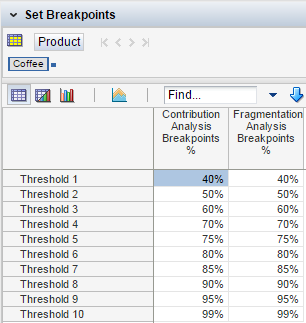
Use this view to set the category breakpoints. Vary the breakpoint thresholds to see the spread or distribution of sales across items in an assortment in fragmentation and item contribution analysis. This view also provides a facility to do what-if analysis for a specific percentage of sales and SKU count to identify the appropriate market coverage for WP assortment.
Table 7-6 lists the measures available in this view.
Table 7-6 Set Breakpoints Measures
| Label | Definition |
|---|---|
|
Contribution Analysis Breakpoints % |
The user-defined breakpoints or thresholds for the count of items (in percentage points) for a category are defined in this measure to see the sales distribution across the complete range of SKUs in that category. |
|
Fragmentation Analysis Breakpoints % |
The user-defined breakpoints or thresholds for sales (in percentage points) for a category are defined in this measure to see the sales distribution across the complete range of SKUs in that category. |
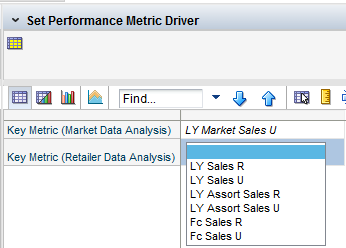
Use this view to set key metrics for the retailer and market levels for Performance Based Fragmentation Analysis, Item Contribution Analysis, Proliferation Analysis, and Accumulative Ranking Analysis. Selections made here are primarily used as the basis of calculations for fragmentation analysis. The calculations are then also used to derive the other three analyses previously mentioned. Once this selection is completed, the user needs to run the Fragmentation Analysis custom menu option to populate the respective views.
The selection is done from a drop-down list of measures available for the retail and market levels. The measures, Sales R and Sales U, are available in different roles and versions in the drop-down selection such as LY and Forecast, LY Market and Current Market.
Table 7-7 lists the measures available in this view.
Table 7-7 Select Performance Metric Driver Measures
| Label | Definition |
|---|---|
|
Key Metric (Market Data Analysis) |
The market data measure used to do fragmentation and contribution analysis. For example, for a traffic building category, the use of sales units in the market is appropriate. For a transaction building category, the use of sales retail in the market is appropriate. |
|
Key Metric (Retailer Data Analysis) |
The retailer data measure used to do fragmentation and contribution analysis. For example, for a traffic building category, the use of sales units at the retailer is appropriate. For a transaction building category, the use of sales retail at the retailer is appropriate. |
Custom Menu Option
Once the information has been set in the two views under Set Breakpoints and Performance Drivers, you can perform fragmentation analysis. This is done by using the Fragmentation Analysis custom menu option.
The results of the fragmentation analysis populate the measures available in the following tabs:
Performance Based Fragmentation Analysis
Item Contribution Analysis
Proliferation Analysis
Accumulative Ranking
Fragmentation Analysis provides a facility to view the distribution or spread of sales across the SKUs in an assortment. It helps the planner understand how fragmented the category/sub-category sales are.
You can also view and compare the fragmentation of the category at the retailer compared to the fragmentation in the market to understand if the retailer's category sales are more or less fragmented than the market.
Sales are divided into preset levels or ranges based on the breakpoints already defined. The SKU/Item count is viewed against it. The idea is to look at the number of SKUs/Items required to achieve a certain percentage of the overall sales at the category and sub-category level. This analysis is available for the retailer's business and in the overall market's business context, for example, a trading area.
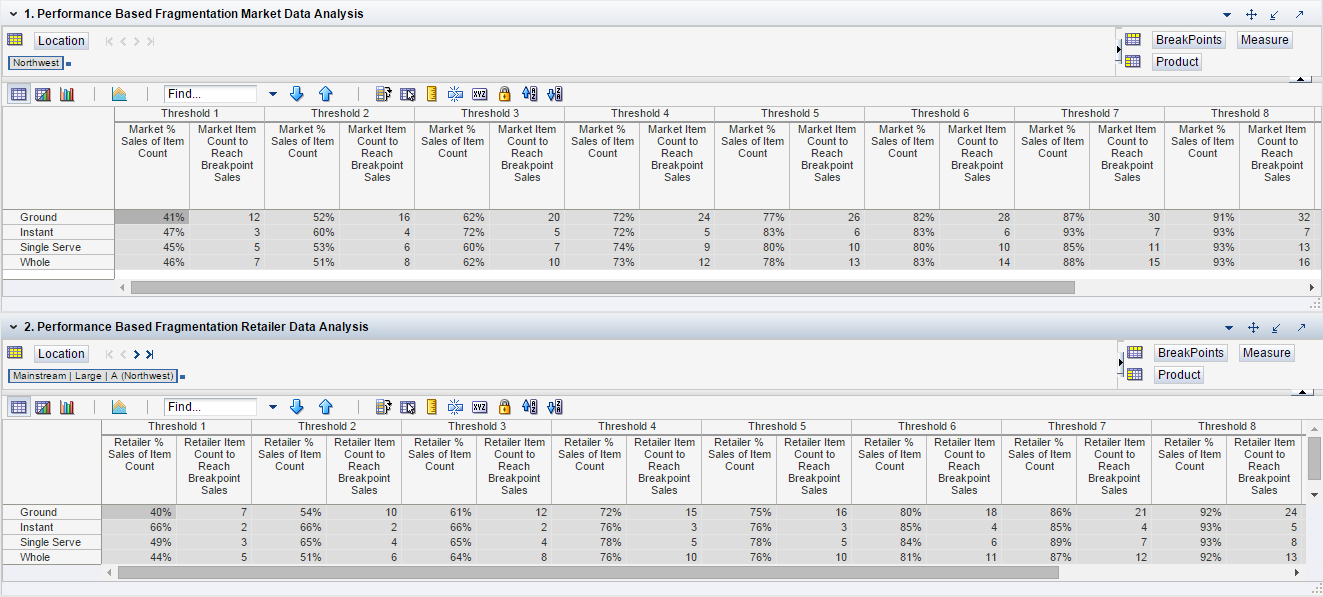
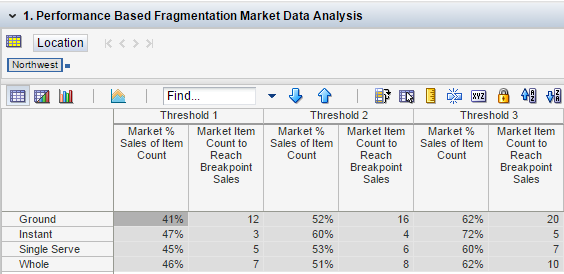
The following figure shows the views for this tab.
Use this view to analyze the number of the SKUs that represent certain predefined breakpoints, in percentage points, of the market sales.
Table 7-8 lists the measures available in this view.
Table 7-8 1. Performance Based Fragmentation Market Data Analysis Measures
| Label | Definition |
|---|---|
|
Market % Sales of Item Count |
Market coverage represented in percentage points by a set of items from the assortment. This is best viewed at the category level. Breakpoints are defined for this measure to view the fragmentation analysis. |
|
Market Item Count to Reach Breakpoint Sales |
The number of SKUs required in the market (typically trading area) as a whole to reach a pre-set breakpoint percentage level sales of total market sales. For example in Figure 7-14, 12 SKUs contribute to 41 percent of market sales and 20 SKUs contribute to 62 percent of market sales of ground coffee. |
Use this view to analyze the percentage of the SKUs that represent certain predefined breakpoints, in percentage points, of the retailer's sales.
Table 7-9 lists the measures available in this view.
Table 7-9 2. Performance Based Fragmentation Retail Data Analysis Measures
| Label | Definition |
|---|---|
|
Retailer % Sales of Item Count |
The contribution towards overall retail sales of the retailer represented in percentage figures by a set of items from the assortment. It is best viewed at the category level. The value of this measure should roughly align with the defined breakpoints. |
|
Retailer Item Count to Reach Breakpoint Sales |
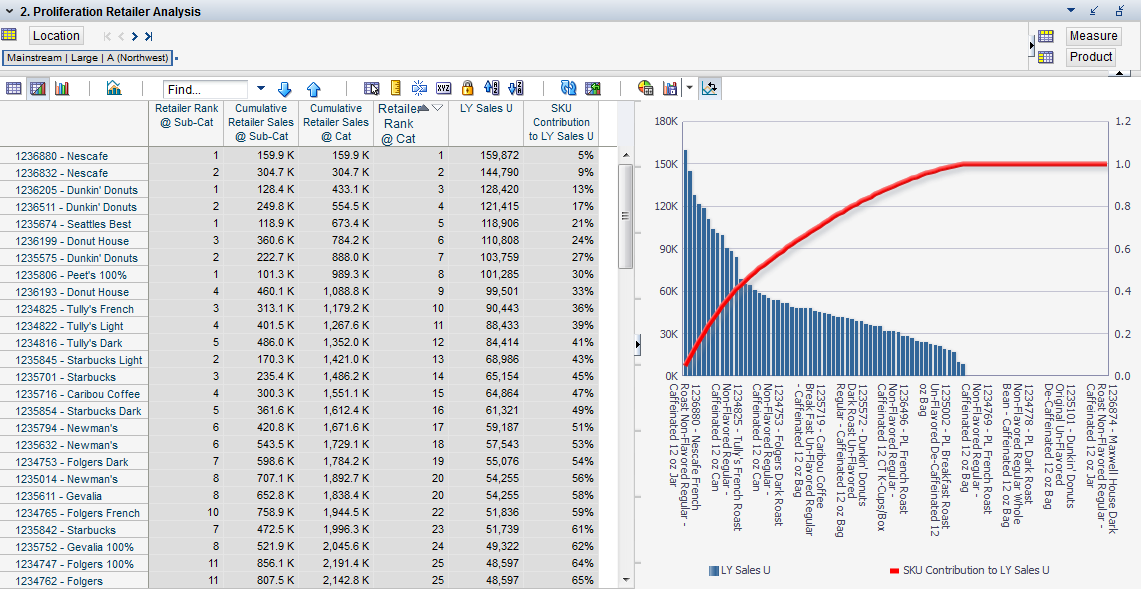
The number of items required to reach a pre-set breakpoint percentage sales level of total retailer sales. For example in Figure 7-25, 7 SKUs contribute to 50 percent of retailer sales and 12 SKUs contribute to 61 percent of retailer sales for ground coffee. |
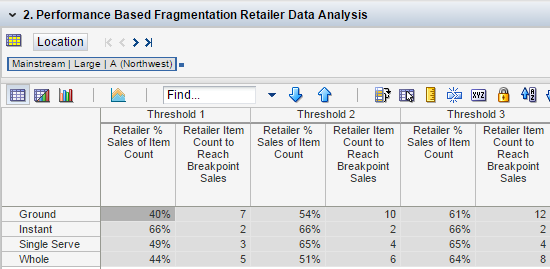
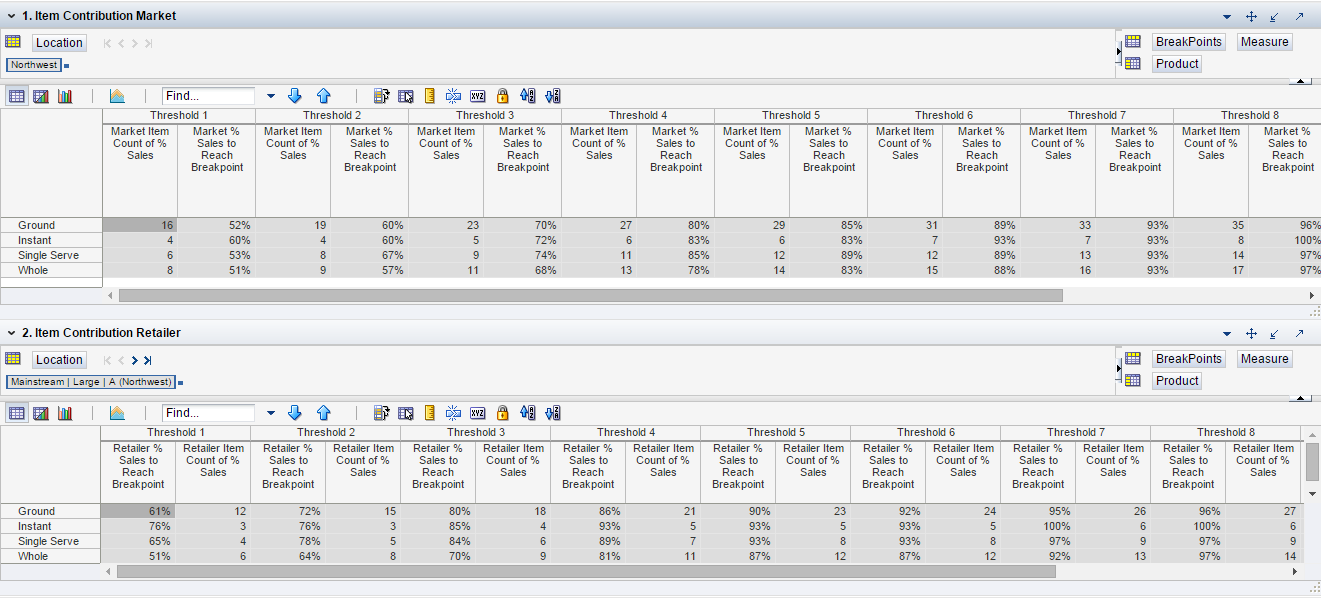
Item contribution analyzes the contribution of items to category/sub-category sales. For example, what is the contribution of 50 percent of the top selling SKUs to the total category sales? Here the breakpoints apply to the percentage of SKUs instead of sales. Figure 7-16 shows the views for this tab.
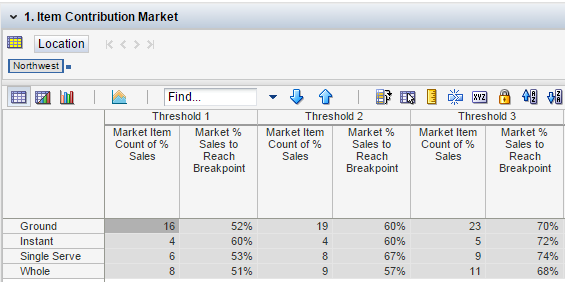
Use this view to analyze the contribution of SKUs to total Market Category Sales U, Sales R, Gross Profit and so on, based on the user-selected performance metric.
Table 7-10 1. Item Contribution Market Measures
| Label | Definition |
|---|---|
|
Market Item Count % of Sales |
Market coverage represented in percentage figures by a set of items from the assortment. This is best viewed at the category level. Breakpoints are defined for this measure to view the fragmentation analysis. |
|
Market % Sales to Reach Breakpoint |
The actual percentage of market sales (or market coverage in a trading area) reached to achieve the preset breakpoint sales level. |
Table 7-10 lists the measures available in this view.
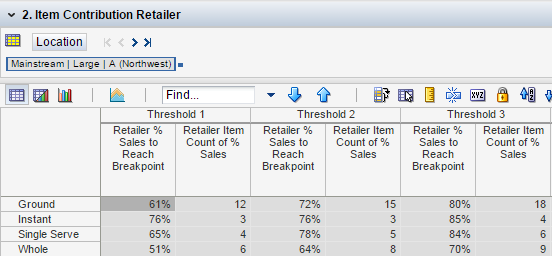
Use this view to analyze the contribution of SKUs to total Retailer Category Sales U, Sales R, Gross Profit, and so on, based on the user-selected performance metric.
Table 7-11 lists the measures available in this view.
Table 7-11 2. Item Contribution Retailer Measures
| Label | Definition |
|---|---|
|
Retailer % Sales to Reach Breakpoint |
The percentage of retailer sales (trading area sales) achieved by the number of SKUs that correspond to the preset breakpoint. Note the breakpoint is expressed as a percentage of SKU count. |
|
Retailer Item Count of % Sales |
SKU count corresponding to each breakpoint (where the breakpoint is expressed as a percentage of retailer SKU counts). |
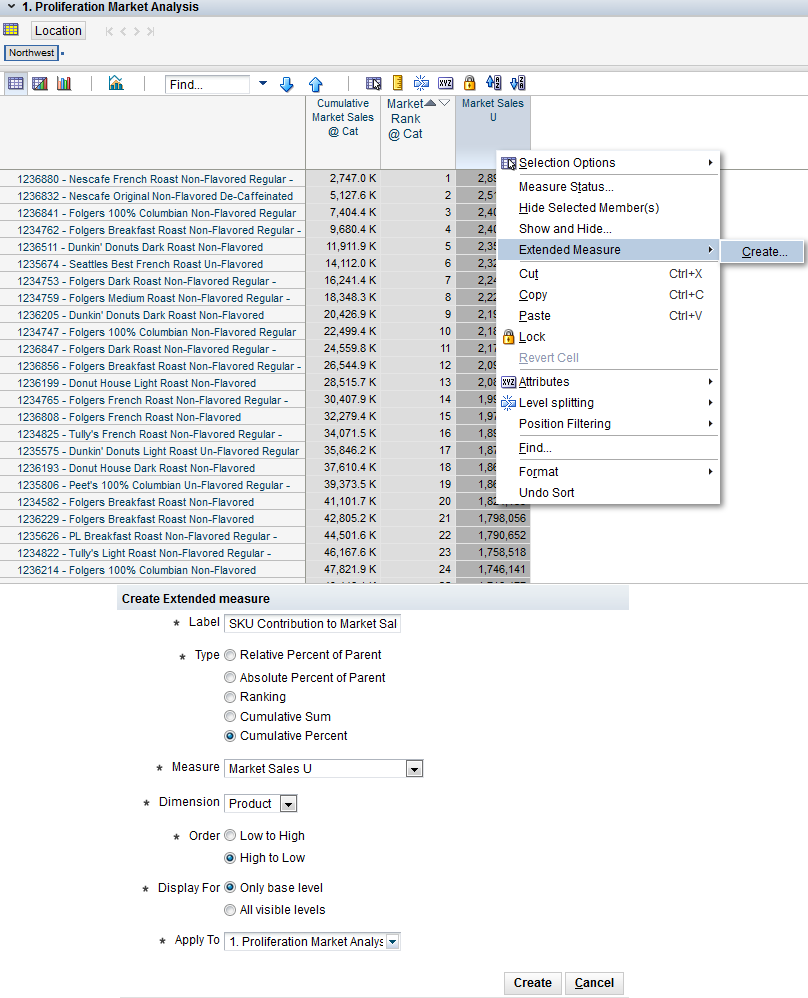
Proliferation Analysis provides a view to analyze cumulative sales across the product hierarchy against the SKU count.
This view is achievable by first creating an extended measure from Market Sales U as a Cumulative Percentage measure called SKU Contribution to Market Sales, with the Order specified as High to Low. This is shown in Figure 7-20.
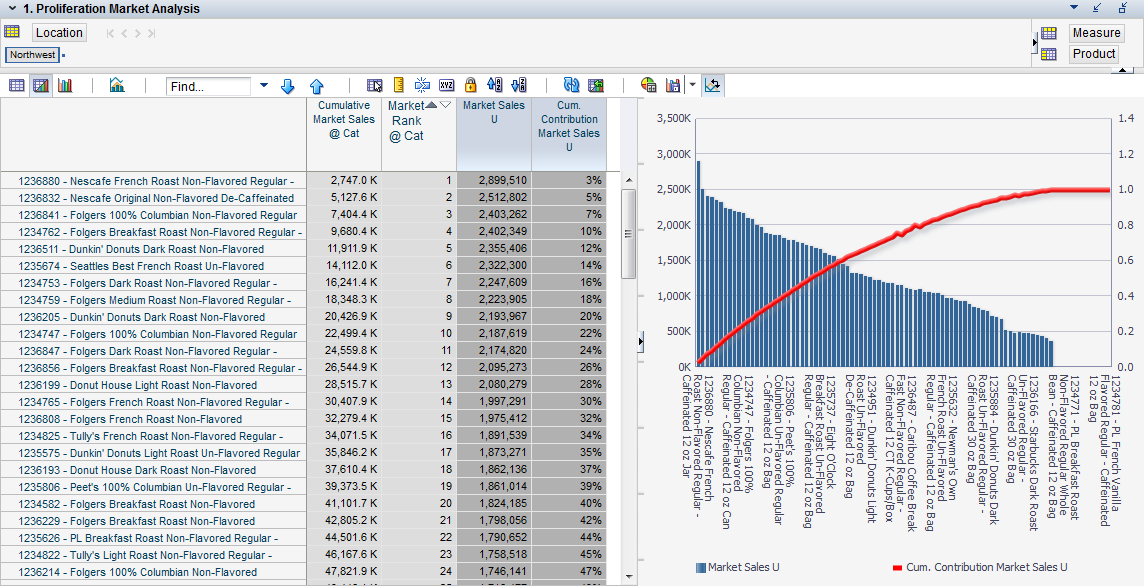
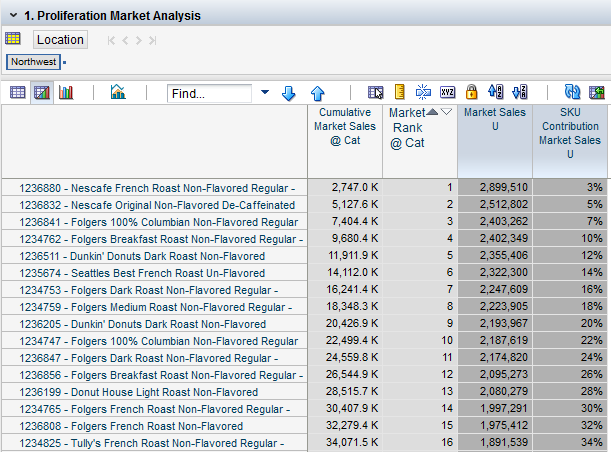
Figure 7-21 shows the Proliferation Market Analysis view updated with the extended measure.
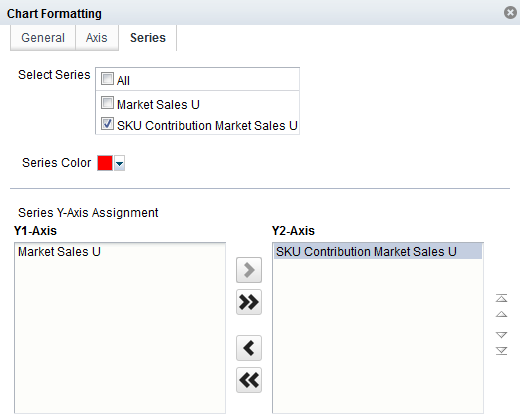
When viewing the data in split view as a combination chart on Market Sales U and SKU Contribution Market Sales U measures, be sure to change the axis to a dual y-axis from the chart formatting options shown in Figure 7-22.
Use this view to analyze the cumulative contribution of SKUs towards the overall market sales. Cumulative market actual sales are presented against the SKU count. A forecast is not available for market sales. This information is best displayed as a Pareto chart. For an example of this view, see Figure 7-19.
Table 7-12 lists the measures available in this view.
Table 7-12 1. Proliferation Market Analysis Measures
| Label | Definition |
|---|---|
|
Cumulative Market Sales @ Sub-Cat Cumulative Market Sales @ Cat |
Used in proliferation analysis under market analysis. It reflects the cumulative sales quantity of the market at the category or sub-category level. It is shown against the number of items to analyze the market coverage from a sales quantity perspective. |
Use this view to analyze the cumulative contribution of SKUs towards a retailer's sales. The cumulative retailer's actual sales are presented against the SKU count. This information is best displayed as a Pareto chart.
Table 7-13 lists the measures available in this view.
Table 7-13 2. Proliferation Retailer Analysis Measures
| Label | Definition |
|---|---|
|
Cumulative Retailer Sales @ Sub-Cat Cumulative Retailer Sales @ Cat |
Used in proliferation analysis under retailer analysis. It reflects the cumulative sales quantity of the retailer at the category or sub-category level. It is shown against the number of items to analyze the market coverage from a sales quantity perspective. The sales quantity is based on the user-selected performance metric driver. |
|
Retailer Rank @ Cat Retailer Rank @ Sub-Cat |
Rank of the SKU based on the user-selected performance metric driver. |
Accumulative ranking analysis provides a view to the cumulative sales of a category and sub-category compared with the rank of a SKU in the sub-category based on its sales contribution to the category or sub-category. It compares the rank of a SKU in the sub-category and its rank in the overall category. This analysis, like all other analysis, is available at the retailer level and in market context.
Use this view to create an accumulation ranking report for the market.
Table 7-14 lists the measures available in this view.
Table 7-14 1. Accumulative Market Analysis Measures
| Label | Definition |
|---|---|
|
Cumulative Market Sales @ Sub-Cat |
Reflects the cumulative sales quantity of the market at the sub-category level. It is shown against the number of items to analyze the market coverage from a sales quantity perspective. |
|
Market Rank @Sub Cat |
Rank of the SKU within the sub-category in the market based on the user-selected performance metric driver for Market Data Analysis. |
Use this view to create an accumulation ranking report for the retailer.
Table 7-15 lists the measures available in this view.
Table 7-15 2. Accumulative Ranking Retailer Analysis Measures
| Label | Definition |
|---|---|
|
Cumulative Retailer Sales @ Sub Cat |
Reflects the cumulative sales quantity of the retailer at the sub-category level. It is shown against the number of items to analyze the market coverage from a sales quantity perspective. |
|
Retailer Rank @ Sub Cat |
Rank of the SKU within the sub-category based on the user-selected performance metric driver for Retailer Data Analysis. |
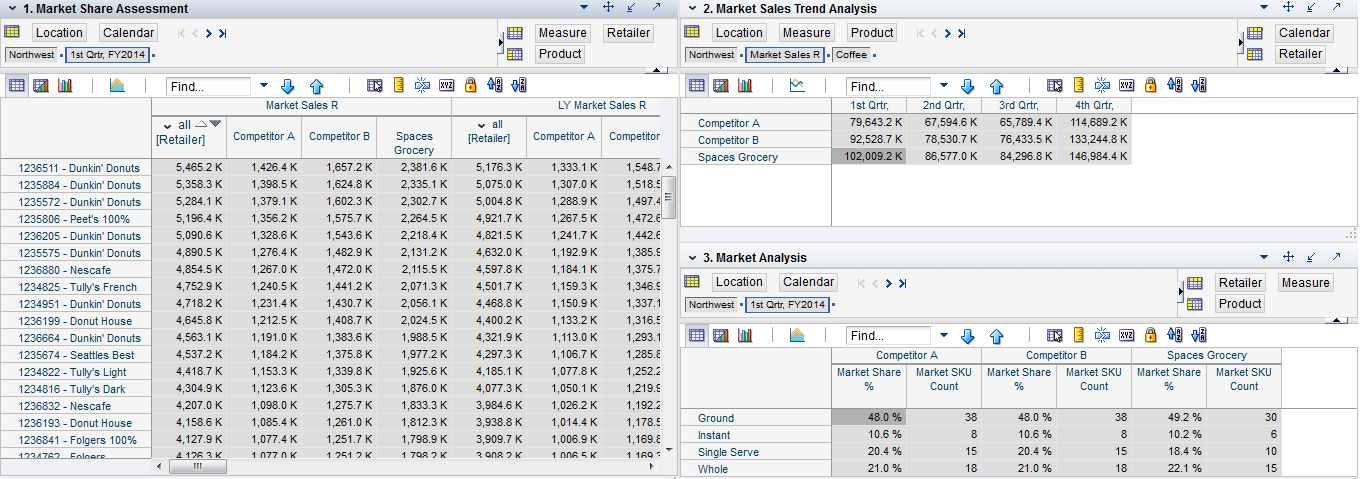
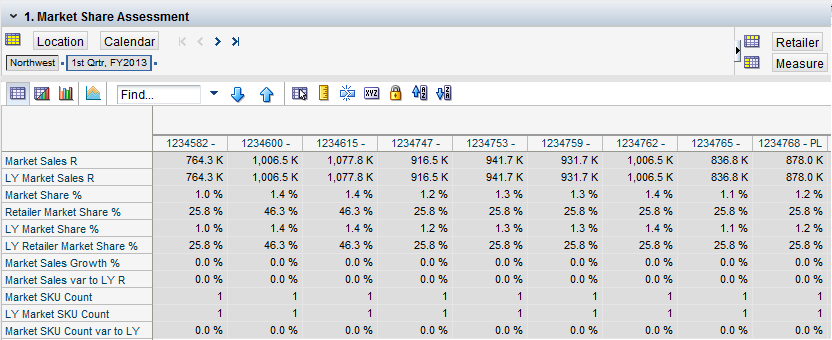
The Market Assessment tab provides a snapshot about the retailer's standing in the market compared with its main competitors and the rest of the market. The user is able to assess the retailer's relative position to the market in terms of various retail business parameters such as market share, market growth, and other market trends. Figure 7-26 shows the views for this tab.
Use this view to analyze the market shares and growth rates of the retailer compared with its competitors individually and the rest of the market at the item level.
Table 7-16 lists the measures available in this view.
Table 7-16 1. Market Share Assessment Measures
| Label | Definition |
|---|---|
|
Market Sales R |
The sales retail value of the merchandise in the market, typically at the trading area level or above. This information is sourced from third parties providing syndicated data such as, Nielsen, IRI, and so on, on a quarterly basis. |
|
LY Market Sales R |
Last year's sales retail value of the merchandise in the market, typically at the trading area level or above. This information is sourced from third parties providing syndicated data such as, Nielsen, IRI, and so on, on a quarterly basis. Note, when planning ahead, since Market data is not available for future time-frames, the LY version of market data can be leveraged to gain insights on market data, same time last year. |
|
Market Share % |
The quantum or percentage of sales generated by a particular product or a product segment (such as a sub-category) towards the overall sales retail of the sub-category, category, and so on. |
|
Retailer Market Share % |
The retailer's sales retail value share of the overall market for a sub-category or a category. |
|
LY Market Share % |
Last year's percent of sales volume (dollars or units) that a particular category, product segment, or item contributes to all the sales volume in the market. |
|
LY Retailer Market Share % |
The retailer's last year's sales retail value share of the overall market for a sub-category or category during the same time period. |
|
Market Sales Growth % |
The percentage increase or decrease in sales retail volume for the entire market compared to the previous time period. |
|
Market Sales var to LY R |
The variance of sales retail for the market compared with last year's market sales retail. |
|
Market SKU Count |
The total number of SKUs selling in the market, typically at the trading area level or above. This information is sourced from third parties providing syndicated data such as, Nielsen, IRI, and so on, on a quarterly basis. |
|
LY Market SKU Count |
The total number of SKUs selling in the market (typically at the trading area level or above) in last year's time frame. It is sourced from third parties providing syndicated data such as Nielsen, IRI, and so on, on a quarterly basis. |
|
Market SKU Count var to LY |
Market's SKU count variance to the SKU count in last year's assortment. |
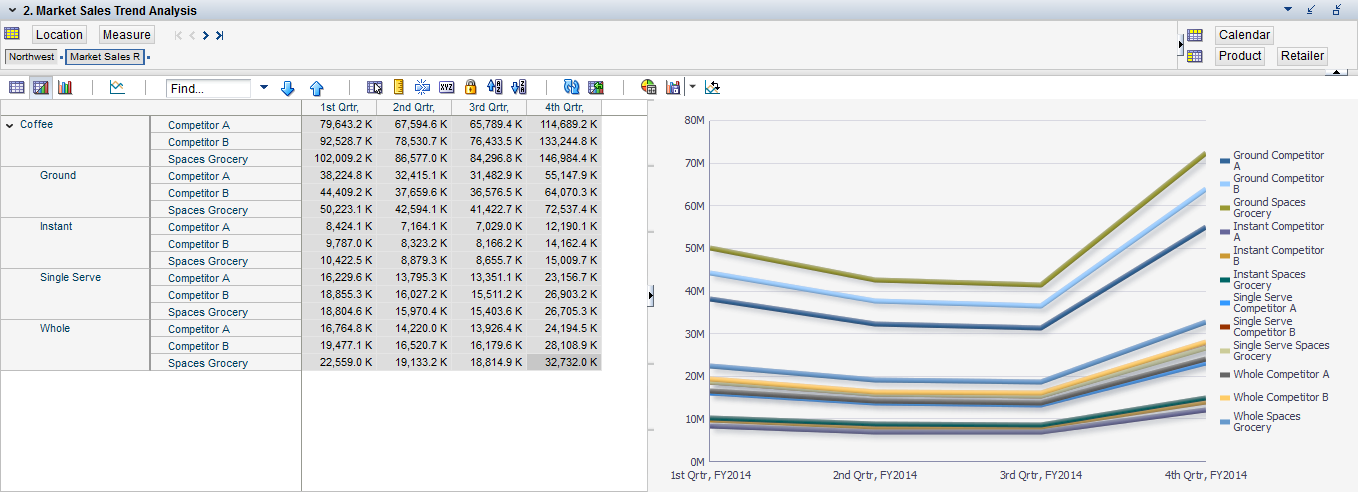
Use this view to analyze trends to see the variance between the retailer's sales, gross profit, and growth compared with the competition over a period of time.
Table 7-17 lists the measures available in this view.
Table 7-17 2. Market Sales Trend Analysis Measures
| Label | Definition |
|---|---|
|
Market Sales R |
The sales retail value of the merchandise in the market, typically at the trading area level or above. This information is sourced from third parties providing syndicated data such as, Nielsen, IRI, and so on, on a quarterly basis. |
|
Market Sales U |
The sales units of the merchandise in the market, typically at the trading area level and above. This information is sourced from third parties providing syndicated data such as, Nielsen, IRI, and so on, on a quarterly basis. |
|
WP Sales R |
The working plan assortment's sales retail value. |
|
WP Sales U |
The working plan assortment's sales units. |
|
WP Sales AUR |
Average unit retail value for an item in a working plan. It reflects the average selling price of a SKU at different product hierarchy levels in the working plan assortment. |
|
WP Gross Profit R |
The gross profit retail from the merchandise in the working plan assortment. This measure is different from the WP Assort Gross Profit R measure as it reflects gross profit retail for all items irrespective of whether or not these items are part of the working plan assortment. |
|
WP Gross Profit % |
The gross profit percentage from the merchandise in the working plan assortment. This measure is different from the WP Assort Gross Profit % measure as it reflects gross profit percentage for all items irrespective of whether or not these items are part of the working plan assortment. |
|
LY Market Sales R |
Last year's sales retail value of the merchandise in the market, typically at the trading area level or above. This information is sourced from third parties providing syndicated data such as, Nielsen, IRI, and so on, on a quarterly basis. |
|
LY Market Sales U |
Last year's sales units of the merchandise in the market, typically at the trading area level or above. It is sourced from third parties providing syndicated data such as, Nielsen, IRI, and so on, on a quarterly basis. |
|
Market Sales Growth % |
The percentage increase or decrease in sales retail volume for the entire market compared to the previous time period. |
|
LY Sales U |
Last year's assortment's sales units. |
|
LY Sales R |
Last year's assortment's sales retail value. |
|
LY Sales AUR |
Last year's actual average unit retail value of a SKU. It reflects the average selling price of a SKU at a specific product hierarchy level based on last year's actual sales. |
|
WP Sales var to LY R |
Sales retail value's variance between working plan and last year's actuals. |
|
WP Sales var to LY U |
Sales units' variance between working plan and last year's actuals. |
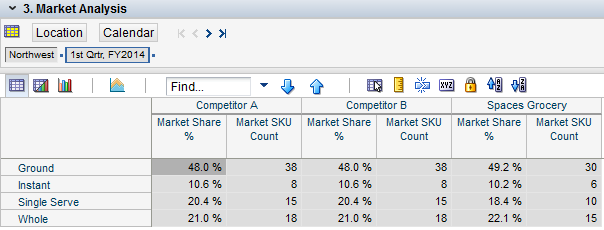
Use this view to understand the market coverage information in the form of SKU count to meet a specific market share level for the retailer compared with the competition. This view is available at the sub-category level.
Table 7-18 lists the measures available in this view.
Table 7-18 3. Market Analysis Measures
| Label | Definition |
|---|---|
|
Market Share % |
The quantum or percentage of sales generated by a particular product or a product segment, such as a sub-category, towards the overall sales retail of the sub-category, category, and so on. |
|
Market SKU Count |
The total number of SKUs selling in the market, typically at the trading area level or above. This information is sourced from third parties providing syndicated data on a quarterly basis. |
|
LY Assort SKU Count |
The total number of SKUs in last year's assortment. |
|
WP Assort SKU Count |
The total number of SKUs in the working plan's assortment for the cluster. |
|
LY Market SKU Count |
The total number of SKUs selling in the market, typically at the trading area level or above, in last year's time frame. It is sourced from third parties providing syndicated data such as Nielsen, IRI, and so on, on a quarterly basis. |
|
Market SKU Count var to LY |
The market's SKU count variance to the SKU count in last year's assortment. |
|
WP Assort SKU Count var to LY |
The Working Plan Assortment's SKU count variance to the SKU count in last year's assortment. |
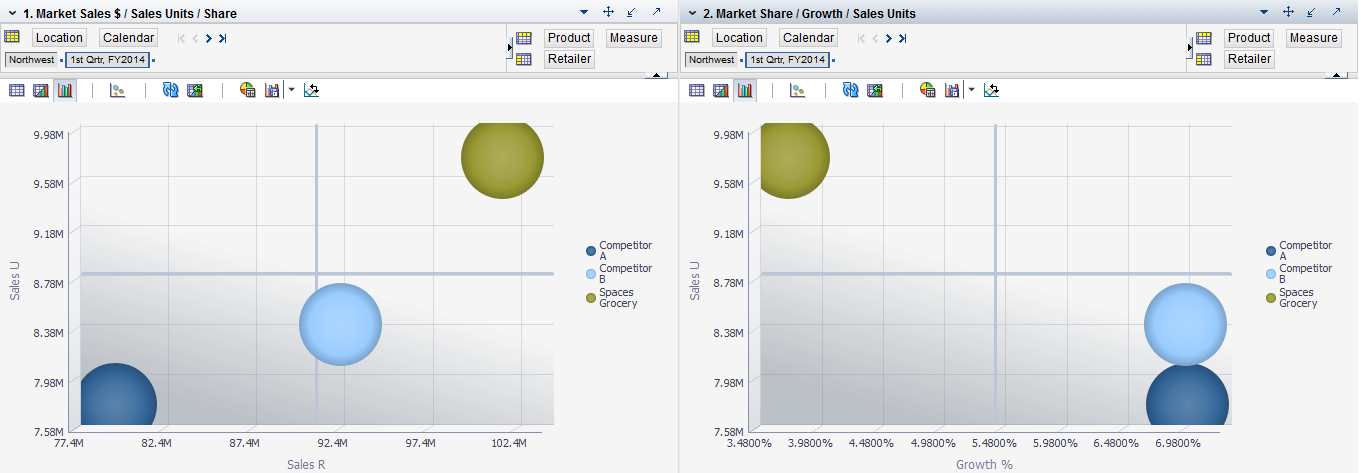
Figure 7-30 shows the views for this tab.
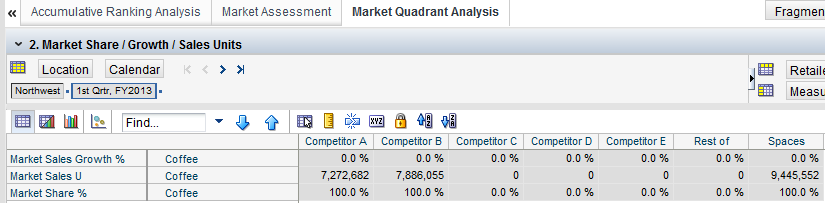
Analyzing in quadrants provides a view of how the retailer is performing compared to the competition and rest of market. For example, Space Grocery is in the higher Sales R and Sales U quadrant; however, from a market growth percentage perspective, it is lagging its competition.
Use this view to see Market Sales R, Market Sales Units and Market Share % at the category level to gain a relative understanding of the category's business from a large market perspective where the retailer is competing. For an example of this view, see Figure 7-30.
Table 7-19 lists the measures available in this view.
Table 7-19 1. Market Sales $ / Sales Units / Share Measures
| Label | Definition |
|---|---|
|
Market Sales R |
The sales retail value of the merchandise in the market, typically at the trading area level or above. This information is sourced from third parties providing syndicated data such as, Nielsen, IRI, and so on, on a quarterly basis. |
|
Market Sales U |
The sales units of the merchandise in the market, typically at the trading area level and above. This information is sourced from third parties providing syndicated data such as, Nielsen, IRI, and so on, on a quarterly basis. |
|
Market Share % |
The quantum or percentage of sales generated by a particular product or a product segment (such as a sub-category) towards the overall sales retail of the sub-category, category, and so on. |
Use this view to see the Market Share %, Market Growth, and Market Sales Units at the category level to gain a relative understanding of the category's business from a larger market perspective where the retailer competes.
Table 7-20 lists the measures available in this view.
Table 7-20 2. Market Share / Growth / Sales Units Measures
| Label | Definition |
|---|---|
|
Market Sales Growth % |
The percentage increase or decrease in sales retail volume for the entire market compared to the previous time period. |
|
Market Sales U |
The sales units of the merchandise in the market, typically at the trading area level and above. This information is sourced from third parties providing syndicated data such as, Nielsen, IRI, and so on, on a quarterly basis. |
|
Market Share % |
The quantum or percentage of sales generated by a particular product or a product segment (such as a sub-category) towards the overall sales retail of the sub-category, category, and so on. |
This step has the following tabs and views:
What is the Consumer Purchasing and How Loyal are They? Tab:
1. Purchase Behavior Analysis View
Where is the Consumer Purchasing? Tab:
This tab has one view.
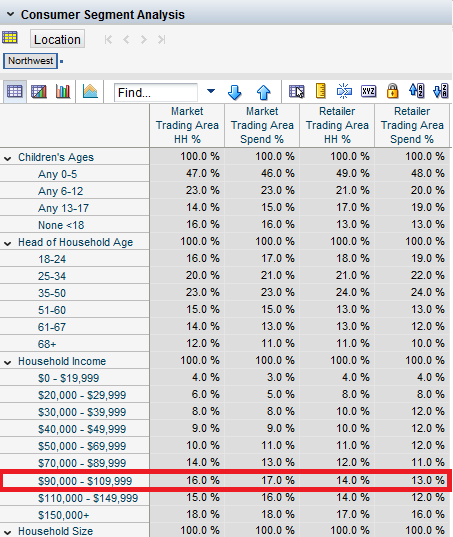
Use this view to see the consumer segment breakdown of the market where the retailer is competing. This information is available at the trading area level. This data is sourced from third party syndicated data suppliers and provides an understanding of the composition of the market or trading area in terms of consumer profiles. Consumer profiles typically represent a combination of demographic and life stage attributes of the consumers shopping the market or trading area. In Figure 7-32, the consumers are profiled based on their children's ages, head of household age, household income, and household size. Frequently, a combination of these attributes is used to develop life stage-based consumer segments such as Empty Nesters, Middle Aged Family, and so on.
For example, the 90,000-109,000 household income group represents 16 percent of the market and they encompass 17 percent of the total spend in the market; however, they only represent 14 percent of the retailer's consumers and 13 percent of the spend at the retailer. So this could present an opportunity of growth for the retailer.
Table 7-21 lists the measures available in this view.
Table 7-21 Consumer Segment Analysis Measures
| Label | Definition |
|---|---|
|
Market Trading Area HH % |
The percentage of market households that belong to a specific consumer segment profile. |
|
Market Trading Area Spend % |
The percentage of overall market spend produced by a specific consumer segment profile. |
|
Retailer Trading Area HH % |
The percentage of market households which shop at the retailer and belong to a specific consumer segment profile. |
|
Retailer Trading Area Spend % |
The share of spend by this consumer profile at the retailer. |
This tab contains three views.
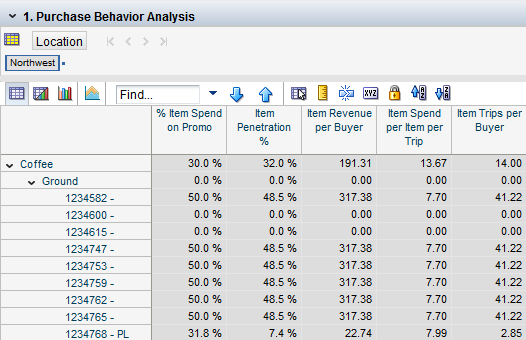
Use this view to analyze the contribution of sales and profits from each sub-category to the category total.
Table 7-22 lists the measures available in this view.
Table 7-22 1. Purchase Behavior Analysis Measures
| Label | Definition |
|---|---|
|
% Item Spend on Promo |
The percentage of an item's total sales generated when the item was put on a promotion. |
|
Item Penetration % |
The percentage of households from a trading area (market or region) that purchased an item or an item from a product group (such as a sub-category or a category) at least once within a given time frame. This is presented at the sub-category or category level. |
|
Item Revenue per Buyer |
An item's average retail sales per customer, buyer, or shopper. |
|
Item Spend per Item per Trip |
An item's retail sales value per customer's trip. |
|
Item Trips per Buyer |
The average number of times a customer makes a shopping trip for a particular item or a set of merchandise. |
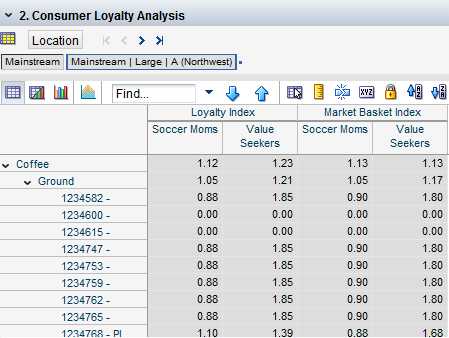
Use this view to identify the level of loyalty the consumers have to product segments, brands, and individual SKUs within a given trading area.
Table 7-23 lists the measures available in this view.
Table 7-23 2. Consumer Loyalty Analysis Measures
| Label | Definition |
|---|---|
|
Loyalty Index |
This is a loaded measure and calculation happens outside RCM. The share of annual category requirements that the consumer is able to satisfy with a single brand (size, type, flavor, and so on). For example, if a consumer makes 10 purchases annually in a given category, 3 of which are made of Brand A, Brand A would have a 30 percent loyalty, (3/10 = 30%). This measure enables the distributor to discriminate in favor of those items for which targeted consumers have shown a higher loyalty to purchase versus other products within the category. The discontinuation of these products could result in the target consumer leaving the store. Loyalty is converted into an index by comparing (dividing) the loyalty of Brand A by the average loyalty of all brands within the category. Loyalty and the loyalty index can be measured at all levels of data analysis (brand, size, flavor, SKU, and so on). |
|
Market Basket Index |
This measure is an index measure (with an index to average calculation) indicating the ability of a SKU/Item to drive other customer purchases. This measure is indicative of the units in a basket and value of a basket on an average. It is generally sourced from third party syndicate data providers and derived from Household panel data or Home-scan data. It can also be derived from the retailer's Market Basket Analysis. It is also used in IPI score calculations. |
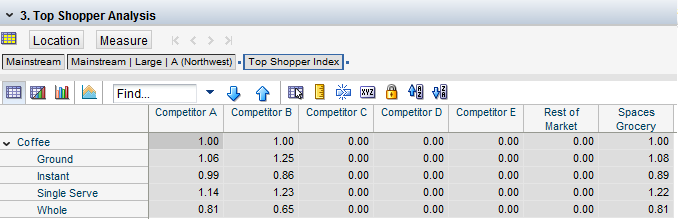
Use this view to compare the top shopper index (TSI) of the retailer in relation to other retailers. A high value of TSI indicates that most of the top shoppers at the retailer purchase that particular sub-category. Refer to the measure definition for more details.
Table 7-24 lists the measure available in this view.
Table 7-24 3. Top Shopper Analysis Measure
| Label | Definition |
|---|---|
|
Top Shopper Index |
The sales volume of a sub-category generated by top shoppers at the retailer. It is pre-calculated and loaded into RCM. It is sourced from CRM solutions at the retailer. Top shoppers are the customers who are most loyal and bring a high volume of business to the retailer. In other words, these customers purchase very frequently at the retailer and contribute a significant share in retailer's business as per customer loyalty data. It is often used as a check before de-listing items or sub-categories from the assortment. If TSI is high, it means that top shoppers at the retailer buy the sub-category very often. It is calculated using an index-to-average method. |
This tab contains two views.
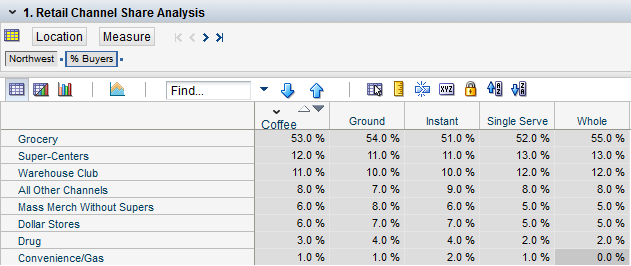
Use this view to see the breakdown of sales among different retail channels or formats in the market. Different retail channels or formats consist of supermarkets, drug stores, super-centers, warehouse clubs, and so on.
In Figure 7-36, a majority of the shoppers purchase their coffee at Grocery stores (53 percent), followed by Super Centers (12 percent), and then Warehouse Clubs (11 percent).
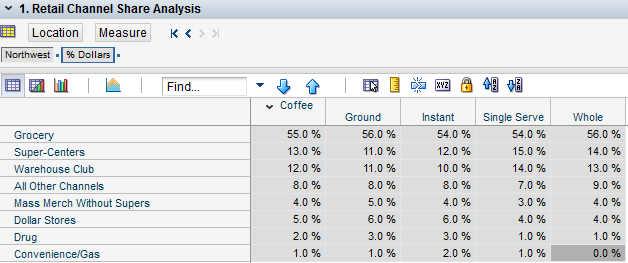
Figure 7-37 corresponds with the percentage of dollars spent at each channel on coffee, with Grocery stores being 55 percent of their total dollars spent followed by Super Centers at 13 percent, and so on.
Table 7-25 lists the measures available in this view.
Table 7-25 1. Retail Channel Share Analysis Measures
| Label | Definition |
|---|---|
|
% Buyers |
The percentage of total buyers (shoppers or customers) in a market who purchase from a retail channel. This measure is available at the trading area level and SKU level. |
|
% Dollars |
The percentage of buyer's spend (customer spend or shopper's spend) in a retail channel. This measure is available at the trading area level and SKU level. |
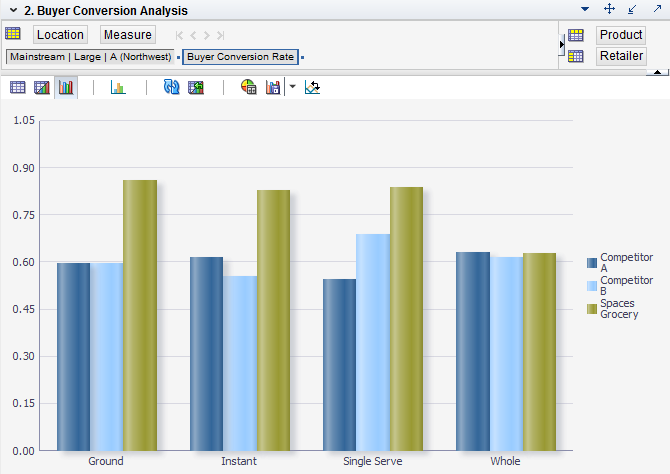
Use this view to identify buyer conversion rates consumers have to product segments (such as categories and sub-categories), brands, and individual SKUs within a trading area.
This view enables users to compare the retailer's buyer conversion rates to their competition. For example, in Figure 7-38, the Spaces Grocery retailer leads its competition in conversion rates for Ground, Instant, and Single Serve, but is on par for Whole bean coffee.
Table 7-26 lists the measure available in this view.
This step has the following tabs and views:
This tab has three views.
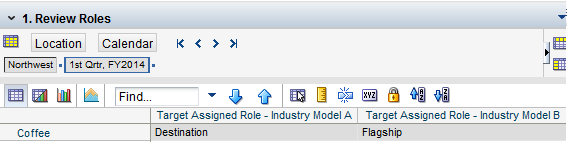
Use this view to review the approved roles of a category in a trading area as defined in category planning.
Table 7-27 lists the measures available in this view.
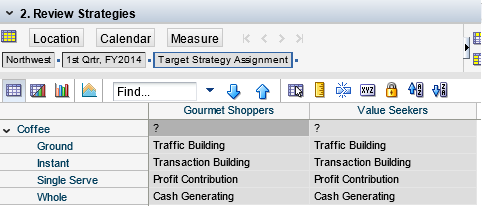
Use this view to review the approved strategies of a category in a trading area as defined in category planning.
Table 7-28 2. Review Strategies Measure
| Label | Definition |
|---|---|
|
Target Strategy Assignment |
Strategy assignment to a sub-category or category as per the approved category plan. |
Table 7-28 lists the measure available in this view.
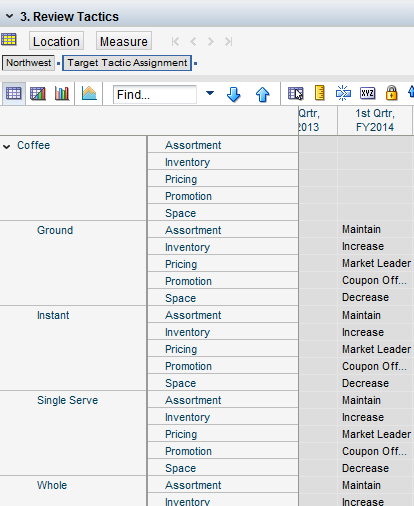
Use this view to review the approved tactics of a category in a trading area as defined in category planning.
Table 7-29 lists the measure available in this view.
This tab has two views.
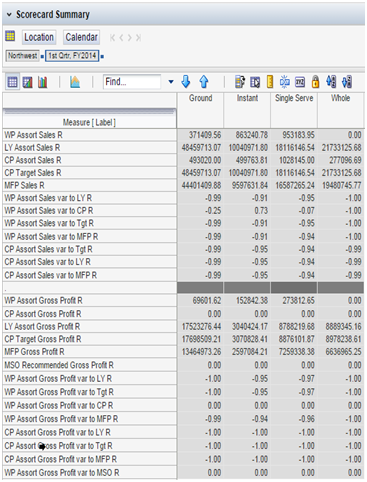
Use this view to review a summary of the key measures that determine the go-forward category strategy. These measures consist of targets from MFP, CP, and MSO results. MSO results consist of recommended space and profit for the sub-categories. Assortment plans are created in alignment with these measures.
Table 7-30 lists the measures available in this view.
Table 7-30 Scorecard Summary Measures
| Label | Definition |
|---|---|
|
WP Assort Sales R |
The sales retail value in the working plan's assortment for the cluster. |
|
LY Assort Sales R |
The sales retail value in the last year's assortment. |
|
CP Assort Sales R |
The sales retail value in the current plan assortment for the cluster. |
|
CP Target Sales R |
The approved and targeted sales retail value for a category or sub-category at the trading area level in the category plan. |
|
MFP Sales R |
Merchandise Financial Plan's sales retail value. |
|
WP Assort Sales var to LY R |
The working plan assortment's sales retail value's variance to the same in last year's actuals. |
|
WP Assort Sales var to CP R |
The working plan assortment's sales retail value's variance to the same in the current plan. |
|
WP Assort Sales var to Tgt R |
The working plan assortment's sales retail value's variance to the same in the target plan (approved category plan). |
|
CP Assort Sales var to Tgt R |
The current plan assortment's sales retail values variance to the same in the target plan (approved category plan). |
|
CP Assort Sales var to LY R |
The current plan assortment's sales retail value's variance to the same in last year's actuals. |
|
WP Assort Gross Profit R |
The gross profit retail value in a working plan's assortment for the cluster. Gross Profit Retail is the difference between Sales Retail and Cost of Goods Sold (COGS). |
|
CP Assort Gross Profit R |
The gross profit retail value in a current plan assortment for the cluster. Gross Profit Retail is the difference between Sales Retail and Cost of Goods Sold. |
|
LY Assort Gross Profit R |
The gross profit retail value in last year's assortment for the cluster. Gross Profit Retail is the difference between Sales Retail and Cost of Goods Sold. |
|
CP Target Gross Profit R |
The approved and targeted gross profit retail for a category or sub-category at the trading area level in the category plan. |
|
MFP Gross Profit R |
Merchandise Financial Plan's gross profit retail value. |
|
MSO Recommended Gross Profit R |
Recommended gross profit retail value from the MSO results at sub-category level. |
|
MSO Recommended Space |
Recommended space in linear units from the MSO results at sub-category level. |
|
WP Assort Gross Profit var to LY R |
The working plan assortment's gross profit value's variance to the same in last year's actuals. |
|
WP Assort Gross Profit var to Tgt R |
The working plan assortment's gross profit value's variance to the same in the target plan (approved category plan). |
|
WP Assort Gross Profit var to CP R |
The working plan assortment's gross profit value's variance to the same in the current plan. |
|
CP Assort Gross Profit var to LY R |
The current plan assortment's gross profit retail value's variance to the same in last year's actuals. |
|
CP Assort Gross Profit var to Tgt R |
The current plan assortment's gross profit value's variance to the same in the target plan (approved category plan). |
This tab has one view.
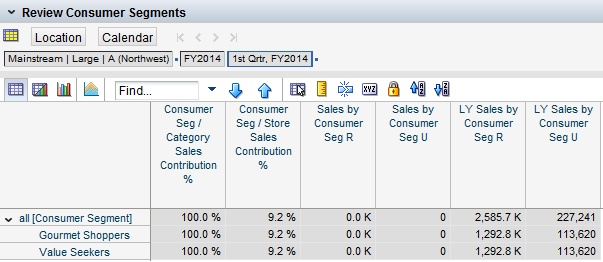
Use this view to review the customer segments' distribution and performance details.
Table 7-31 lists the measures available in this view.
Table 7-31 Review Consumer Segments Measures
| Label | Definition |
|---|---|
|
Consumer Seg / Category Sales Contribution % |
Contribution of a particular consumer segment to a category's retail sales. |
|
Consumer Seg / Store Sales Contribution % |
Contribution of a particular consumer segment's contribution to a store's retail sales. |
|
Sales by Consumer Seg R |
The sales retail value consumed by a specific consumer segment. |
|
Sales by Consumer Seg U |
The sales units consumed by a specific consumer segment. |
|
Consumer Seg Distribution |
The percentage of each consumer segment currently shopping the store cluster for the category on an average. |
|
LY Sales by Consumer Seg R |
The sales retail contribution in percentage points by a consumer segment to the overall sales retail in last year's assortment. |
|
LY Sales by Consumer Seg U |
The sales units' contribution in percentage points by a consumer segment to the overall sales units in last year's assortment. |
After completing the Review Category Scorecard activities, continue with the Assortment Planning at Cluster Task.