| Oracle® Retail Assortment & Item Planning for Fashion/Softlines Cloud Service User Guide Release 19.0 F24864-08 |
|

 Previous |
 Next |
| Oracle® Retail Assortment & Item Planning for Fashion/Softlines Cloud Service User Guide Release 19.0 F24864-08 |
|
Previous |
Next |
In the Build Wedge task, the Buyer picks up the Assortment process from the Senior Buyer who has gone to market. In building the wedge, the Buyer makes decisions on the Style-Color level Assortment:
Style-Color Level Assortment - In the Build Wedge task, the Buyer can use AP's Wedge Population Automation to select the appropriate style-colors from a group of eligible style-colors to meet each Cluster's Assortment Strategy (also referred to as Building the Wedge). This automation is optimized to satisfy the wedge goal by using the key attributes set by the buyer. The Demand Transference module has been provided, leveraging science to further refine the assortment to meet the business goals best possible way. Demand Transference optimizes the assortment by bringing in any other high-performing style colors, if any, beyond the attributes specified by the buyer. This automation works in near real time to enable the Buyer to tailor each wedge in a short period.
In the next step, Buy Planning, the Senior Buyer or Buyer plans Sales, Margin or Markdowns, Inventory and Receipts for their assortment based on the Assortment Strategy and Wedge Population.
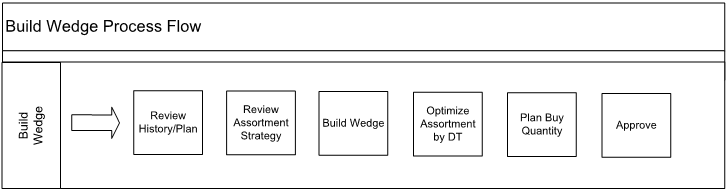
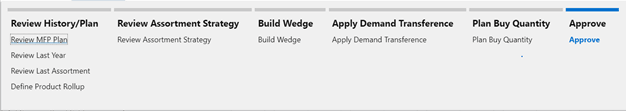
The high-level Build Wedge process flow includes reviewing historical information, building the wedge, refine the wedge further by Demand transference logic, Plan Buy Quantities, and finally, approving the assortment.
The typical business user who completes this task will be an Assortment Planner.
Last year sales data
Last Assortment sales data
Current plan data from MFP
Current plan data from AP (Shopping List)
Location hierarchy
Product hierarchy
Calendar hierarchy
Sales Retail, Sales Unit, and Cost actuals
Style/Color (Item/Option) attributes and attribute values
Style/Color (Item/Option) images loaded by the Administrator (optional)
When working in a segment, it is a common practice to keep the wizard selections for the segment size limited to what will be worked on, to facilitate navigation and increase UI responsiveness. It is important to plan the wedge keeping product type as one of the decision drivers so that assortments are the right mix and have the right quantity of basics and seasonal items.
To create the Build Wedge segment:
Click Assortment Services in the Task menu. Then, click the Planning Services activity and then the Build Wedge task.
The dialog to create New Plan opens. Click Create New Plan.
Enter the Plan Label into the text field. Click Ok.
In Select Product, select one or multiple subcategories and click Next.
In Select Assortment Period, select any one Assortment Period and click Next:
The Assortment Groups visible in the wizard are pre-ranged to the subcategories selected in the previous screen.
To see the user-defined Assortment Period label, click the Dimension tile and select Assortment Label.
|
Note: Assortment Labels can vary by Sub-class. If multiple subcategories are selected, the label shown will be based on the first order Sub-class. |
Click Finish. The Build Wedge segment is built.
The high-level steps to complete this process:
Review the approved shopping list plan.
Perform Last Year/Assortment Analysis of Sales, Gross Margin, Option Count, and Rate Of Sales.
Review the Attribute mix for the Target number of Options at cluster level.
Build Wedge by selecting the Options into the assortment.
Plan Buy Quantities at the assortment period level.
Approve the assortment.
The first step in the Build Wedge process is Review History/Plan. The planner can review the history of Last Year or Last Assortment Sales, Gross Margin, Option Count, and Rate of Sales along with the plan targets.
In this step, the Buyer has access to a variety of historical and plan information as shown in the following list. This information is intended to provide a complete picture of what needs to be accomplished by this assortment and what has been accomplished by prior assortments, both in terms of sales/profitability and in terms of key trends and attributes that define each assortment.
Tabs and Views in this Step:
In this tab, the Buyer/Planner is able to review the MFP Targets.
The Senior Buyer is able to view the planned sales (from the Merchandise Financial and/or Location Plan) and profitability for the time periods covered at the intersection of Subclass (or higher), Assortment Period, and Cluster (or higher) level. In the Administrative section, the Merchandise Financial Plan and Location Plans (or LP) are spread down to the Subclass, Week, and Cluster levels (if they were not created originally at this level).
Measure Table
Table 12-1 3. Review MFP Targets View Measures
| Label | Definition |
|---|---|
|
MFP Sales Reg+Promo R, U, C, AUR, AUC |
MFP Current Plan Full Price Sales Retail, Units, and Average Unit Retail by Sub-class, store, and week. |
|
% to MFP Sales Reg+Promo R, U |
The percentage of MFP Full Price Sales Retails and Units of the specified Sub-class to the sales of all the subcategories. |
|
MFP GM R, GMR % |
MFP Current Plan Gross Margin Retail and Gross Margin Percent. |
|
MFP Clr Sales R, U, C, AUR |
MFP Current Plan Clearance Sales Retail, Units, Cost, and Average Unit Retail. |
|
MFP Sell Thru % |
Sell through percentage of the Sub-class by the current plan of MFP. |
|
MFP Sales R, U, C, AUR |
MFP Current Plan Total Sales Retail, Units, and Average Unit Retail by Sub-class, store, and week. |
|
Location Count |
Count of Locations assigned to each Store Cluster. |
|
Assort Period Week Count |
Number of Weeks in the Assortment Period. |
|
MFP Receipts U |
MFP Current Plan Net Sales Retail, Units, and Average Unit Retail by Sub-class, store, and week. |
Measure Profiles
Default Profile
This profile is used to access the view which focuses on the MFP Current Plan.
Gross Margin
The Gross Margin profile is used to view MFP Current Plan with respect to Gross Margin.
In this tab, the Buyer/Planner is able to review the Last Year historical sales and profitability by product and product attribute. A number of product attributes (Brand, Color, neckline, and so on) are included in this release, but many more can be added. This information can be useful in thinking about which trends should be carried forward by product attribute into the assortment that is about to be created.
This view focuses on the sales and profitability history of the prior year for the same time period by Style/Color (or higher) and Cluster (or higher).
The step to complete this process:
Analyze the last year values.
Measure Table
Table 12-2 1. Review LY History View Measures
| Label | Definition |
|---|---|
|
LY Sales R, U, C, AUR |
Last Year Total Sales Retail, Units, Cost, and Average Unit Retail. |
|
LY Markdown R, R% |
Last Year Markdown Retail, Retail Percentage. |
|
LY GM R |
Last Year Gross Margin Retail. |
|
LY GM R % |
Last Year Gross Margin percentage. |
|
LY Option Count |
Count of Options carried Last Year. |
|
LY FP ROS |
Last Year Full Price weekly Rate of Sales. |
|
% to LY Sales U, R |
The Percentage of Sales Unit Retail of the option to all the options considered in the Last Year. |
|
Rank by LY FP Sales U |
Rank of the option by considering Last Year Full Price Sales Units. |
|
LY FP Sell Thru % |
The Last Year Full Price Sell Through percentage of the option. |
|
Rank by LY FP Sell Thru % |
Rank of the Option by considering Last Year Full Price Sell through percentage. |
|
LY Reg+Promo R, U, AUR |
Last Year Full Price Retail, Units, and Average Unit Retail. |
|
LY Clr Sales R, U, AUR |
Last Year Clearance Sales Retail, Units, and Average Unit Retail. |
|
LA Sales R, U, C, AUR |
Last Assortment Total Sales Retail, Units, Cost, and Average Unit Retail. |
|
LA GM R |
Last Assortment Gross Margin Retail. |
|
LA GM R % |
Last Assortment Gross Margin percentage. |
|
LA Option Count |
Count of Options carried Last Assortment. |
|
LA FP ROS |
Last Assortment Full Price weekly Rate of Sales. |
|
% to LY Sales U, R |
The Percentage of Sales Unit Retail of the option to all the options considered in the Last Assortment. |
|
Rank by LA FP Sales U |
Rank of the option by considering Last Assortment Full Price Sales Units. |
|
LA FP Sell Thru % |
The Last Assortment Full Price Sell Through percentage of the option. |
|
Rank by LA FP Sell Thru % |
Rank of the Option by considering Last Assortment Full Price Sell through percentage. |
|
LA Sales Reg+Promo R, U, AUR |
Last Assortment Reg+Promo Retail, Units, and Average Unit Retail. |
|
LA Clr Sales R, U, AUR |
Last Assortment Clearance Sales Retail, Units, and Average Unit Retail. |
|
On Hand U |
On Hand Inventory Units. |
|
Location Count |
Count of Locations assigned to each Store Cluster. |
|
Assort Period Week Count |
Number of Weeks in the Assortment Period. |
|
LA BOP U |
Last Assortment Beginning of Period Units. |
|
LY BOP U |
Last Year Beginning of Period Units. |
|
LY Location Count |
Count of Locations assigned to each Store Cluster Last Year. |
|
MFP GM R |
MFP Current Plan Gross Margin Retail. |
|
MFP GM R% |
MFP Current Plan Gross Margin Retail Percentage. |
|
MFP Sales R, U, C |
MFP Current Plan Sales Retail, Units, and Cost. |
This view focuses on the sales and profitability history of the prior year for the same time period by Product Attribute, Sub-Category (or higher), and Cluster (or higher).
The step to complete this process:
Analyze the last year values by Product Attributes.
Measure Table
Table 12-3 2. Review LY by Attributes View Measures
| Label | Definition |
|---|---|
|
LY Sales Reg+Promo U |
Last Year Full Price Sales Units that are sold for the specified product attribute value. |
|
LY Sales Reg+Promo U % to Ttl |
The percentage of LY Full Price Sales Units of the specified attribute value to the sales of all the attribute values. |
|
LY Option Count |
Count of Options carried Last Year for the specified product attribute value. |
|
LY Option % |
Percentage of Last Year options distribution across product attribute with respect to the product attribute values. |
|
LA Sales Reg+Promo U |
Last Assortment Full Price Sales Units that are sold for the specified product attribute value. |
|
LA Sales Reg+Promo U % to Ttl |
The percentage of Last Assortment Full Price Sales Units of the specified attribute value to the sales of all the attribute values. |
|
LA Option Count |
Count of Options carried Last Assortment for the specified product attribute value. |
|
LA Option % |
Percentage of Last Assortment options distribution across product attribute with respect to the product attribute values. |
In this tab, the Buyer/Planner is able to review the Last Assortment historical sales and profitability by product and product attribute. A number of product attributes (Brand, Color, neckline, and so on) are included in this release, but many more can be added. This information can be useful in thinking about which trends should be carried forward by product attribute into the assortment that is about to be created.
This view focuses on the sales and profitability history of the prior assortment by Style/Color (or higher) and Cluster (or higher).
The step to complete this process:
Analyze the last assortment values.
Measure Table
Table 12-4 1. Review LA History View Measures
| Label | Definition |
|---|---|
|
LY Sales R, U, AUR |
Last Year Total Sales Retail, Units, and Average Unit Retail. |
|
LY Markdown R, R% |
Last Year Markdown Retail, Retail Percentage. |
|
LY GM R |
Last Year Gross Margin Retail. |
|
LY GM R % |
Last Year Gross Margin percentage. |
|
LY Option Count |
Count of Options carried Last Year. |
|
LY FP ROS |
Last Year Full Price weekly Rate of Sales. |
|
LY% to Sales Reg+Promo U, R |
The Percentage of Full Price Sales Unit Retail of the option to all the options considered in the Last Year. |
|
Rank by LY FP Sales U |
Rank of the option by considering Last Year Full Price Sales Units. |
|
LY FP Sell Thru % |
The Last Year Full Price Sell Through percentage of the option. |
|
Rank by LY FP Sell Thru % |
Rank of the Option by considering Last Year Full Price Sell Through percentage. |
|
LY Reg+Promo R, U, C, AUR |
Last Year Full Price Retail, Units, Cost, and Average Unit Retail. |
|
LY Clr Sales R, U, AUR |
Last Year Clearance Sales Retail, Units, and Average Unit Retail. |
|
LA Sales R, U, AUR |
Last Assortment Total Sales Retail, Units, and Average Unit Retail. |
|
LA GM R |
Last Assortment Gross Margin Retail. |
|
LA GM R % |
Last Assortment Gross Margin percentage. |
|
LA Option Count |
Count of Options carried Last Assortment. |
|
LA FP ROS |
Last Assortment Full Price weekly Rate of Sales. |
|
LA% to Sales Reg+Promo U, R |
The Percentage of Sales Unit Retail of the option to all the options considered in the Last Assortment. |
|
Rank by LA FP Sales U |
Rank of the option by considering Last Assortment Full Price Sales Units. |
|
LA FP Sell Thru % |
The Last Assortment Full Price Sell Through percentage of the option. |
|
Rank by LA FP Sell Thru % |
Rank of the Option by considering Last Assortment Full Price Sell Through percentage. |
|
On Hand U |
On Hand Inventory Units. |
|
Location Count |
Count of Locations assigned to each Store Cluster. |
|
Assort Period Week Count |
Number of Weeks in the Assortment Period. |
|
LA BOP U |
Last Assortment Beginning of Period Units. |
|
LY BOP U |
Last Year Beginning of Period Units. |
|
LY Location Count |
Count of Locations assigned to each Store Cluster Last Year. |
|
MFP GM R |
MFP Current Plan Gross Margin Retail. |
|
MFP GM R% |
MFP Current Plan Gross Margin Retail Percentage. |
|
MFP Sales Reg+Promo R, U, C |
MFP Current Plan Sales Retail, Units, and Cost. |
This view focuses on the sales and profitability history of the prior assortment by Product Attribute, Sub-Category (or higher), and Cluster (or higher).
The step to complete this process:
Analyze the last assortment values by Product Attributes.
Measure Table
Table 12-5 2. Review LA by Attributes View Measures
| Label | Definition |
|---|---|
|
LY Sales Reg+Promo U |
Last Year Full Price Sales Units that are sold for the specified product attribute value. |
|
LY Sales Reg+Promo U % to Ttl |
The percentage of Last Year Full Price Sales Units of the specified attribute value to the sales of all the attribute values. |
|
LY Option Count |
Count of Options carried Last Year for the specified product attribute value. |
|
LY Option % |
Percentage of Last Year options distribution across product attribute with respect to the product attribute values. |
|
LA Sales Reg+Promo U |
Last Assortment Full Price Sales Units that are sold for the specified product attribute value. |
|
LA Sales Reg+Promo U % to Ttl |
The percentage of Last Assortment Full Price Sales Units of the specified attribute value to the sales of all the attribute values. |
|
LA Option Count |
Count of Options carried Last Assortment for the specified product attribute value. |
|
LA Option % |
Percentage of Last Assortment options distribution across product attribute with respect to the product attribute values. |
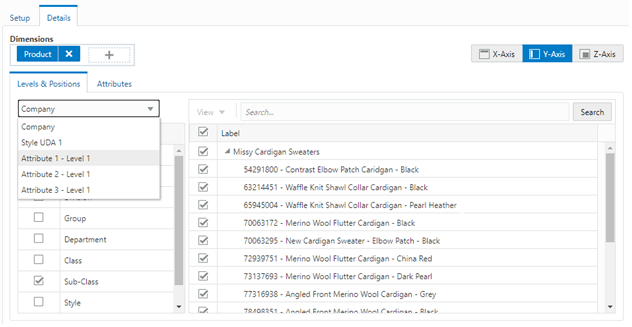
The Define Product Rollup Tab is used to quickly provide the planner with an ability to select product attributes as an alternate hierarchy. This is available in the tab to display the item level.
The Define Product Rollup view is used to select product attributes to view in an alternate hierarchy. This is available in the tab to display the item level. Nested product attribute roll up is provided with three levels. A planner can set up to three different combinations for nested rollup with a maximum of three levels in each combination.
For example: As a first combination, you select Brand as a Level 1, Color as Level 2, and Fabric as Level 3 by clicking the list of attributes available at that category.
This allows you to roll up your items by brand, then color inside each brand and then by fabric inside each color.
The planner can analyze and review the proposed assortment based on important attributes. You may select up to three attributes at a time for the dynamic rollup.
The steps to complete this process:
Select up to three dynamic product attributes from the picklist.
Run the Refresh Product Rollup Application Action.
To view the product attribute:
In a view that displays item level, click the Product Hierarchy tile.
Select the attribute (Attribute 1 or 2 or 3) that you would like to view in the nested dynamic rollup.
Click OK.
Measure Table
Table 12-6 Define Product Rollup View Measure
| Label | Definition |
|---|---|
|
Product Attribute 1, 2, 3 |
Picklist to present product attributes for a nested dynamic product hierarchy rollup. |
Measure Profile
Default Profile
The Default profile is used to select dynamic product attributes. The planner can view up to three Levels to review and work on Plans rolled up to multiple attributes. Using the nested dynamic product rollup feature, the planner can group plans for three different attributes. If a planner is working on a class and if level 1 is brand, level 2 is color, and level 3 is fabric, the planner can review and analyze plans for all brands of a class, then across all colors inside each brand and then across every fabric for each color.
Application Action
Refresh Product Rollup
The Refresh Product Rollup Application Action creates dynamically updated alternate hierarchies based on user-defined attribute selections. After running the application action, the user may select the alternate product hierarchy to see plans grouped based on the attribute selections.
In this step, the Buyer can review the goals for any or all product attributes relevant to each cluster. Goals are reviewed in terms of the number of style-colors for a specific attribute or a percentage of the total number of style-colors carried for each product attribute.
Tabs and Views in this Step:
Application Action
Seed Target Mix
The Seed Target Mix Application Action is used to seed the product attributes mix from last year or last assortment in the Target Mix by Attributes view.
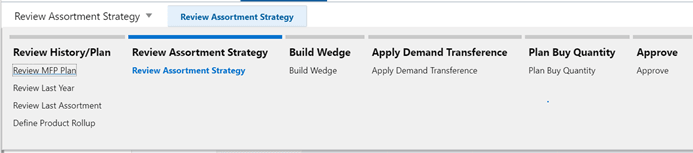
This tab is used to review the assortment strategy and shopping list created in the Create Assortment step.
In the Review Assortment Strategy view, the Buyer can review the target buy quantity units, Current Plan Rate of Sales, target total options, target new options, target carryover options, and Current Plan new options percentage comparing to the total options. This view is solely for purpose of review just before starting to work on your wedge as the assortments have already been broken down to the store cluster level in the previous step of Create Assortment.
Measure Table
Table 12-7 1. Review Assortment Strategy View Measures
| Label | Definition |
|---|---|
|
Last Seeded |
Last seeded option used information displayed to let the user know if the plan is based on LY, LA, or MFP. |
|
CP Sales Reg+Promo U |
The Current Plan Full Price sales unit quantity for the style/colors. |
|
CP ROS |
Current Plan Rate of Sales. |
|
CP Total Options |
Current Plan total options considered. |
|
CP New/Carryover Options |
Current Plan new/carryover options. |
|
CP New Options % |
Current plan new option percentage to the total options. |
The Target Mix by Attributes view is used to review the product attribute score of the options you would like to use in your assortment.
Measure Table
Table 12-8 2. Target Mix by Attributes View Measures
| Label | Definition |
|---|---|
|
Tgt Option Count |
The targeted number of options planned for the assortment at the sub-category level. |
|
CP Option % |
The Current Plan Options percentage by product attribute value in the selected product attribute. Defined at Assortment Period, Sub category, Cluster Channel, and Product Attribute level. |
|
LA Option Count |
Count of Options planned in the Last Assortment. |
|
LA Option % |
Last Assortment Option percentage at each product attribute value with in the product attribute. |
|
LA Sales Reg + Promo U |
Last Assortment Full Price (Sales Regular + Promotional) Units |
|
LY Option Count |
Count of Options planned in the Last Year. |
|
LY Option % |
Last Year Option percentage at each product attribute value with in the product attribute. |
Measure Profile
Default Profile
The Review Attributes view is used to review the product attribute mix for the product attributes after running the seed attribute mix, to make sure that the correct attribute values are considered in your assortment.
The step to complete this process:
Review the attribute Rank provided and override the attribute rank as per your need.
Review the Combined attribute rank determined after the overriding the attribute Rank. Value 9,999 means the attribute value has not made it into the list.
Measure Table
Table 12-9 3. Review Attributes View Measures
| Label | Definition |
|---|---|
|
Product Attribute |
The attributes assigned to each style-color. |
Measure Profile
Default Profile
The Default profile is used to view the attribute ranking for the target mix by attributes.
The Review Attributes Weight view is used by the planner to review the product attributes weights interfaced by science for each subclass for a selected channel. These Weights are mainly used by Demand Transference logic to suggest the recommendations to ether add, drop, or swap items or improve the Sales U of an item or group of items. The user can use this read-only view to understand the demand transference recommendations.
Measure Table
Table 12-10 4. Review Attribute Weights View Measures
| Label | Definition |
|---|---|
|
Attribute Weight % |
The weight of the attribute assigned to each style-color which is later normalized to 100% by the DT module. |
|
Attribute Rank |
Rank of each attribute based on weights. |
Measure Profile
Default Profile
The Default profile is used to view the attribute ranking for the target mix by attributes.
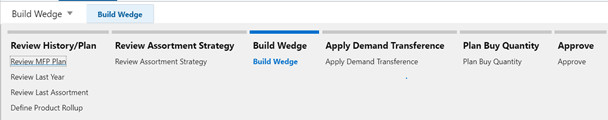
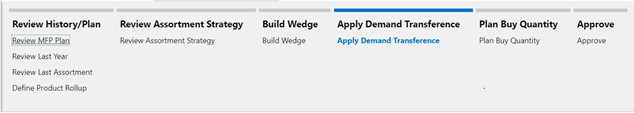
The third step is the Build Wedge process.
In this step, the Buyer continues with the assortment creation process by assorting each Cluster's Wedge with style-color selections from the Shopping List. The Buyer may choose to populate them manually or to use the Wedge Population Automation capability to recommend selections that can be adjusted by the Buyer.
Tab and Views in this Step:
Application Actions
Build Wedge
The Build Wedge Application Action is used to populate the wedge using the auto-wedge algorithm for the entire workspace (all the clusters).
Populate Wedge
The Build Wedge Application Action is used to populate the wedge using the auto-wedge algorithm for only the working cluster.
Clean Assort Plan
The Clean Assort Plan Application Action is used to clean the Plan measure data for non-selected style-colors in the assortment process.
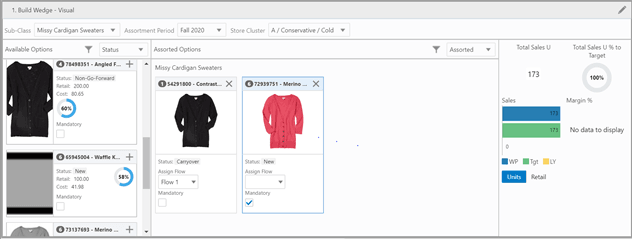
In the Build Wedge tab, as the Buyer you can record ideas/decisions regarding the core options to include in the assortment. You can easily view the options available and view their ranks depending on the attribute scoring and make choices to include in the assortment. You can also compare the assortment to the targeted options and target mix of attributes and make any changes that are necessary.
The Build Wedge - Visual view is used to view the options for the assortment visually. You can view all the available options and view the options (style/color) included in the assortment in the assorted options section of the view. You can view the ranking of the options and add (Using +) in the card view of Available Options section to move the option to the assorted options section of the view. The Available Options section of the view contains the list of all style/colors available for the Sub-class, Assortment period, and Cluster. You can remove (Using X) in the Card view from the assorted options section to move the option to the available options section of the view.
You can also toggle between the different measure selections per the card definitions and view the assortment visually per your needs to analyze the different measure values/attributes. You can also use attribute filtering/sort to view the style-colors of the attributes you want for analysis. You can also use Special filters and define/save attribute filters at once up to five attributes and their values. These saved filters can be applied in conjunction with the special filters that enhance the filtering.
There is also a summary section with an option to toggle between Units and Retail. When toggled for Units, the total buy quantity is compared to the targeted units. You can view the working plan, Target, Last Year, and MFP targets to compare. When toggled to Retail, the total buy quantity retail is compared to the targeted retail. You can view the working plan, Target, Last Year, and MFP targets to compare.
There is a chart to show the Total Buy Quantity % to the targeted.
The steps to complete this process:
Select/modify/delete the options into/from the Assorted options.
Select the card definitions to view the measures/attributes as needed for your analysis.
After any modifications, click the calculate action menu and review the summary of the data.
You can edit the buy quantity units and assign the flow to the style/color as needed and the same data reflects in the Build Wedge - Table view.
Measure Table
Table 12-11 1. Build Wedge - Visual View Measures
| Label | Definition |
|---|---|
|
Populate Wedge |
Boolean measure to check in order to run the auto wedge population. |
|
Status |
Auto-generated status of the option selected. |
|
Wedge Recommended |
Boolean measure to show whether the option is auto populated with wedge automation. |
|
Assorted Option |
Boolean measure to check in order to include in the assortment to include in the wedge. |
|
Eligible Options |
Boolean measure to show whether the option was part of the shopping list options or not. |
|
Mandatory |
Boolean check box to indicate if the option is mandatory and to be included in the assortment. |
|
Option Rank |
Working Plan options ranking given to the style/color using the auto wedge algorithm. |
|
Assign Flow |
Flow list of values to assign for every option. |
|
Key Attribute 1, 2, 3 |
The key attributes considered for attribute scoring and auto wedge ranking. |
|
Tgt New/carryover/total Options |
The working plan target new, carryover and maximum options. |
|
New/Carryover Options Count |
The new, carryover options considered in the working plan. |
|
Option Count |
Total options considered in the working plan. |
|
New/Carryover/Total Options diff to Tgt +/- |
The new, carryover, total options difference to the target total options. |
|
Sales Reg+Promo U Recommended |
Recommended Full Price Sales Units of the style-color. |
|
WP Reg+Promo Sales U |
Working Plan Full Price Sales Units. |
|
WP Reg+Promo Sales U Var Rec % |
Working Plan Full Price Sales Units Variance to Receipts Percentage. |
|
Flow Week Count |
The Week count of the assigned Flow. |
|
FP ROS Recommended |
Full Price Recommended Rate of Sales. |
|
FP ROS |
Working Plan Full Price Rate of Sales. |
|
CP Assorted Option |
Boolean measure to check the Current Plan assortment to include in the wedge. |
|
CP Option Rank |
Current Plan options ranking given to the style/color using the auto wedge algorithm. |
|
CP Status |
Current Plan Status. |
|
CP Assign Flow |
Current Plan Flow that is assigned. |
|
Tgt New/Total Option |
Target New/Total Options. |
|
Tgt New Option % |
Target New Options percentage to the total options. |
|
Tgt ROS |
Target Rate of Sales. |
|
Tgt Sales U |
Target Sales Units. |
|
Last Seeded |
Last Seeded option for reference. |
|
Buy Quantity |
Buy Quantity Units planned for the style-color. |
|
LA, LY FP Sell Thru% |
Sell Through percentage of the option. |
Application Actions
Build Wedge
The Build Wedge Application Action is used to populate the recommended options using the auto wedge algorithm for the all cluster level.
Populate Wedge
The Populate Wedge Application Action is used to populate the recommended options using the auto wedge algorithm for only the cluster for which you have selected the populate wedge process.
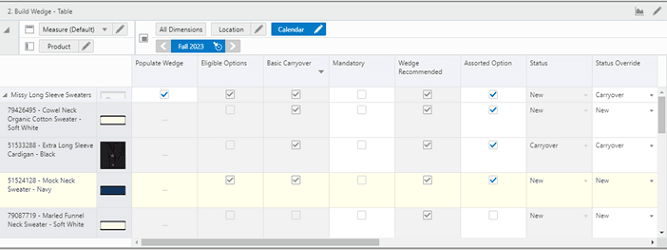
The Build Wedge - Table view is used to view the options for the assortment in table format. You can view all the available options and view the options (style/color) included in the assortment in the assorted options section of the view. You can choose the options that are mandatory and choose to include them in the assorted options. You can view the ranking of the options, recommended options, and shopping list options for the Sub-class, Assortment period, and Cluster level. You can view the options selection with respect to new/carryover status, the To Target option, and total options considered to the target options.
The steps to complete this process:
Select/modify/delete the options into/from the Assorted options.
Review the mandatory, recommended, and shopping list options.
Measure Table
Table 12-12 2. Build Wedge - Table View Measures
| Label | Definition |
|---|---|
|
Populate Wedge |
Boolean measure to check in order to run the auto wedge population. |
|
Status |
Auto-generated status of the option selected. |
|
Basic Carryover |
Boolean measure to signify that the style/color is an item of product type basic and is a carry forward from the previous season because of the high on hand and item lifecycle end date in the future. |
|
Wedge Recommended |
Boolean measure to show whether the option is auto populated with wedge automation. |
|
Assorted Option |
Boolean measure to check in order to include in the assortment to include in the wedge. |
|
CP Shopping List |
Boolean measure to show whether the option was part of shopping list options or not. |
|
Mandatory |
Boolean check box to indicate if the option is mandatory and to be included in the assortment. |
|
Option Rank |
Working Plan options ranking given to the style/color using the auto wedge algorithm. |
|
Assign Flow |
Flow list of values to assign for every option. |
|
Key Attribute 1, 2, 3 |
The key attributes considered for attribute scoring and auto wedge ranking. |
|
Tgt New/carryover/total Options |
The working plan target new, carryover and maximum options. |
|
New/Carryover Options Count |
The new, carryover options considered in the working plan. |
|
Option Count |
Total options considered in the working plan. |
|
New/Carryover/Total Options diff to Tgt +/- |
The new, carryover, total options difference to the target total options. |
|
LY Sales R, U, AUR |
Last Year Sales Retail, Units, and Average Unit Retail. |
|
LY Markdown R, R% |
Last Year Markdown Retail, Retail Percentage. |
|
LY GM R |
Last Year Gross Margin Retail. |
|
LY GM R % |
Last Year Gross Margin percentage. |
|
LY Option Count |
Count of Options carried Last Year. |
|
LY FP ROS |
Last Year Full Price weekly Rate of Sales. |
|
LY % to Sales U, R |
The Percentage of Sales Unit Retail of the option to all the options considered in the Last Year. |
|
Rank by LY FP Sales U |
Rank of the option by considering Last Year Full Price Sales Units. |
|
LY FP Sell Thru % |
The Last Year Full Price Sell Through percentage of the option. |
|
Rank by LY FP Sell Thru % |
Rank of the Option by considering Last Year Full Price Sell Through percentage. |
|
LY Reg+Promo R, U, AUR |
Last Year Reg+Promo Retail, Units, and Average Unit Retail. |
|
LY Clr Sales R, U, AUR |
Last Year Clearance Sales Retail, Units, and Average Unit Retail. |
|
LA Sales R, U, AUR |
Last Assortment Sales Retail, Units, and Average Unit Retail. |
|
LA GM R |
Last Assortment Gross Margin Retail. |
|
LA GM R % |
Last Assortment Gross Margin percentage. |
|
LA Option Count |
Count of Options carried Last Assortment. |
|
LA FP ROS |
Last Assortment Full Price weekly Rate of Sales. |
|
LA% to Sales U, R |
The Percentage of Sales Unit Retail of the option to all the options considered in the Last Assortment. |
|
Rank by LA FP Sales U |
Rank of the option by considering Last Assortment Full Price Sales Units. |
|
LA FP Sell Thru % |
The Last Assortment Full Price Sell Through percentage of the option. |
|
Rank by LA FP Sell Thru % |
Rank of the Option by considering Last Assortment Full Price Sell Through percentage. |
|
LA Sales Reg+Promo R, U, AUR |
Last Assortment Full Price Sales Retail, Units, and Average Unit Retail. |
|
LA Clr Sales R, U, AUR |
Last Assortment Clearance Sales Retail, Units, and Average Unit Retail. |
|
On Hand U |
On Hand Inventory Units. |
|
Location Count |
Count of Locations assigned to each Store Cluster. |
|
Assort Period Week Count |
Number of Weeks in the Assortment Period. |
|
LA BOP U |
Last Assortment Beginning of Period Units. |
|
LY BOP U |
Last Year Beginning of Period Units. |
|
LY Location Count |
Count of Locations assigned to each Store Cluster Last Year. |
|
LY Sales Clr R, U |
Last Year Clearance Sales Retail, Units. |
|
LY Sales Promo R, U |
Last Assortment Clearance Sales Retail and Units. |
|
MFP GM R |
MFP Current Plan Gross Margin Retail. |
|
MFP GM R% |
MFP Current Plan Gross Margin Retail Percentage. |
|
MFP Sales R, U, C |
MFP Current Plan Sales Retail, Units, and Cost. |
|
Sales Reg+Promo U Recommended |
Recommended Full Price Sales Units of the style-color. |
|
Sales Reg+Promo U |
Full Price Sales Units. |
|
Sales Reg+Promo U Var Rec % |
Sales Reg+Promo Units Variance to Receipts Percentage. |
|
Flow Week Count |
The Week count of the assigned Flow. |
|
FP ROS Recommended |
Full Price Recommended Rate of Sales. |
|
FP ROS |
Working Plan Full Price Rate of Sales. |
|
CP Assorted Option |
Boolean measure to check the Current Plan assortment to include in the wedge. |
|
CP Option Rank |
Current Plan options ranking given to the style/color using the auto wedge algorithm. |
|
CP Status |
Current Plan Status. |
|
CP Assign Flow |
Current Plan Flow that is assigned. |
|
Tgt New/Total Option |
Target New/Total Options. |
|
Tgt New Option % |
Target New Options percentage to the total options. |
|
Last Seeded |
Last Seeded option for reference. |
|
Buy Quantity |
Buy Quantity Units planned for the style-color. |
|
FP Sell Thru% |
Full Price Sell Through percentage of the option. |
Measure Profiles
Default Profile
The Default profile is used to view/modify the assorted options while reviewing the auto wedge suggested and assigning the flow for the assorted options.
Option Count
The Option Count profile is used to view the option count according to the status of the option considered in the assortment process for wedge.
Application Actions
Build Wedge
The Build Wedge Application Action is used to populate the recommended options using the auto wedge algorithm for the all cluster level.
Populate Wedge
The Populate Wedge Application Action is used to populate the recommended options using the auto wedge algorithm for only the cluster for which you have selected the populate wedge process.
The Compare Wedge to Target view is used to review the working plan options considered to the target options and highlight any deviations to the Buyer.
Measure Table
Table 12-13 3. Compare Wedge to Target View Measures
| Label | Definition |
|---|---|
|
Tgt Option Count |
The target number option count. |
|
Options diff to Tgt +/- |
The working plan options count different to the target. |
|
Options Count |
The options count by each attribute value. |
|
Option % |
The Options percentage by product attribute value in the selected product attribute. Defined at Assortment Period, Sub category, Cluster Channel, and Product Attribute level. |
|
LY Option Count |
Count of Options planned in the Last Year. |
|
LY Option % |
Last Year Option percentage at each product attribute value with in the product attribute. |
|
LA Option Count |
Count of Options planned in the Last Assortment. |
|
LA Option % |
Last Assortment Option percentage at each product attribute value with in the product attribute. |
Measure Profile
Default Profile
The Default profile is used to compare the wedge to target options considered and highlight to the buyer any deviations from the planned target.
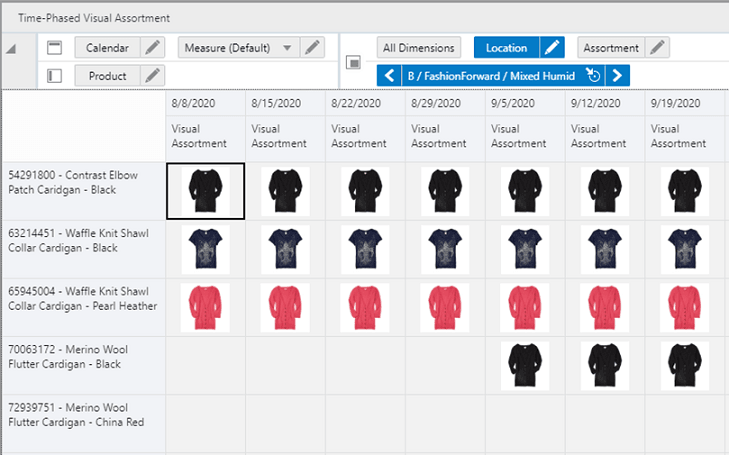
The Time Phased Visual Assortment helps the buyer with a high-level view of the assortment at period level with visual images of style/colors. Once the buyer has created a style-color level assortment in the Wedge step, the Time Phased view step is used to review the assortment pictorially (in the form of product images). This facilitates an image-based review of the assortment plan being created, which can help to make a buyer's job more efficient. After reviewing the assortment at the style-color level in this view, the buyer can return to the Wedge step to make changes to the assortment, as per business requirements.
The style-color level assortment can be viewed at assortment period/cluster level.
The Buyer can use the special filter to view the Visual Assortment.
The step to complete this process:
Review the Visual Assortment across the Time phase of Assortment Period.
Measure Table
Table 12-14 4. Time-Phased Visual Assortment View Measure
| Label | Definition |
|---|---|
|
Visual Assortment |
Display the associated style/color image for the assigned flow weeks. |
Measure Profile
Default Profile
The Default profile is used to review the Visual Assortment for the assortment period and cluster.
The fourth step is the Apply Demand Transference process.
In this step, the Planner continues to refine the assortments further by leveraging science. Demand Transference (DT) logic will forecast the effect on sales of all the items in the assortment when items are added, removed, or swapped from the assortment. Also, DT will enable the planner try out several different assortments to find one that best meets the goals of the assortment. For example, find the assortment that maximizes Sales U/Sales R or meets MFP Targets for a fixed number of products.
The optimization process of Demand Transference will enable the user to add, remove, or swap a specified percentage of options to optimize Sales U, Sales R and Gross Margin. The user also has the ability to run optimization logic to meet MFP Targets. In that case, DT makes the decision to add, remove, or swap the current assortment to meet the MFP target. DT uses Product elasticity and Attribute weights provided by the ORASE systems backed by science and the individual ROS across each location to determine the most profitable options providing wide variety of assortments to the customers.
Tab and Views in this Step:
Apply Demand Transference Tab:
2. Set Optimization Parameters View
3. View Optimization Results View
Application Actions
Run DT
The Run DT Application Action is used to optimize the Sales U and R using Demand Transference logic to avoid the overstocking or understocking of each option. This is run for subclass, cluster, and assortment period.
Accept DT
The Accept DT Application Action is used to accept the DT recommended optimized Sales U and Sales R.
Run Optimization
The Run Optimization Application Action is used to optimize the assortment by either adding, removing, or swapping options from the assortment to meet the assortment goals of maximizing one of the Sales U, Sales R, Gross Margin, or Meeting MFP Targets.
Accept Optimization
The Accept Optimization Application Action is used to accept and commit the optimized results recommended by DT if the planner is happy with the recommendations.
In the Apply Demand Transference tab, the Planner refines the assortments further by using science and automation. As a first step of DT, DT recommends the optimized Sales U and R for the existing assortment. Furthermore, using the optimization engine of DT, it can easily add more high performing Non Assorted options into the assortment, remove low performing assorted options from the existing assortment if you have too many options, swap options with better profits with options with Lower sales.
You can also tweak the assortment to meet the MFP Targets just by running the DT Optimization engine. DT makes the required decisions of add/drop/swap options to meet the targets. Options marked as mandatory will continue to be in the assortment and DT will not drop mandatory items and Basic Carryover items under any circumstance. Similar to Build Wedge, DT gives the highest priority to Mandatory items followed by Basic-Carryover items If build wedge automation recommends options based on the top three attributes set by the user, DT considers all attributes to determine the best assortment mix.
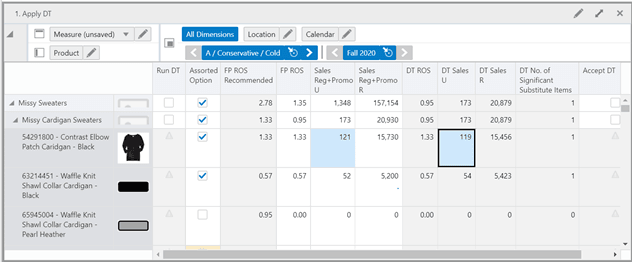
The Apply DT view is used to view the options of the assortment and the DT recommendations of optimized sales for each of the assorted options. You can view all the available options and view the options (style/color) included in the assortment in the assorted options section of the view. You can view the corresponding sales of each of the assorted options. The view contains the list of all style/colors available for the Sub-class, Assortment Period, and Cluster.
The steps to complete this process:
Check the Boolean Run DT at the sub-category or higher level for the chosen assortment period, store cluster, and above.
Click calculate and execute the planning action Run DT.
On the successful completion of the planning action, the DT set of measures will show the optimized sales values for each of the assorted options.
As a planner, if you are happy with the DT recommendations, you can check the Accept DT Boolean at the sub-category or higher level and execute the planning action Accept DT to incorporate DT recommendations into the assortment.
Measure Table
Table 12-15 1. Apply DT View Measures
| Label | Definition |
|---|---|
|
Run DT |
Boolean measure to check in order to run the auto wedge population. |
|
Assorted Option |
Editable Boolean measure signifying if a particular option is assorted or not. |
|
FR ROS Recommended |
Full Price weekly Rate of Sales Recommended. |
|
FP ROS |
Working Plan Full Price weekly Rate of sales. |
|
Sales Reg+Promo U |
Full Price Sales units. |
|
Sales Reg+Promo R |
Full Price Sales Retail. |
|
Status |
Status of the item signifying if it is a New, Carryover, or a non-go forward item. |
|
Status Override |
Editable measure to override the status of the item. |
|
DT K/A/D |
DT measure equivalent to the status of an item having three statuses of Keep, Add, or Drop. |
|
DT ROS |
DT weekly rate of sales. |
|
DT Sales U |
DT recommended optimized Sales Units. |
|
DT Sales R |
DT recommended optimized Sales Retail. |
|
DT Incremental Sales U |
DT calculated Sales Units unique to the option. The incremental sales of an option cannot be transferred to any other option if this option is dropped. |
|
DT Incremental Sales R |
DT calculated Sales Retail unique to the option. The incremental sales of this option cannot be transferred to any other option if this option is dropped. |
|
DT Substitutable Sales U |
DT calculated substitutable Sales Units. If the option is dropped, sales can be recovered by transferring the demand of this option to a substitutable option. |
|
DT Substitutable Sales R |
DT calculated substitutable Sales Retail. If the option is dropped, sales can be recovered by transferring the demand of this option to a substitutable option. |
|
DT Substitutable Sales % |
Percent of the substitutable sales of an option. |
|
DT No. of significant substitute items |
Number of options that can act a substitute to fulfill the demand of a dropped item. |
|
Accept DT |
Boolean measure to accept the DT recommendations. |
Application Actions
Run DT
The Run DT Application Action is used to optimize sales based on DT recommendations using the Demand Transference logic.
Accept DT
The Accept DT Application Action is used to Accept DT recommended sales to incorporate the DT recommended sales into the assortment.
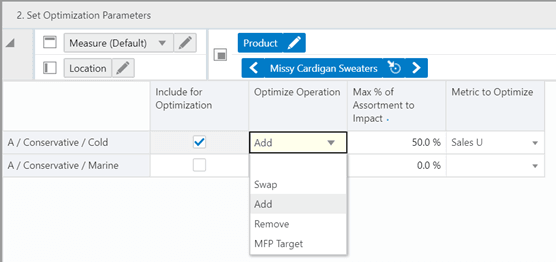
The Set Optimization Parameters view is used to set the desired parameters to run the DT optimization engine. There are four optimization operations, Swap, Add, Remove, and MFP Target. The Boolean, Include for Optimization, allows the planner to select the required clusters for DT Optimization. The next measure, Max % of Assortment to impact, allows the planner to specify the maximum percent of assortment the planner would like to optimize. The picklist measure, Metric to Optimize, allows the user to specify one of the three metrics of Sales U, Sales R, and Gross Margin to specify for optimization.
For a given subclass, assortment period, and store cluster, if there are four assorted options, the user checks the Boolean Include for Optimization, specifies the optimization parameter as Add, specifies 50 for the Max % of Assortment to impact, and selects the metric to optimize as Sales U, upon the execution of the Run Optimization planning action, DT will try to add a maximum of the two best selling options to the existing assortment mix, taking the total number of assorted options to six. If DT fails to find high performing options, nothing will be added and the number of assorted options continues to remain as four.
For a given subclass, assortment period, and store cluster, if there are four assorted options, the user checks the Boolean Include for Optimization, specifies the optimization parameter as Swap, specifies 50 for the Max % of Assortment to impact, and selects the metric to optimize as Sales U, upon the execution of the Run Optimization planning action, DT will try to add a maximum of the two best selling Non Assorted options and remove two of the low performing options from the existing assortment mix, taking the total number of assorted options to four. If DT fails to find high performing options, nothing will be swapped and the number of assorted options continues to remain as four.
For a given subclass, assortment period, and store cluster, if there are four assorted options, the user checks the Boolean Include for Optimization, specifies the optimization parameter as Remove, specifies 50 for the Max % of Assortment to impact, and selects the metric to optimize as Sales U, upon the execution of the Run Optimization planning action, DT will try to drop the two lowest selling options to the existing assortment mix, taking the total number of assorted options to two.
For a given subclass, assortment period, and store cluster, if there are four assorted options, the user checks the Boolean Include for Optimization, specifies the optimization parameter as MFP Target, specifies 50 for the Max % of Assortment to impact, and selects the metric to optimize as Sales U, upon the execution of the Run Optimization planning action, DT will swap a maximum of two options to meet the MFP Targets.
The steps to complete this process:
Set the optimization parameters.
Click calculation and run the Run Optimization planning action.
Upon the successful execution of the planning action, verify the results in the Review Assortment Results view.
Measure Table
Table 12-16 2. Set Optimization Parameters View Measures
| Label | Definition |
|---|---|
|
Include for Optimization |
Boolean measure to check to include a particular cluster or channel across a chosen Sub-class and assortment period to execute the Run Optimization planning action to execute the DT Optimization Engine. |
|
Optimize Operation |
A picklist measure having four values of Swap, Add, Remove, and MFP Target to perform one of the four operations. |
|
Max % of Assortment to Impact |
Editable measure carrying the value of Maximum % of initial assortment to be impacted by the DT Optimization Engine. The DT results will always be the less than or equal to the percent mentioned in this measure. If DT fails to find any better recommendations, there will not be any changes to assortments. |
|
Metric to Optimize |
One of the three metrics of Sales U, Sales R, and Gross Margin that can be optimized using the optimization engines. |
Application Action
Run Optimization
The Run Optimization Application Action is used to execute the demand transference optimization engine.
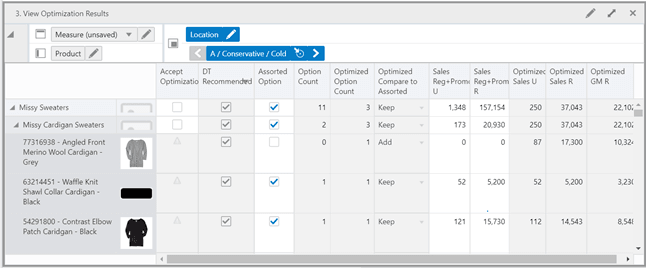
The View Optimization Results view is used to verify the results after the execution of the Run Optimization Application Action for a given subclass/cluster/Assortment period. The measure DT Recommended is a Boolean that shows if a particular option must be considered for an assortment or not. The Optimized Compare to Assorted measure shows whether a particular option should be continued (Keep), Added (Add), or removed (Drop) from the assortment to meet the assortment goals of maximizing one of the Sales U, Sales R, Gross Margin, or meeting MFP Targets. If the planner likes the DT recommendations, the planner can check the Boolean Accept Optimization and execute the Accept Optimization Application Action to incorporate the recommendations.
The steps to complete this process:
Review the recommendations.
Review the sales numbers.
If you like the result, check the Boolean Accept Optimization sub category or higher level for the chosen assortment period, store cluster, and above.
Click calculate and execute the Accept Optimization Application Action to incorporate DT recommendations into the assortment.
Measure Table
Table 12-17 3. View Optimization Results View Measures
| Label | Definition |
|---|---|
|
Accept Optimization |
Boolean measure to be marked as true to execute the Accept Optimization planning action at the subclass level and above to accept DT Recommendations. |
|
DT Recommended |
Boolean measure which will be marked as true if the stye-color is a recommendation by the DT engine. |
|
Assorted Option |
Editable Boolean measure to mark or unmark an option as an Assorted Option. |
|
Option Count |
Integer measure that gets one added for every assorted option to be able to give the total number of assorted options at aggregated levels. |
|
Optimized Option Count |
Integer measure that gets one added for every DT final recommended option showing the total number of options at aggregated levels as a result of DT. |
|
Optimized Compare to Assorted |
String measure having the picklist of Keep, Add, and Drop showing the status of an DT recommendation in comparison with the Non DT plan. |
|
Sales Reg+Promo U |
Sales Unit value of Full price items which is the sum of regular and promotional sales. |
|
Sales Reg+Promo R |
Sales Retail value of Full price items which is the sum of regular and promotional sales. |
|
Optimized Sales U |
Sales Units recommended by DT after the execution of the Run Optimization planning action. |
|
Optimized Sales R |
Sales Retail recommended by DT after the execution of the Run Optimization planning action. |
|
Optimized GM R |
Gross Margin Retail recommended by DT after the execution of the Run Optimization planning action. |
|
MFP Sales Reg + Promo U |
Full Price Sales Unit Values from MFP at Subclass and above. |
|
MFP Sales Reg + Promo R |
Full Price Sales Retail Values from MFP at Subclass and above. |
|
MFP GM R |
Gross Margin Retail Value from MFP at Subclass and above. |
The Review Substitutable Item Details view is a read-only view for information only. This view is used to review the items that can act as a substitute item for a product. This will give the planner that visibility to all the products that can consume the demand of a selected item and by what percentage. The RHS Product tile lists the substitutable items.
In the following figure, item 63214451 - Waffle knit Shawl Collar Cardigan - Black can act as a substitute item to replace item 54291800 - Constrast Elbow patch Cardigan - Black if 54291800 gets dropped. The DT Received Sales %, U, R measure represents the demand that will be consumed by the substitutable item if the initial product is dropped. The Item Similarity % measure shows the percentage of similarities between both the items. This view will help the planner to make an informed decision while accepting DT recommendations.
Measure Table
Table 12-18 4. Review Substitutable Item Details View Measures
| Label | Definition |
|---|---|
|
DT Received Sales % |
Measure displaying the percent of demand covered if the assorted item is dropped. |
|
DT Received Sales U |
Measure displaying the number of units of lost demand covered if the assorted item is dropped. |
|
DT Received Sales R |
Measure displaying the Sales Retail amount covered if the item is dropped. |
|
Item Similarity % |
Percent similarity between the assorted item and the possible substitute item. |
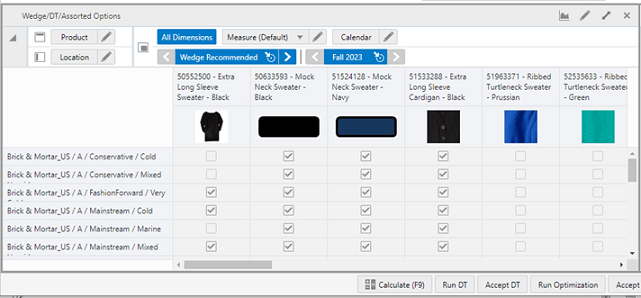
The Wedge/DT/Assorted Options is a read-only view to allow the user to review the difference recommendations and the final assorted options. This view has three Boolean measures that signify the recommendations and final assortment decision across each cluster for a given style-color. This helps the planner to analyze what clusters with a particular style-color have been recommended.
The step to complete this process:
Review the Boolean DT recommended versus the Wedge recommended versus the assorted options across all clusters for a chosen style-color.
Measure Table
The fifth step is the Plan Buy Quantity process.
In this step, the Planner plans the buy quantities for each of the assorted option.s Buy quantity is planned using the Sales Target and the Sell Through percent.
If you are planning Basic Style Colors based on the planned life cycle of the item, the Buy quantity can be planned in one go for the entire life cycle in one assortment period. In the subsequent assortment periods, this item will be carried forward automatically as a basic-carryover item and basic Reg+promo Sales U will have the on hand from the end of the previous assortment period. This will enable to planner to make the appropriate decision on the buy quantity.
Tab and Views in this Step:
This tab is used to manage plan buy quantities.
The Plan Buy Quantity - Table view is used to build the buy plan based on the assortment created in the Build Wedge tab.
The step to complete this process:
Plan buy quantities using the target sales and sell through percent.
Measure Table
Table 12-20 1. Plan Buy Quantity - Table View Measures
| Label | Definition |
|---|---|
|
Wedge Recommended |
Boolean measure to show the wedge recommendations after running auto wedge. |
|
DT Recommended |
Boolean measure to show to the DT recommendations after running the DT Optimization Engine. |
|
Assorted Option |
Boolean measure to show the final assortment. |
|
Mandatory |
Boolean check box to indicate if the option is mandatory and to be included in the assortment. |
|
FP ROS Recommended |
Full Price weekly rate of sales recommended by automation logic. |
|
Sales Reg+Promo U Recommended |
Full Price sales Units recommended by automation. |
|
CP Sales Reg+Promo U |
Current Plan full Price sales Units. |
|
FP ROS |
Planned Full Price weekly Rate of Sales. |
|
Sales Reg+Promo U Var Rec % |
Full Price Sales Units Variance to Receipts Percentage. |
|
Sales Reg+Promo U, R, AUR |
Full Price Sales Units, Retail, Average Unit Retail planned for the style-color. |
|
Full Price Buy Quantity U |
Full Price Buy Quantity Units planned for the style-color. |
|
LY/LA FP Sell Thru % |
The Last Year/Last Assortment Full Price Sell Through percentage that is editable by the planner. |
|
On Hand U |
The on hand inventory units those are existing in the location cluster. |
|
Total Units |
The total units of the inventory clubbing the existing on Hand Units and buy quantity. |
The sixth and final step in the Build Wedge process is Approve. This step approves the assortment that you have created and reviews it for accuracy.
The output of this step is an approved Assortment Plan which can be brought into the Review Assortment.
The steps to complete this process:
Approve the assortment plan.
Review the approved assortment plan.
Prior to Starting this Step:
Thoroughly analyze and review the assortment to ensure the plans meet the financial goals of the category.
After Completing this Step:
Review Assortment.
Tab and Views in this Step:
Application Action
Approve
The Approve Application Action approves the planned assortment for the selected sub-category.
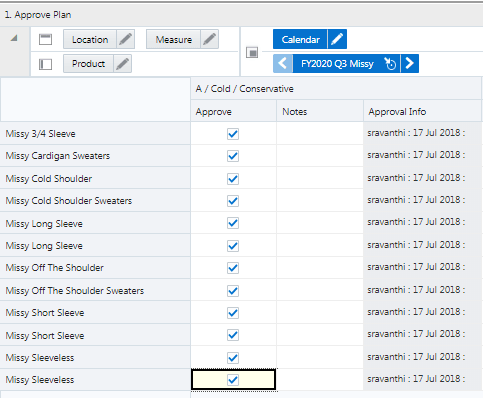
In this tab, the Buyer decides if they have completed the assortment list and want to make it available to other designated users, in particular to the other Buyers who are planning for dependent departments/subcategories.
This process will convert the Working Plan decisions regarding start/end dates, prices, descriptions, and attributes into Current Plan versions of the Working Plan measures. The Current Plan versions should be used for external reporting and so on.
This process can be completed more than once, if the Assortment requires additional changes after it has been approved. The Working Plan version will overlay the Current Plan version if approved again.
In this view, the Buyer selects the sub-categories to be approved and enters any approval notes (optional) and then clicks Approve Plan to copy the Working Plan version of the measures into the Current Plan version of each measure.
The steps to complete this process:
In the Approve measure, check the Boolean flag for the sub-category and above levels that should be approved. If all products should be approved at once, roll up to All Product and All Location and check the Approve measure at that level.
In the Notes measure, enter approval comments.
Run the Approve Application Action.
Measure Table
Table 12-21 1. Approve Plan View Measures
| Label | Definition |
|---|---|
|
Approve |
Boolean flag measure required to be checked in order to approve the Assortment Plan. |
|
Notes |
Used to enter approval comments. |
|
Approval Info |
Provides information about the most recent plan approval. |
Measure Profile
Default Profile
The Default profile is used to approve the Assortment plan.
Application Action
Approve
The Approve Application Action approves the planned assortment for the selected sub-categories.
In the Review Assortment view, the Buyer can review the assortment visually. The Buyer can sit with the Buyer's team, review the approved assortment, make any changes as necessary, and rerun the approval process.
The step to complete this process:
Review the Approved plan.
Measure Table
Table 12-22 2. Review Approved Assortment View Measure
| Label | Definition |
|---|---|
|
Visual Assortment |
Display the associated style/color image for the assigned flow weeks. |
Measure Profile
Default Profile
The Default profile is used to review the approved Assortment Plan.