| Oracle® Retail Assortment & Item Planning for Fashion/Softlines Cloud Service User Guide Release 19.0 F24864-08 |
|

 Previous |
 Next |
| Oracle® Retail Assortment & Item Planning for Fashion/Softlines Cloud Service User Guide Release 19.0 F24864-08 |
|
Previous |
Next |
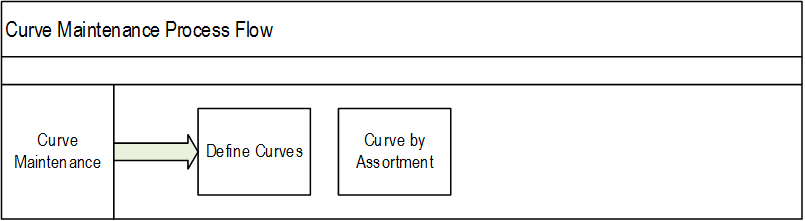
The Curve Maintenance task is used to create a sales curve library for use in Item Planning. The curves are used to spread unit sales to week, based on percent-to-total sales. They shrink or stretch to fit the defined regular or promotional sales period.
The typical user of the Curve Maintenance task is an assortment planner who has business knowledge of the seasonality and selling patterns to create curves to assign to Assortment Periods.
Approved location clusters
Approved assortment period
The high-level steps to complete this process:
Define curves to be used to spread sales to week.
Approve curves.
To create the Curve Maintenance segment:
Click Assortment Services in the Task menu. Then, click the Planning Maintenance activity and then the Curve Maintenance task.
The dialog to create New Plan opens. Click Create New Plan.
Enter the Plan Label in the text field. Click Ok.
In Select Product, select one or multiple departments and click Next.
In Select Assortment Period, select the Assortment Period to assign curves and click Finish.
To see the user-defined Assortment Period label, click the Dimension tile and select Assortment Label.
|
Note: Assortment Labels can vary by Sub-class. If multiple subcategories are selected, the label shown will be based on the first order Sub-class. |
The Curve Maintenance segment is built.
The first step in the Curve Maintenance process is to set curve parameters and define the curves.
The steps to complete this process:
Select a curve seed source and seed timeframe. See "1. Define Parameters View."
Select whether the curve will shrink to fit or remain static over the number of weeks. See "2. Define Curves View."
Prior to Starting this Step:
The selling shape of each curve to be created should be defined and converted into percent to totals.
After Completing this Step:
Assign and approve curves.
Views in this Step:
Application Action
Seed Curve
The Seed Curve Application Action references the selected Seed Source and Curve Source (Year) measures selected by the user to populate a sales curve as a starting point for the planner.
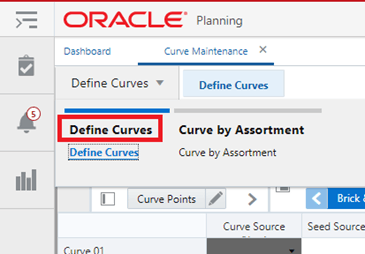
This tab is used to seed and define curves.
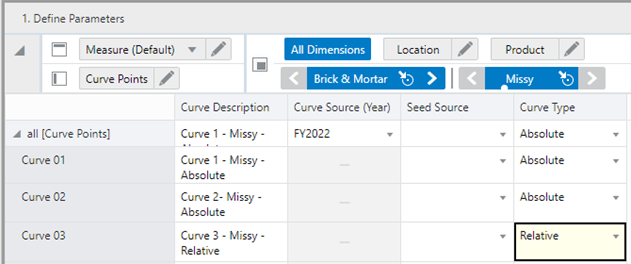
The Define Parameters view is used to select a curve source year, a seed source, and the curve type.
The steps to complete this process:
The Curve Description measure allows the planner to provide a detail curve label for the curves defined so that user can easily identify the specific curves defined for different use cases.
In the Curve Source (Year) measure, select the year from which to pull the Seed Source data.
In the Seed Source measure, select MFP, Forecast or Actuals as the seed source.
The Seed Source measure selected should align with the Curve Source (Year) selected. For example, if you select Forecast, the Curve Source (Year) should be a future period. If you select Actuals, the Curve Source (Year) should be an elapsed period.
You may also directly enter a curve, without using one of the available seed sources (see "2. Define Curves View"):
For example, you can manually enter an 8 week curve, starting with W01 and going through W08.
The system will normalize these values to 100%.
If you manually enter a curve, select the Relative Curve type so that the curve will resize according to the assortment duration.
In the Curve Type measure, select Absolute or Relative:
Absolute will take the corresponding week's curve percent to total and normalize the curve to equal 100% based on the assortment period duration.
Absolute curves are not stretched or shortened to fit the assortment period and can be useful when items tend to display seasonal behavior based on time of year.
An absolute curve will only normalize the data to make it 100%. It just changes the scale, retaining the shape of the curve.
Relative will take the first through the last populated week curve percent and resize, then normalize the curve to equal 100% to fit the assortment period duration. For example, if the assortment period is longer than the defined curve, the effective curve is stretched to match the assortment period.
Relative curves are useful if the items tend to display the same pattern of selling over its lifecycle, regardless of the time period.
A relative curve is useful when a user does not want to enter data for all the weeks in the Define Curves view. As an example, if a user has an assortment period of 12 weeks, the user can just set data for week1 to week4 and the system will resize it to fit into the assortment period.
The user can also set data for more than 12 weeks for this scenario; the relative setup will take the curve and fit it for 12 weeks.
The user needs to remember that the relative curve resizes for forward weeks only. Ideally, the user should set data from week1 up to any week they decide to. If the user does not set data for week1 but sets data only from week2, the relative curve will only set from week2, so effectively week1 will not have any sales. The curve will not adjust for any past week.
Run the Seed Source Application Action.
|
Note: Seed Source will populate the Sales Curve % based on the seed source independent of the Curve Type defined. If the seeded curve % has curve data from week01 to week52 and type is set to Relative, it will resize and normalize it to the length of the Assortment Period. The resize and normalization of the curve occurs in the normal calc process and not through the Seed Curve custom menu. The decision to use which Curve Type, Absolute versus Relative, can happen after the Seed Curve process. Relative is best used for the manual setting of Sales Curve % from week01 onwards. |
Measure Table
Table 10-1 1. Define Parameters View Measures
| Label | Definition |
|---|---|
|
Curve Description |
The string measure to hold the detail curve label to be able to easily identify the curve for specific business use cases. |
|
Curve Source (Year) |
The year from which to pull the Seed Source data. |
|
Seed Source |
A picklist measure to select a data source from which to populate curves. |
|
Curve Type |
A picklist measure to select the curve type of Absolute or Relative. Absolute curves correspond to the percent to total sales of the corresponding week in the Assortment Period while Relative curves are shortened or lengthened to match the Assortment Period length. |
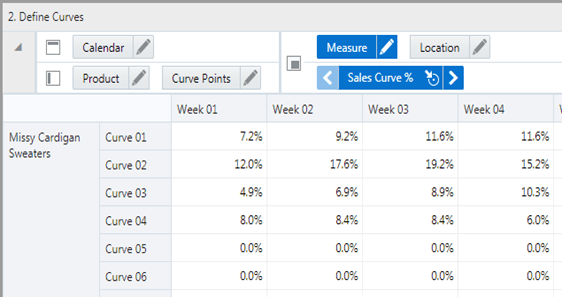
The Define Curves view is used to view and modify the seeded curve data. Note that all curves will systematically normalize to equal 100%. The planner has the option of directly entering curves as well. When entering directly, the recommended curve type is Relative.
The steps to complete this process:
Review each of the defined curves and determine if adjustments should be made.
It can be helpful to view the curves in graph form to see the shape of the curve in a visual format.
In the Define Curves view, the user is presented with week01 to week53. These are all generic weeks. Do not mistake it with FY weeks. These are relative weeks to the assortment period selected by the user. For example, the user can have an assortment period from week13 to week24. In Define Curves, it will map week01 to week13 of the assortment period (and onwards).
Measure Table
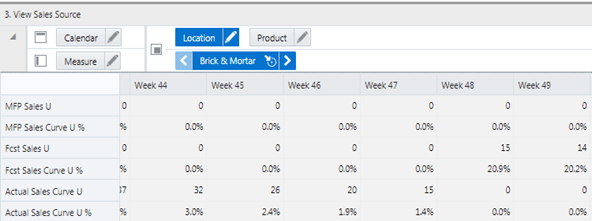
The View Sales Source view is used to view the MFP, Forecast, and Actual sales data that the curves are based upon in the selected Curve Source (Year). It is used as a reference view only.
The step to complete this process:
Review the data sources used to create curves, as necessary.
Measure Table
Table 10-3 3. View Sales Source View Measures
| Label | Definition |
|---|---|
|
MFP Tgt, Fcst, Actual Sales U |
MFP CP, Forecast and Actual Sales Units for the selected Curve Source (Year). |
|
MFP Tgt, Fcst, Actual Sales Curve U % |
MFP CP, Forecast and Actual Sales Curve Unit % for the selected Curve Source (Year). The Sales Curve Unit percent corresponds to the sales unit percent to total. |
The second step in the Curve Maintenance process is to approve the curves and view the approved curves by Assortment Period and by week.
The steps to complete this process:
Approve curves.
View the approved curves.
View the assortment period.
View the curve by assortment.
Prior to Starting this Step:
Define as many curves as needed for the assortment.
After Completing this Step:
Begin Item Planning.
Tab and Views in this Step:
Application Action
Approve
The Approve Application Action is used to approve the curve library for the Sub-class, Assortment Period, and channel.
This tab is used to approve the curves and view them by assortment period and week.
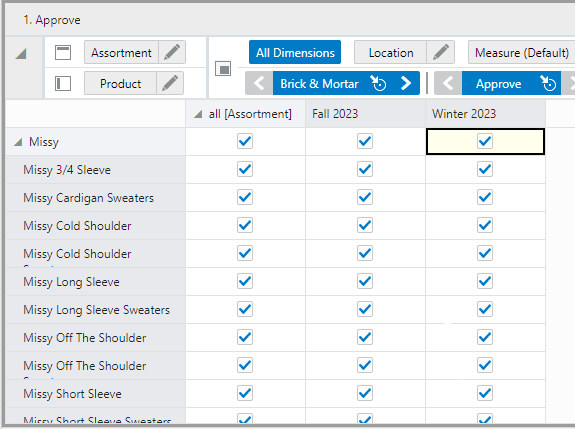
The Approve view is used to approve the curve library for the Sub-class, Assortment Period, and channel.
The steps to complete this process:
Flag the Approve Boolean measure for each Sub-class.
Run the Approve Application Action.
Measure Table
The View Assort Period view is used to view the Assortment Period dates. This is a reference-only view.
The step to complete this process:
Review the Assortment Period dates.
Measure Table
Table 10-5 2. View Assort Period View Measures
| Label | Definition |
|---|---|
|
Start Date |
The first date of the Assortment Period. |
|
Duration (Weeks) |
The number of weeks in the Assortment Period. |
|
Start Week |
The first week of the Assortment Period, calculated from the Start Date and Duration entered. |
|
End Week |
The last week of the Assortment Period, calculated from the Start Date and Duration entered. |
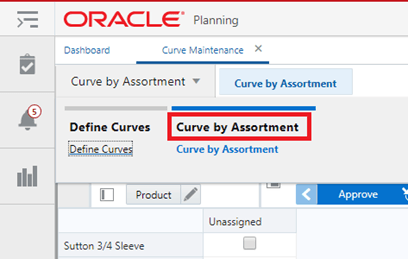
The View Curve by Assortment view is used to view the curve library by Assortment Period and Sub-class. This is a reference-only view.
The step to complete this process:
Review the curve library by each Assortment Period.
Use the radio button to scroll through Assortment Period and Sub-class, as necessary.
Note that you may use the filter button to filter by Assortment Periods that have been assigned a curve.
Measure Table
Table 10-6 3. View Curve by Assortment View Measures
| Label | Definition |
|---|---|
|
Sales Curve % |
The working plan sales curve used to hold the weekly sales percent to total of a particular curve. |
|
Approved Sales Curve % |
The approved sales curve used to hold the weekly sales percent to total of a particular curve. |
|
Sales Curve Start Week |
Indicates the start week of the sales curve. |