| Oracle® Retail Assortment & Item Planning for Fashion/Softlines Cloud Service User Guide Release 19.0 F24864-08 |
|

 Previous |
 Next |
| Oracle® Retail Assortment & Item Planning for Fashion/Softlines Cloud Service User Guide Release 19.0 F24864-08 |
|
Previous |
Next |
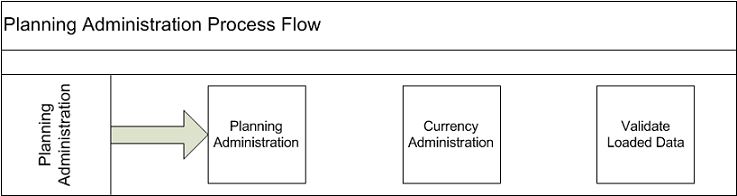
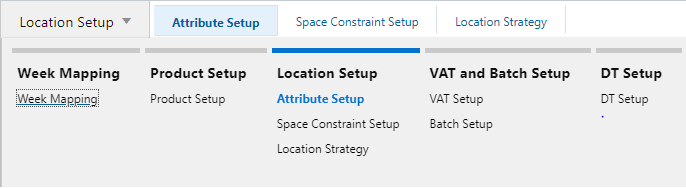
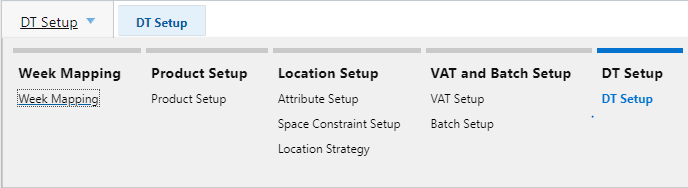
The Planning Administration task is used to map last year weeks to current year weeks, set up product and location attributes, assign strategy weights for location clustering, define fixture capacity and size profiles, assign fixture to location, map stores to warehouse, set VAT rates, set/view imported data for Demand Transference (DT) from ORASE, set Dashboard parameters, and export setup.
The typical user of the Planning Administration task is an Administrator who has business knowledge of last year weekly mapping, product and location attributes, cluster strategy weights, Demand Transference data, Dashboard parameters, and VAT rates.
Following are the data requirements for this task:
Weekly holiday shifts and how they correspond from last year to this year
Item attributes for placeholder items
Location attributes for new locations
Location Cluster Strategy Weights
VAT rates
Assortment Elasticity and Attribute Weights for DT
To create the Planning Administration segment:
Click Assortment Services in the Task menu. Then, click the Planning Administration activity and then the Planning Administration task.
The dialog to create New Plan opens. Click Create New Plan.
Enter a descriptive Plan Label in the text field. Click Ok.
In Select Product, select one or multiple departments and click Finish.
The Planning Administration segment is built.
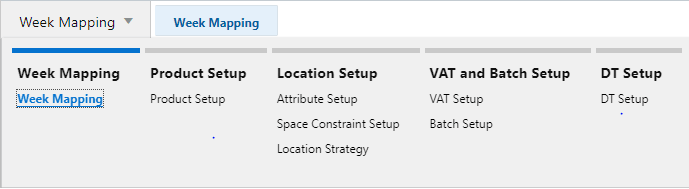
The Week Mapping step is used to assign and validate last year's weekly mapping. By default, a loaded file maps last year's weeks on a one-to-one basis. Situations that may require a weekly mapping shift are 53 week years and major holidays that change by weeks and/or months every year. Shifting a holiday week using mapping allows the business to compare last year holiday sales that may have happened in a different fiscal week to the week that they will occur in this year.
The step to complete this process:
Confirm and modify if necessary, the week mapping.
Prior to Starting this Step:
The Administrator should gather information from the business team or from other appropriate teams to determine if any holiday or other mapping shifts should occur.
After Completing this Step:
Assign attributes to each category.
Set up attribute values for placeholder items.
Tab and View in this Step:
This tab is used to review and update week mapping of this year to last year weeks.
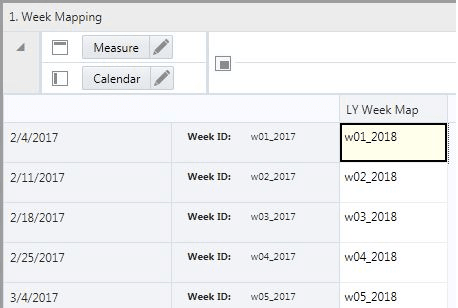
The Week Mapping view is used to map a week in this year to a week in last year. By default, the loaded file maps last year's weeks congruently to this year's weeks, meaning, the first week of last year is mapped to the first week of this year, the second week of last year is mapped to the second week of this year, and so on. The mapping for any week can be reassigned in this segment.
The step to complete this process:
Enter this year's week that should map back to last year.
Measure Table
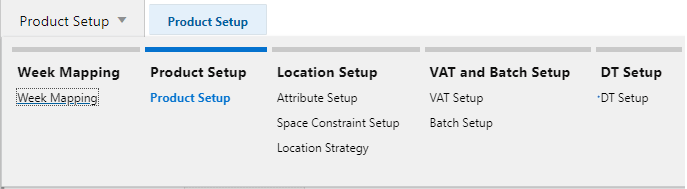
The Product Setup step is used to view and define attribute values, assign the attributes to each category, and assign the attribute value for each item. The Administrator can map the product attributes, set the Dashboard parameters, set the card view attribute and images, and set the base unit price/cost of the placeholder products.
The steps to complete this process:
View category attributes and attribute values.
Create new attribute values, if necessary.
Assign attributes to a category, which will be visible in the Assortment & Item Planning segments.
If an attribute is not assigned to a category, the attribute will not be visible in the Assortment and Item Planning segments.
Assign attribute values to placeholder items.
Define the attribute image.
Set the base unit price/cost for the placeholder items.
Set the Dashboard parameters to be able to see the item trends on the Dashboard based on the selected KPI.
Prior to Starting this Step:
Existing product attributes and attribute values should be loaded.
After Completing this Step:
Assign location attributes.
Assign like-locations.
Mark locations as active or inactive.
Assign location space metrics, fixtures, and size profiles.
Tab and Views in this Step:
1. Define Product Attributes View
2. Select Product Attributes View
3. Assign Product Attribute View
4. Color Attribute Identifier View
5. Define Card View Attribute View
This tab is used to select and set up attributes of a product.
The Define Product Attributes view is used to view attributes and attribute values that can be used to distinguish items in an assortment based on the features. Example attributes are brand, size, product type, and color which can be used to facilitate planning, measuring, and managing a category's business in an efficient manner. It also allows creation of new attribute values.
To add a new attribute value, right-click a Product Attribute Value position and use the Add Position(s) option (Placeholder Maintenance functionality) to maintain new product attribute values (attribute value) mapping to a product attribute name (attribute name).
If attributes need to be updated for an existing item, the best practice is to update them in the source system.
For information on what is exported using the OAT process, see the Oracle Retail Assortment & Item Planning for Fashion/Softlines Cloud Service Implementation Guide.
The steps to complete this process:
View the existing attributes and attribute values.
Use Placeholder Maintenance to create new attribute values, if necessary.
Measure Table
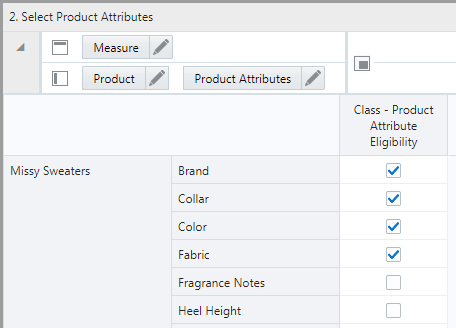
The Select Product Attributes view is used to maintain the mapping of attribute names to a product category. Depending on the settings selected, different attributes and their respective attribute values are made available to different product categories for attribute values modification. For example, an attribute Sleeve length may apply for the Sweaters product category, but may not apply for the Trousers product category.
The step to complete this process:
For each category, use the Class - Product Attribute Eligibility Boolean flag to assign the appropriate attributes that should be visible in the Assortment & Item Planning segment.
Measure Table
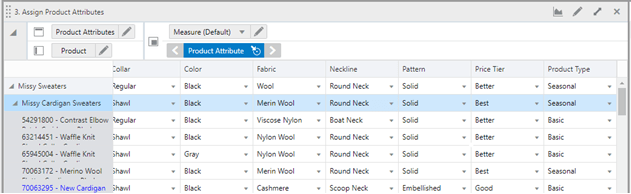
The Assign Product Attributes view is used to update the attribute values mapping to a placeholder item. While the Administrator is allowed to make changes to an existing item's attributes in this view, those changes will not be sent back to a master data management (MDM) system such as Oracle Retail Merchandising System (RMS), which is the system of record for product attributes information.
If a change is made to an existing item here, it will need to be communicated back to the source system. A new Product attribute of Product Type is added to the current list of attributes that will mark an item as a basic/continuous item or a seasonal item to enable the planner to follow a simplified workflow for basic items and focus more on seasonal items every assortment period.
The step to complete this process:
For placeholder items, assign the appropriate attribute values.
Measure Table
The Color Attribute Identifier view is used to validate the mapping of Color Attributes to the respective measures.
The step to complete this process:
Validate the mapping of the Color Attribute to the respective measure.
Measure Table
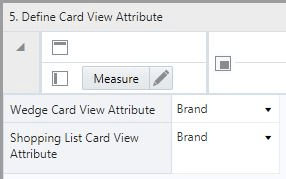
The Define Card View Attribute view is used to define the specific attribute that needs to be used in the Wedge Card view that displays in the Build Wedge - Visual view of the Build Wedge step of the Build Wedge Workspace. Also, the Planning Administrator can specify the attribute that needs to be used in the Shopping List Card view that displays in the Select Options - Visual view of the Define Assortment step of the Create Assortment workspace.
The step to complete this process:
For Card Views, specify the attribute that needs to be used.
Measure Table
Table 3-6 5. Define Card View Attribute View Measures
| Label | Definition |
|---|---|
|
Wedge Card View Attribute |
Picklist measure that enables the mapping of product attribute in order to use in the visual planning card view for Wedge. |
|
Shopping List Card View Attribute |
Picklist measure that enables the mapping of product attribute in order to use in the visual planning card view for Shopping List. |
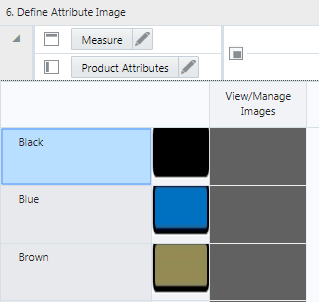
The Define Attributes Image view is used to assign the image for Product Attributes.
The step to complete this process:
Validate the mapping of the image to the Product Attribute.
For additional information on managing images, see the View and Manage Images section in the Oracle Retail Predictive Application Server Cloud Edition User Guide.
Measure Table
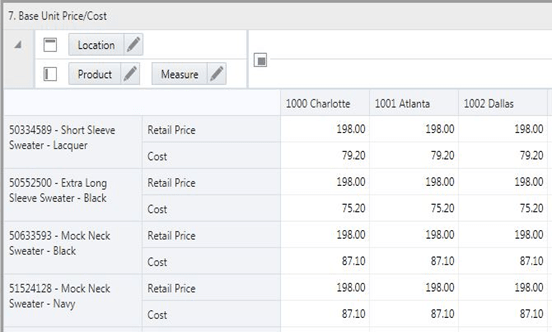
The Base Unit Price/Cost view is used to set the price and cost of placeholder items.
If all locations have the same retail and cost for the placeholder item, roll up the location hierarchy to All location.
While the Administrator is allowed to make changes to an existing item's unit retail price or cost in this view, those changes will not be sent back to a master data management (MDM) system such as Oracle Retail Merchandising System (RMS), which is the system of record for product pricing information. If a change is made to an existing item here, it will need to be communicated back to the source system.
The step to complete this process:
Locate the placeholder items and enter the base retail and cost.
Measure Table
Table 3-8 7. Base Unit/Price Cost View Measures
| Label | Definition |
|---|---|
|
Base Unit Price |
An item's retail value, which can be set by location, should only be adjusted for placeholder items in this view. |
|
Base Unit Cost |
An item's cost value, which can be set by location, should only be adjusted for placeholder items in this view. |
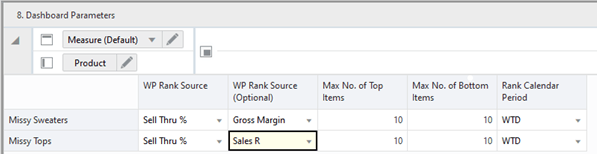
The Dashboard Parameters view is used to predefine the KPIs for which a planner would want to see the item trends in the subsequent online day. Currently, the user can set a minimum of one and maximum of two KPIs to watch the item trends. The user can also specify the number of items in each subclass to watch the trend for. This value is defaulted to 10. The user can also specify the calendar period for which they want to view the trends. It can be WTD, MTD, YTD, and so on.
The application uses the parameters defined here in the nightly batch and keeps the dashboard ready for the user as soon as user logs in to the application.
The user can set these parameters before logging off for the day to be able to review the latest trends based on the KPIs set in this view the next online day.
The steps to complete this process:
Select the KPI to watch the item trends for at the class level and above.
Set the maximum number of top performing items and low performing items to view the trends for.
Set the Calendar period you want to view the ranks for in the Product Trends (Key items) Dashboard.
Measure Table
Table 3-9 8. Dashboard Parameters View Measures
| Label | Definition |
|---|---|
|
Wp Rank Source |
KPI that needs to be considered while watching trends for the chosen product hierarchy. |
|
Wp Rank Source (Optional) |
Second KPI that needs to be considered to watch the trends for the chosen product hierarchy. It is an optional value. |
|
Max No. of Top Items |
Number of top performing items you want to see on the dashboard while watching trends. |
|
Max No. of Bottom Items |
Number of low performing items you want to see on the dashboard to watch the trends. |
|
Rank Calendar Period |
Calendar Period to be used in Product Trends (Key Items) Dashboard to review the item trends. |
The Location Setup step is used to view and define location attribute values, assign the values to each location, enable active locations for use in segments, assign Like Locations, enter space information for each location, define fixture capacity, assign fixtures to location, define size profiles, set location cluster strategies, and map warehouses to stores.
The steps to complete this process:
View location attributes and attribute values.
Assign location attribute values to stores.
Enable or disable a location's active status.
Assign Like Locations.
Define space information for locations.
Define fixture capacity and assign fixtures to location.
Define size profiles.
Set up Cluster Strategy weights.
Map warehouses to stores.
Prior to Starting this Step:
Currently used location attributes and attribute values should be loaded.
Obtain an updated active/non-active location list.
Obtain space metrics for each location.
After Completing this Step:
Set Location Cluster strategies.
Tabs and Views in this Step:
2. Define Fixture Capacity View
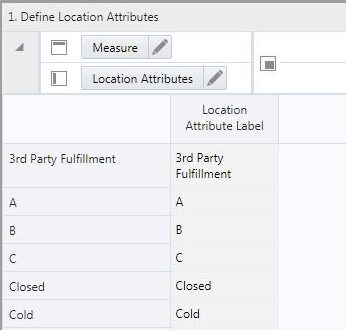
This tab is used to view and assign the location attributes and their values.
The Define Location Attributes view is used to view location attributes and their values that can be used to distinguish and group locations for clustering purposes.
The step to complete this process:
View the current location attributes.
Measure Table
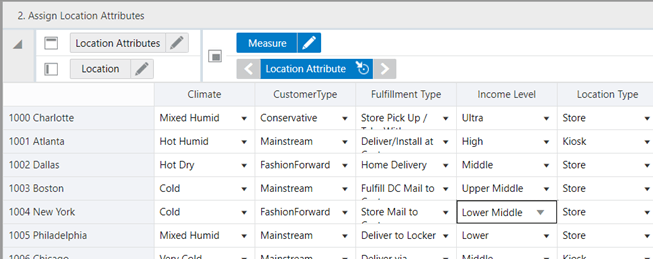
The Assign Location Attributes view is used to maintain the mapping of attribute values to a store. The location attributes are available to the planner in the Location Clustering segment.
While the Administrator is allowed to make changes to an existing attribute in this view, those changes will not be sent back to a master data management (MDM) system such as Oracle Retail Merchandising System (RMS), which is the system of record for location attribute information. If a change is made to an existing location here, it needs to be communicated back to the source system.
The step to complete this process:
Use the Location Attribute picklists for each attribute to assign the appropriate attribute values to each store.
Measure Table
This tab is used to used to enter space and fixture parameters and use the Assign Fixture to Locations view to set the Fixture Count per Location for each product sub-category after setting the maximum and minimum number of options allowed per fixture for each product sub-category.
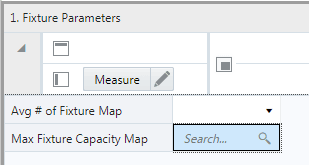
The Fixture Parameters view is used to enter fixture parameters. This information is used when calculating the fixtures.
The step to complete this process:
Select the values from the list of values for the following measures (as necessary):
Average number of Fixture Map
Max Fixture Capacity Map
Measure Table
Table 3-12 1. Fixture Parameters View Measures
| Label | Definition |
|---|---|
|
Avg # of Fixture Map |
The list of values to select the measure to map for calculating the average number of fixtures. |
|
Max Fixture Capacity Map |
The list of values to select the measure to map for calculating the maximum fixtures capacity. |
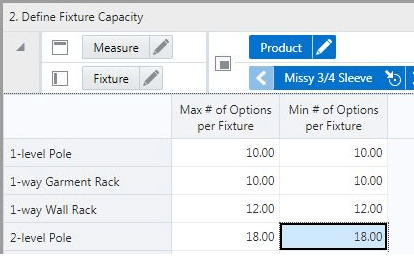
The Define Fixture Capacity view is used to set the maximum and minimum number of options allowed per fixture for each product sub-category. This is used in Assortment Strategy to plan by capacity.
The step to complete this process:
Set the maximum and minimum number of options per fixture for each sub-category.
Measure Table
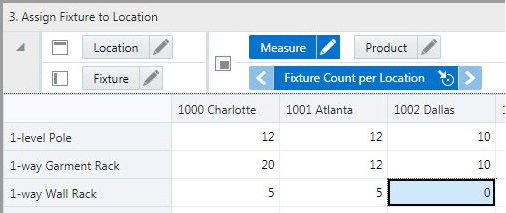
The Assign Fixture to Location view is used to set Fixture Count per Location for each product sub-category. This view helps set the number of different fixtures that will be allocated to a particular store for a particular product sub-category, for use in planning by capacity.
The step to complete this process:
Set fixture count for every location for each sub-category.
Measure Table
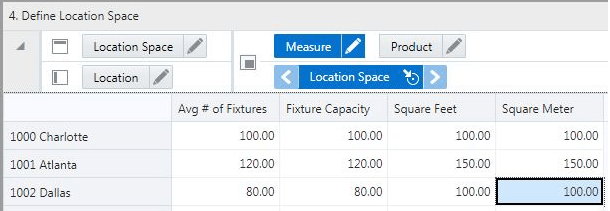
The Define Location Space view is used to enter space parameters for each location. This information is used when clustering locations using space metrics.
The step to complete this process:
Enter the following information (as necessary) for each store:
Average number of fixtures
Fixture capacity
Square feet
Square meter
Measure Table
This tab is used to enter location information, define size profiles, cluster strategy weight setup, and warehouse mappings to locations.
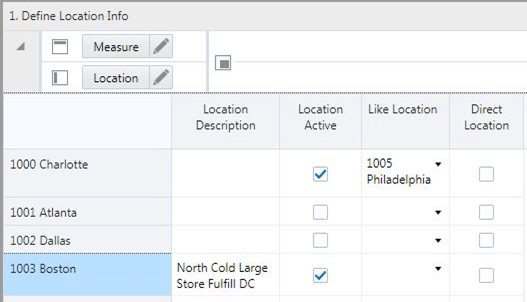
The Define Location Info view is used to enter location descriptions, enable active locations and disable inactive locations, and assign like locations to new locations.
The steps to complete this process:
Optionally, enter a location description.
The Location Description can be viewed as a dimension attribute used during the clustering process.
Enable active locations or disable inactive locations by selecting or un-selecting the Location Active Boolean flag.
Inactive Locations will not be available in Planning segments.
Assign like store locations to new stores by using the picklist measure Like Location to select the existing store that will be assigned to a new store.
Enable direct locations.
Measure Table
Table 3-16 1. Define Location Info View Measures
| Label | Definition |
|---|---|
|
Location Description |
An optional description that can be applied to a location and viewed as a dimension attribute used during the clustering process. |
|
Location Active |
Boolean flag used to make a location active or inactive. If a location is inactive, it will not be available in the Location Clustering wizard or segment. |
|
Like Location |
Picklist measure used to select an existing store to match with a new store for Sales Retail, Units, and Gross Margin history. |
|
Direct Location |
Boolean flag used to indicate whether or not a location is online (direct) or is a physical store. |
In this step, the designated Administrator defines and manages the pool of Size Profiles from which the retailer will later select and use to break the receipt plan down by size at the store level.
Measure Table
Table 3-17 2. Define Size Profiles View Measures
| Label | Definition |
|---|---|
|
WP Size Profile % |
Working Plan Size profile % for each location. These can be fed through a data feed from an Optimized Size Profiling tool such as Oracle Retail Size Profile Optimization, or from another source. They can also be entered manually. |
|
Normalized Size Profile % |
Size Profiles normalized to 100% at the size range level. |
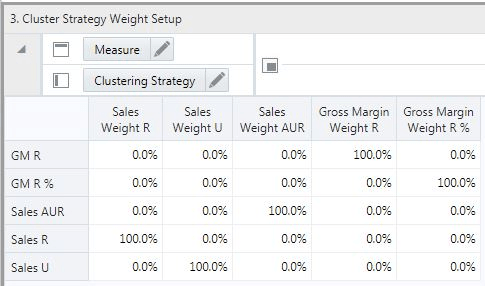
The Cluster Strategy Weight Setup view is used to enter the corporate-defined weights that correspond to each clustering strategy. The analysis and determination of strategy weights is expected to occur outside of the Item Planning solution, with the results available and visible within Item Planning to drive assortments that meet corporate objectives for each category. If desired, the Administrator may set up more clustering strategies using the Placeholder Maintenance functionality.
The step to complete this process:
Enter performance metric weights for each Location Cluster strategy and corporate-defined weight. The total sum of the weights assigned to each cluster strategy should be 100%.
Measure Table
Table 3-18 3. Cluster Strategy Weight Setup View Measure
| Label | Definition |
|---|---|
|
Sales Weight R, U, AUR, Gross Margin Weight R, and Gross Margin Weight R % |
The administrator-defined percentage weight given to the Sales metrics for the given strategy. The strategy weights are used in generating Combined Scoring for use in Location Clustering. |
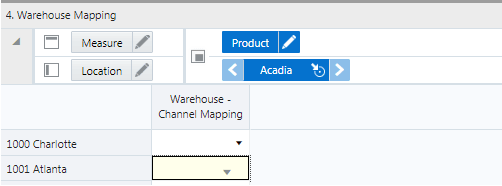
The Warehouse Mapping view is used to map the corresponding warehouse to each location.
The step to complete this process:
Select the corresponding warehouse from the picklist values to assign to locations.
Measure Table
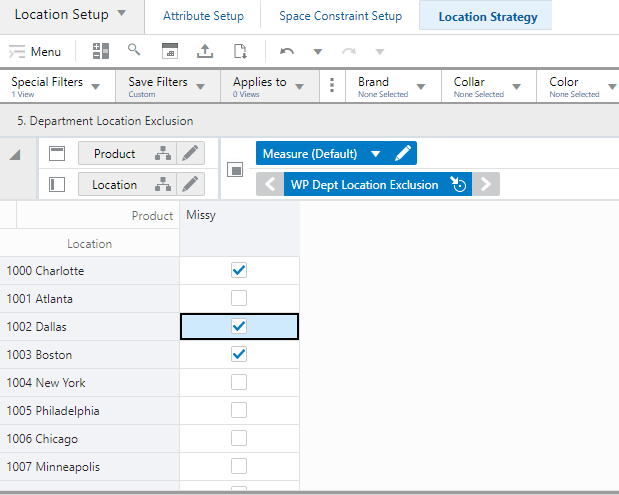
The Department Location Exclusion view uses a check mark for the selected stores of each department which should be excluded from the clustering process. Exclusions occur for various business reasons such as, not all merchandise is sold for all stores of a cluster.
The step to complete this process:
Select the check box of the stores for each department from the list to exclude in the store clustering process.
Measure Table
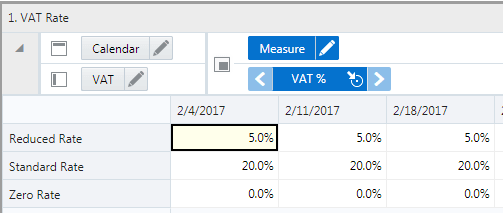
The VAT Setup allows the Administrator to define VAT rates to be used in the Assortment & Item Planning segment. The Batch Setup allows the Administrator to control which periods and positions will be exported using the standard exports within OAT. If particular positions are needed or not needed for export, the Administrator can choose that information in this step.
The steps to complete this process:
Determine the VAT rates.
Enable or disable positions for export.
Enable or disable elapsed period exporting.
Prior to Starting this Step:
Determine the VAT rates that will be entered.
Determine the export setup which sets the positions need to be exported for external systems.
After Completing this Step:
If using the Local Currency Process Extension, set values for Local Currency.
Tabs and Views in this Step:
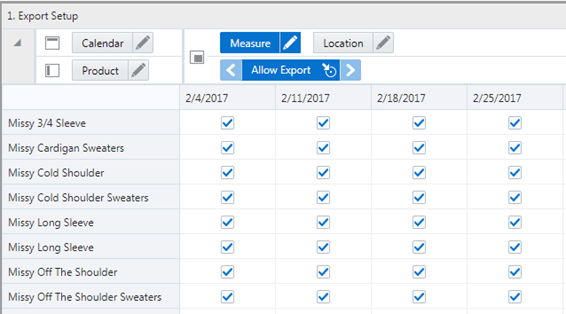
This tab is used to select the positions that should be included when exporting plan data and designate whether elapsed periods should be included when exporting data.
The Export Setup view is used to select the positions that should be included when exporting plan data.
The step to complete this process:
Select or deselect positions that should be included when exporting plan data.
Measure Table
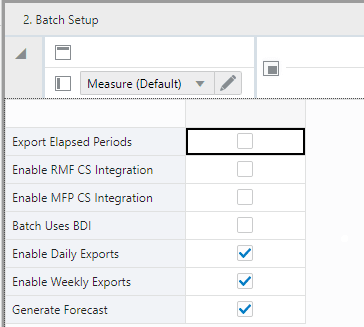
The Batch Setup view is used to designate whether elapsed periods should be included when exporting data to enable integration with Oracle Retail Merchandising Foundation Cloud Service (RMF CS) and batch use of Bulk Data Interface (BDI) and RPAS Data Mart (RDM).
The steps to complete this process:
Select the Export Elapsed Periods Boolean flag to include elapsed periods in the export.
Select the RMF CS Integration Boolean flag to enable the RMF CS integration.
Select the Batch Uses BDI Boolean flag to enable using BDI for the batch process.
Select the Batch Uses RDM Boolean flag to enable using RDM for the batch process.
Measure Table
Table 3-23 2. Batch Setup View Measures
| Label | Definition |
|---|---|
|
Export Elapsed Periods |
When the Boolean is checked, it is used to indicate that elapsed periods should be exported. |
|
Enable RMF CS Integration |
When the Boolean is checked, it is used to indicate that RMF CS Integration is enabled. |
|
Enable MFP CS Integration |
When the Boolean is checked, it is used to indicate that MFP CS Integration is enabled. |
|
Batch Uses BDI |
When the Boolean is checked, it is used to indicate that batch uses BDI. |
|
Enable Daily Exports |
When the Boolean is checked, it is used to indicate that planned data should be exported daily. |
|
Enable Weekly Exports |
When the Boolean is checked, it is used to indicate that planned data should be exported weekly. |
|
Generate Forecast |
When the Boolean is checked, it is used to indicate that Batch should generate the forecast. |
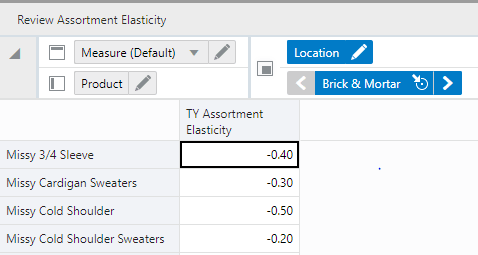
The DT Setup allows the Administrator to define Assortment Elasticity and Attribute Weights VAT rates to be used in the Assortment & Item Planning segment in the Apply Demand Transference step.
The steps to complete this process:
Review/edit the imported assortment elasticity and attribute weights.
Set Assortment Elasticity and Attribute Weights if these are not available to import.
Prior to Starting this Step:
Determine the Assortment Elasticity and attribute weights to be setup.
After Completing this Step:
If using the Local Currency Process Extension, set the values for Local Currency.
Tab and Views in this Step:
This tab is used to define the Assortment Elasticity and Attribute Weights for each subclass.
The step to complete this process:
Review the Assortment Elasticity values for each subclass.
Measure Table
The Review Attribute Weights view is used to review the weightage given to each product attribute in the system in comparison with other attributes.
The steps to complete this process:
Review/edit the attribute weights loaded from an external science system such as ORASE.
Measure Table
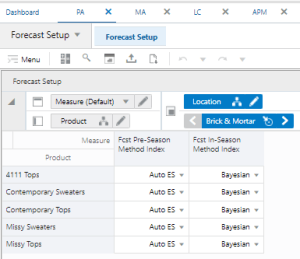
The Forecast Setup allows the Administrator to define Forecasting method by subclass and channel for both Pre-season and In-season Item planning.
The steps to complete this process:
Set Pre-Season and In-Season Forecast method by subclass for each channel
Prior to Starting this Step:
Determine the Forecasting method required for each subclass in Pre-season and In-Season item planning depending on the nature of merchandise.
After Completing this Step:
If using the Local Currency Process Extension, set the values for Local Currency.
Tab and Views in this Step: