| Oracle® Retail Invoice Matching Cloud Service Reports User Guide Release 22.1.201.0 F56740-01 |
|

 Previous |
| Oracle® Retail Invoice Matching Cloud Service Reports User Guide Release 22.1.201.0 F56740-01 |
|
Previous |
Contextual Reports are displayed in a collapsible pane of some Invoice Matching pages to provide additional information to the AP reviewer in the context of a particular workflow, aiding in decision making. The reports are considered contextual, as the data displayed in the page influences what is displayed in the report.
The contextual pane also offers opportunities for customization of the solution. See the Merchandising Customization and Extension Guide for more details on modifying the base reports displayed in the Invoice Matching contextual panes or adding custom reports.
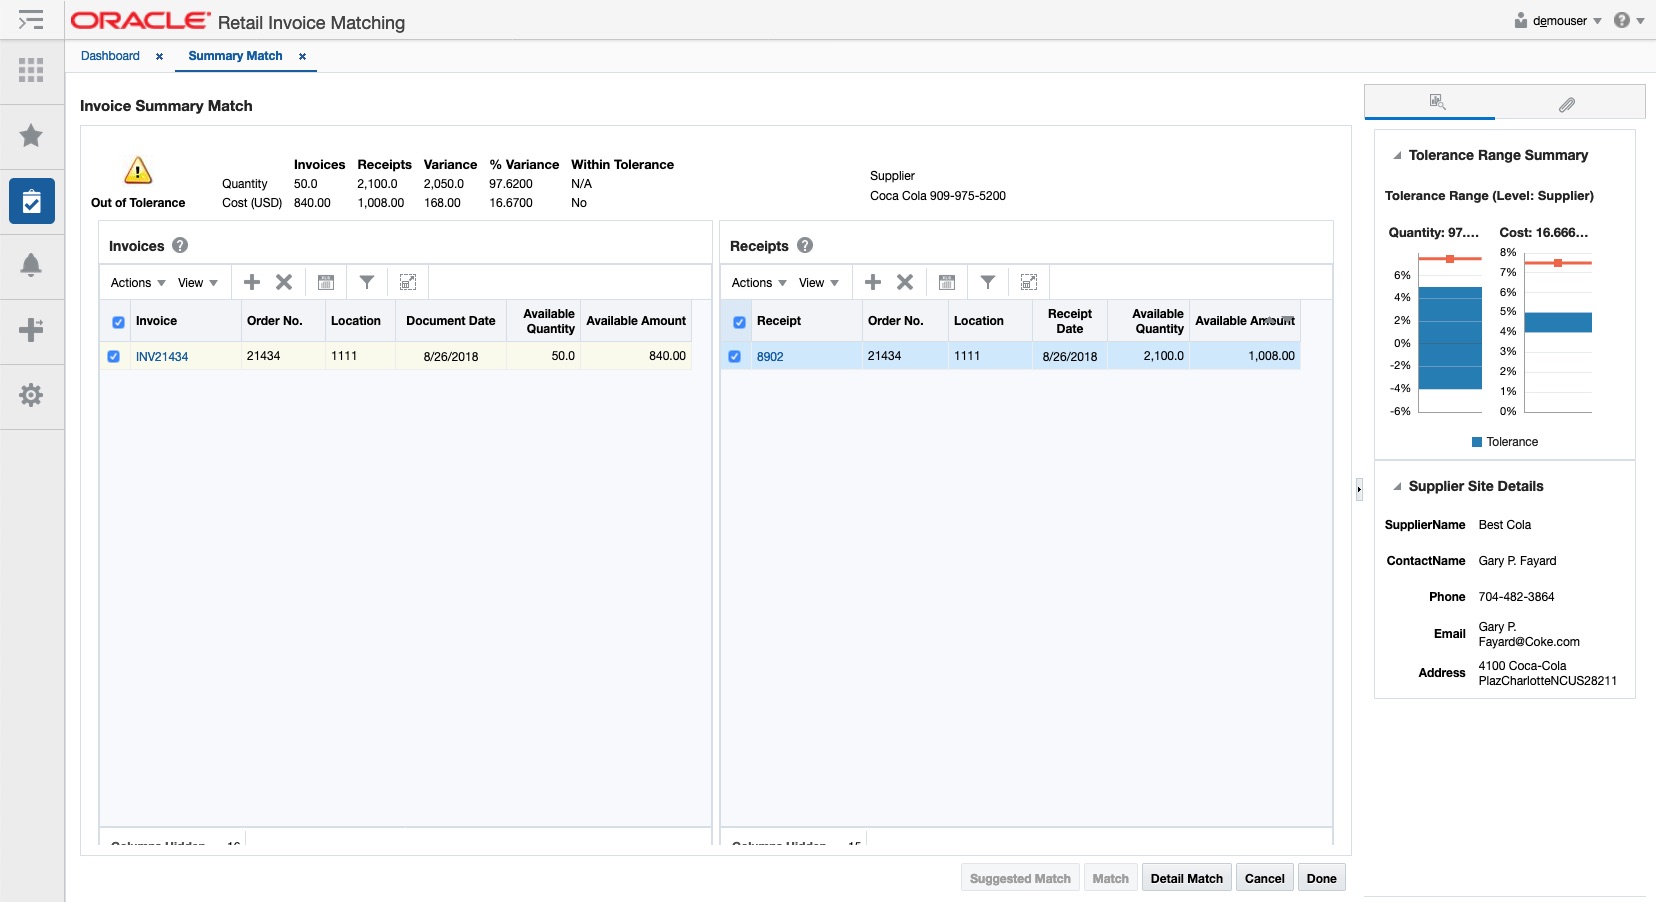
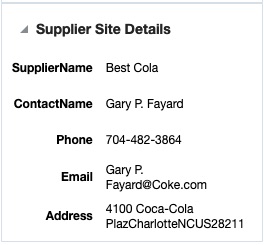
The Supplier Site Details report will provide you the necessary information to get in contact with the supplier site for the invoice being viewed. This report will be visible in the contextual pane of the Discrepancy Review List and Summary Match pages.
The details provided in the report are as follows:
Supplier Name
Contact Name
Address
Phone number
E-mail address
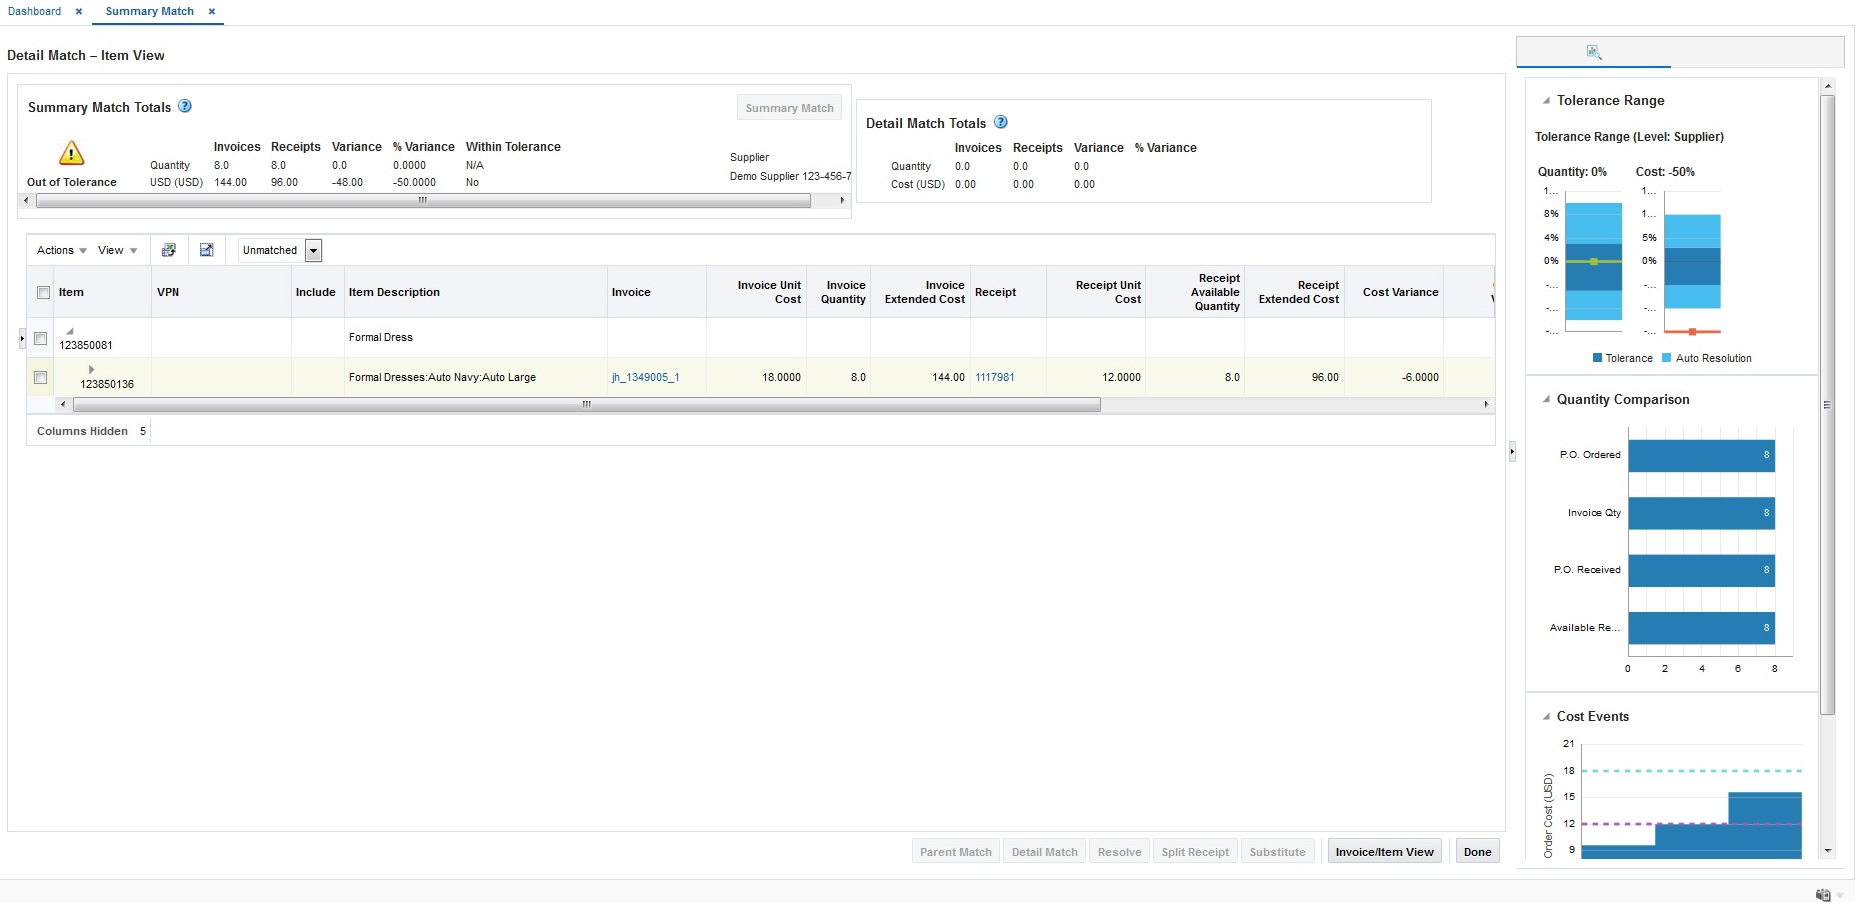
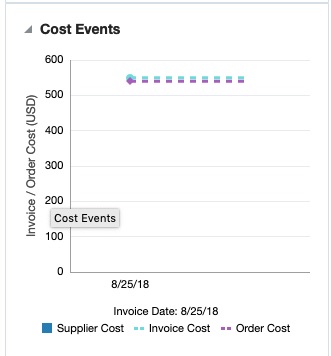
This report will provide you the visibility into the last two cost changes and one in the future using the invoice date as a reference. This may help explain why an invoice has a cost variance. This report is visible in the Discrepancy Review List and Detail Match pages.
The X axis of the report shows the dates that the cost changes either occurred or will occur and the Y axis shows the price points of the cost events. There are 2 lines that represent both the P.O. Cost and the Invoice cost of the invoice that is selected so you can see where the variance is.
The Detail Match window is a three-tiered table. If a parent row is in focus, the report is refreshed but will not show any data. If the transaction item row is in focus, the report is refreshed and PO Cost and Invoice cost will update based on the item. If the focus is on a row below the transaction item level, the report is not refreshed. The Discrepancy Review List is a single hierarchy table showing the transaction items, so the report will always be based on the row in focus.
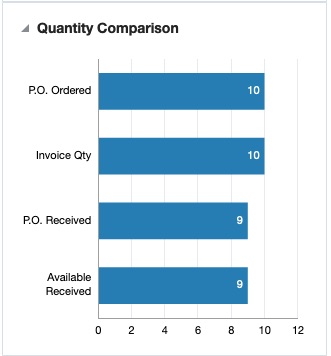
This Report gives you a quick glance at where the discrepancy lies in terms of quantity.
The report is visible when user is on the Discrepancy Review List and Detail Match pages.
The report is made up of 4 horizontal bars:
Invoice Qty
P.O. Ordered Qty
P.O. Received Qty
Available Received Qty
When you are on the Detail Match window and focus is on a transaction item row, the report will populate with data associated with the highlighted item. If a parent row is in focus, the report will be populated with totals selected for the parent. The Discrepancy Review List is a single hierarchy table showing the transaction item row, so the report will always be based on the row in focus.
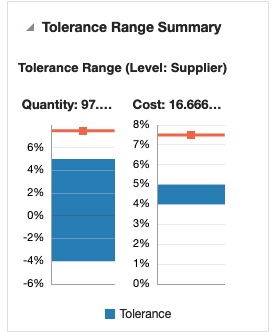
The Tolerance Range report shows you what the current tolerance ranges (both Qty and Cost) are for the invoice that is being reviewed. This could be at the supplier site level or higher. This report is visible in the Summary Match and Detail Match pages.
In the Summary Match page, the Tolerance Range report is triggered whenever an invoice or receipt is selected. The variance shown in the report is a visual representation of the variance shown in the Summary Match totals table in the top left quadrant of the window.
The report consists of two bars, one for the quantity tolerance range, and the other for the cost tolerance range. The cost (or quantity) variance is shown on the graph as a red line if it is out of tolerance or a green line if it is within tolerance.
The Tolerance Range Level shows the level that is currently being used for the invoice that is selected in the application. Available options for the Tolerance Range Level are: Supplier Site, Supplier, Supplier Group, Department or System.
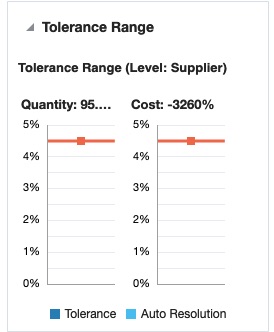
In the Detail Match page, the Tolerance Range report should be triggered when a parent row or a SKU row is highlighted. The tolerance range is based on the tolerance setting for the selected group of documents, and does not change as various item rows are selected. When a parent row is highlighted, the tolerance report uses parent level tolerances instead of line level tolerances. The variance however reflects the specific value from the highlighted row.
If an Auto Resolution threshold has been defined (for line item level tolerance setting), in the Detail Match window, the inner-bounds of that tolerance are displayed in a different color shade with the levels displayed. These levels show the split-out by tolerance and auto resolution tolerance. The Auto Resolution threshold is not shown in the report for the Summary match window, as this does not apply to this level. Move the cursor over the tolerance range bar to view the actual tolerance and auto resolution levels.