| Oracle® Retail Invoice Matching Mobile User Guide Release 22.1.301.0 F60736-01 |
|

 Previous |
 Next |
| Oracle® Retail Invoice Matching Mobile User Guide Release 22.1.301.0 F60736-01 |
|
Previous |
Next |
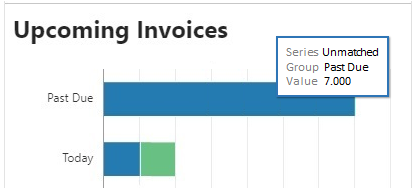
The Upcoming Invoices report at the top uses shaded bars to represent the remaining invoices that need to be manually matched by the user. The green shaded bars represent the invoices that have been manually matched and the blue shaded bars represent the invoices that are unmatched.
Chart date ranges include:
Past Due
Today
Tomorrow
2 days out
3 days out
Tap and Hold Over either of the shaded bars and a pop-up appears showing the numeric value of that shaded section of the bar.
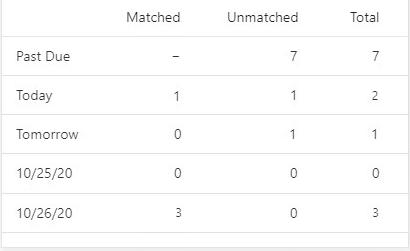
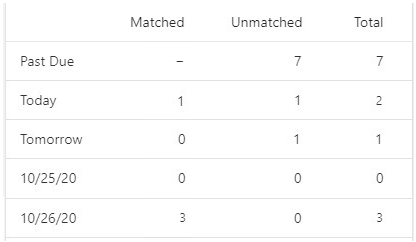
The table directly under the Upcoming Invoices section shows the number of matched and unmatched invoices for each date range listed previously. It also shows the total of the combined matched and unmatched invoices.
|
Note: The data displayed will be a roll up of all the employees that roll up to the user. For Past Due Matched, a dash will be displayed as it doesn't make functional sense to display a metric for invoices matched in the past. Unauthorized users will see zeros in this area. |
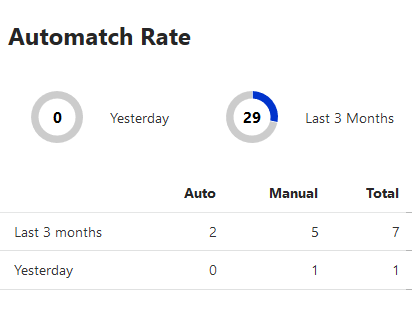
The Automatch Rate report allows you to quickly see the total number of invoices in matched status that were matched by the auto match batch in comparison with the total number of invoices that were manually matched by the Invoice Matching user. Auto resolved invoices are also included in the Automatch totals. The table underneath the Automatch Rate donut chart will show the totals.
The number shown and represented by the color gray is the number of invoices that were manually matched.
The percentage represented by the dark blue color is the number of invoices that were auto-matched.
The number in the center is the percentage of total matched invoices that were auto-matched.
The percentages are calculated for the user and can be viewed two different ways.
Yesterday
Last 3 months
The data displayed is as follows:
Finance Manager: Data will be a rollup of all of the employee's outstanding invoices. A manager's assigned suppliers (if any) are included in their data rollup.
Buyer: Buyer reports will have zeros displayed. A Buyer will only be able to search for suppliers or invoices but will not have any data filtered for them.
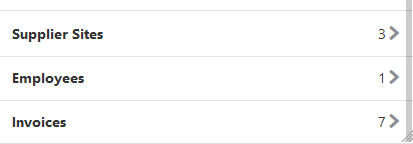
At the bottom of the dashboard is a section which allows you to drill down into more detail related to supplier site performance, employee performance, and outstanding invoices. In this section you can see the number of supplier sites to which you are assigned, the number of employees for which you are responsible, and how many outstanding invoices exist.
The following actions are available in this area:
Tap the Supplier Sites bar to open the Supplier Sites screen which displays a list of supplier sites to which you are assigned.
Tap the Employees bar to open the Employee screen which displays a list of employees for which you are responsible.
Tap the Invoices bar to open the Invoices screen which displays a list of outstanding invoices.