| Oracle® Retail Advanced Science Cloud Services User Guide Release 17.0 E95659-04 |
|

 Previous |
 Next |
| Oracle® Retail Advanced Science Cloud Services User Guide Release 17.0 E95659-04 |
|
Previous |
Next |
This chapter describes the use of the Affinity Analysis (AA) Cloud Service module.
Market basket analysis involves the use of data mining techniques to search for sales patterns between products within a given group of transactions. The output of that analysis provides a rule that defines the association found between products at the subclass or class level of the merchandise hierarchy.
A rule consists of one to three antecedents (IF attributes) and a single consequent (THEN attribute). For example:
IF (milk) and (juice), THEN (cereal)
In other words, if a customer purchases an item from the subclasses milk and juice, the customer will also purchase an item from subclass cereal. After a rule is defined, a user can use the AA interface to understand how strong the affinity is, using rule confidence and support. The probability that a customer will buy milk, juice, and cereal is known as the support percentage, while the conditional probability that they will buy cereal when they buy milk and juice is known as confidence. Rules with a very high support value occur frequently in your transaction history, while rules with a high confidence value represent a strong affinity between products.
After users have identified selling patterns, they can begin to take action based on those patterns, as well as the needs and goals of their product category. Suppose that a merchant is tasked with bringing in more margin dollars to the cereal category. Using the affinity rule in the preceding example, the merchant might work with the dairy category on a milk promotion to increase sales of milk. This in turn increases the sales of cereal, without sacrificing margin dollars on a cereal promotion. Note that this can require cross-category planning in some cases, as product affinities can sometimes occur between seemingly unrelated products (such as pet food and beer).
Another component of market basket analysis relates to the product assortments being sold in stores. Using product affinities and sales history, AA provides assortment recommendations that improve the revenue or margin of a category by suggesting product additions or removals. Products may be recommended for removal if they are found to be too similar to other products in the assortment (and thus cannibalize the sales of those products). Conversely, products that are not similar to any other items in the assortment may be candidates for inclusion, as they will not divert sales from the existing assortment.
Market basket rules are used to improve the assortment recommendation by showing the potential lift (or halo effect) on your overall sales due to any known affinities on recommended item additions. For example, if AA is analyzing an assortment for Coffee, and a particular item is part of a market basket rule that drive sales for Milk, then that item has a greater potential value for the lift it brings to the Milk category. AA may then recommend that item over other items in the category, because including it will bring in additional revenue to other assortments without changing those assortments directly.
The AA user interface consists of several screens that help the user analyze and take action on the results of the market basket analysis and assortment recommendation processes. The following list summarizes the main purpose of each screen:
Assortment Recommender - Review the product assortment recommendations made by AA, including the expected halo effects from items in the optimized assortment.
Top N Class Affinities - Review the market basket affinity rules identified by AA between different product classes, including insights around the frequency and profitability of the top rules.
Top N Subclass Affinities - Review the market basket affinity rules identified by AA between different product subclasses, including insights around the frequency and profitability of the top rules.
Top N Promotion Affinities - Review the market basket affinity rules identified by AA between different product subclasses under the effects of a promotion, which can be used to identify the effects promoting a category has on other non-promoted products.
Top N Customer Segment Affinities - Review the market basket affinity rules identified by AA between different product subclasses under the effects of a promotion and separated by customer segment, which provides insights into the top promoted product affinities for a targeted group of customers.
The way that you interact with the AA user interface depends on your business role and which insights you want to take action on. For example, a category planner looking to make changes to their assortment to increase margin dollars might start from the Assortment Rec screen. The planner might select the category and one of the top-selling locations, and then review the added or dropped items AA has recommended. From there, the planner can choose to move forward with the recommendations and make the necessary adjustments to the assortment plan or dive deeper into the Product Affinities screens to better understand why certain recommendations are being made.
Regardless of which screen you are viewing, a set of global prompts determines the data displayed throughout the application.
On first accessing the application, you make selections from the prompts and click on the Submit button, which will load the remaining application screens based on your selections. Modifying and submitting the prompt values after that time will refresh the screens with new data.
Table 8-1 AA Global Prompts
| Prompt Name | Description |
|---|---|
|
Top 10 By |
Select the primary metric used to rank the market basket results in all places where affinity rules are displayed. |
|
Fiscal Week From |
Select the starting week from which results must be displayed. The values displayed are the week of the Fiscal Calendar. |
|
To |
Select the ending week that results must be displayed for. |
|
Department |
Select the department from the merchandise hierarchy that results must be displayed for. All of the classes or subclasses on the THEN side of an affinity rule will be from the selected Department. |
|
Location |
Select the location from the location hierarchy that results should be displayed for. |
The Top 10 By prompt allows you to select from the following metrics, which are used to determine which affinity rules are displayed and how to sort the results that are shown.
Table 8-2 Top 10 By Options
| Metric Name | Description |
|---|---|
|
Net Sales |
Chooses the top N rules in each screen, based on the net sales retail amount (e.g., Avg Sales from If Items) |
|
Net Quantity |
Chooses the top N rules in each screen, based on the net sales quantity (e.g., Avg Sales Quantity from If Items) |
|
Net Profit |
Chooses the top N rules in each screen, based on the net sales profit (e.g., Avg Profit from If Items) |
Although this prompt indicates "Top 10", you have the ability to select more than 10 results by changing the Top selection in the Market Basket Filters area of the screen, as discussed later in this chapter.
The Fiscal Week From and To prompts allow you to select a range of dates for which the results are returned. Market basket affinity rules may change over time as new sales transactions are processed, so selecting the weeks to review ensures that only the rules that are applicable for that period of time are displayed.
The Department prompt displays a list of departments from the merchandise hierarchy. Selecting a department will limit the data in all screens such that the consequent (or THEN components) of an affinity rule will be from that department.
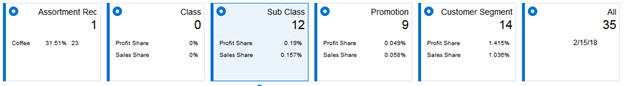
After all selections are made and the Submit button is clicked, the interface will refresh and display results. Each section of the application is organized under an informational tile that describes the purpose of the screen, along with summarization metrics.
Each tile has the following general properties.
Table 8-3 Info Tile Components
| Component | Description |
|---|---|
|
Title |
A descriptive name for the data contained below the selected tile. |
|
Primary Metric |
A key measure that highlights important data, such as the number of affinity rules available for review for a given set of prompt selections. |
|
Secondary Metrics |
Additional measures that describe the underlying data available when clicking on the info tile. |
Clicking on any info tile's title or primary metric will display the associated data in the lower section of the screen. The data shown in each tile in the application is described in Table 8-4.
Table 8-4 Info Tile Metrics
| Tile Name | Primary Metric Description | Secondary Metric Description |
|---|---|---|
|
Assortment Rec |
The number of assortment recommendations available for the selected global prompt values. |
For the assortments in the department, the percentage the sales amount changed and the amount the sales changed. |
|
Class |
The number of class level market basket affinity rules available for the selected global prompt values. |
The share of sales profit and sales amount that is represented by all discovered association rules out of the total sales profit and sales amount processed. |
|
Sub Class |
The number of subclass level market basket affinity rules available for the selected global prompt values. |
The share of sales profit and sales amount that is represented by all discovered association rules out of the total sales profit and sales amount processed. |
|
Promotion |
The number of promoted subclass level market basket affinity rules available for the selected global prompt values. |
The share of sales profit and sales amount that is represented by all discovered association rules out of the total sales profit and sales amount processed. |
|
Customer Segment |
The number of customer segment promoted subclass level market basket affinity rules available for the selected global prompt values. |
The share of sales profit and sales amount that is represented by all discovered association rules out of the total sales profit and sales amount processed. |
|
All |
The total number of market basket affinity rules available for the selected global prompt values. |
The last date that market basket insights were executed on. |
The assortment recommender screen provides insights on ways to improve the mix of products in a store assortment, using a combination of data from Demand Transference and Affinity Analysis. This section describes the data shown in the screen, as well as how to use the results to take action within your business. For more information on Demand Transference, refer to Demand Transference.
The first step in using the assortment recommender screen is to select a store and assortment to review. The stores listed in the drop-down menu are limited to those stores that have completed an assortment recommendation calculation for the selected department in the selected period. The assortment drop-down menu is limited to those assortments with a completed assortment recommendation calculation for the date range, department, and location previously selected, and align with the level of the product hierarchy that assortment-planning operations occur at. For example, if we process Coffee on Week 1, Yogurt on Week 2, and Milk on Week 3, and we pick a date range of Weeks 1-3 in the global prompts, we will show results for those three categories.
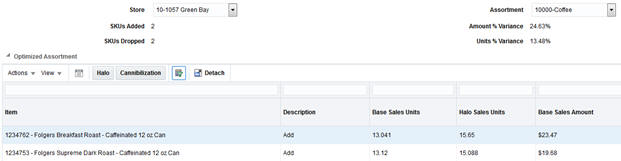
After selecting a store and an assortment, the screen displays data showing the system-optimized product list and the original product list, along with several summary metrics.
Table 8-5 Assortment Optimization Summary Metrics
| Field Name | Description |
|---|---|
|
SKUs Added |
The number of SKUs added to the assortment by the optimization process. |
|
SKUs Dropped |
The number of SKUs removed from the assortment by the optimization process. |
|
Amount % Variance |
The change in sales retail amount for the assortment after SKUs are added and dropped by the optimization, based on average weekly sales. |
|
Units % Variance |
The change in sales units for the assortment after SKUs are added and dropped by the optimization, based on average weekly sales. |
Table 8-6 lists the summary metrics that the optimized assortment table displays insights into expected product performance if the recommendations are applied to your assortment.
Table 8-6 Optimized Assortment Table
| Field Name | Description |
|---|---|
|
Item |
The item number and description of the SKU in the assortment. |
|
Description |
The recommended change for a SKU in the assortment. This may either be to keep an existing SKU or add a SKU that was not previously in the assortment. |
|
Base Sales Units |
The average weekly sales units of the SKU at the selected location. |
|
Halo Sales Units |
The average weekly sales units of the SKU at the selected location, after adjusting for demand as a result of Halo sales due to market basket affinity rules involving the SKU. |
|
Base Sales Amount |
The average weekly sales amount of the SKU at the selected location. |
|
Halo Sales Amount |
The average weekly sales amount of the SKU at the selected location, after adjusting for demand as a result of Halo sales due to market basket affinity rules involving the SKU. |
|
Base Sales Profit Amount |
The average weekly sales profit of the SKU at the selected location. |
|
Halo Sales Profit Amount |
The average weekly sales profit of the SKU at the selected location, after adjusting for demand as a result of Halo sales due to market basket affinity rules involving the SKU. |
|
Incremental Demand |
The number of sales units of the SKU that do not transfer to any other SKU in the assortment if it were to be deleted from the assortment. |
|
Substitutable Demand |
The number of sales units of the SKU that can transfer to other SKUs in the assortment if it were to be deleted from the assortment. |
The primary purpose of the recommendations is to highlight the optimal mix of products, based on a pre-defined optimization target (which can be sales units, amount, or profit). The optimization process takes into account the product similarities and assortment elasticity (as generated by Demand Transference) to determine which products are candidates for addition or removal from the current assortment. It also uses the market basket affinity rules to identify additional sales generated by the SKUs in the assortment in other product categories. For example, a SKU that belongs to Subclass A, which has a strong affinity with sales of Subclass B, is effectively generating a certain amount of additional sales outside of the assortment itself just by being included.
This combination of inputs into the optimization process may result in SKUs being added or dropped from the assortment. A SKU that has been dropped from the assortment may have been found to be too similar to other existing SKUs (thus its removal will transfer the majority of the demand for that SKU to other similar items). A dropped SKU may also have had a low contribution to sales in that assortment, either due to a lack of affinity rules generating additional halo effects, or because other SKUs available for addition provided better results and were swapped in. The system may recommend product additions when it has identified SKUs that will improve the optimization target, such as sales profit. It may also recommend adding a SKU when there are no similar SKUs currently in the assortment, so adding the new SKU will not cannibalize much demand from other items.
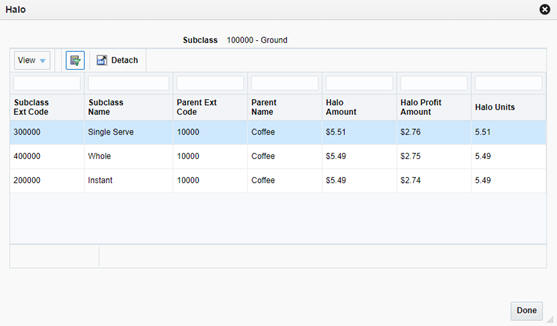
If you want to analyze the recommendations further, the system provides pop-up windows displaying Halo and Cannibalization effects relating to the selected item from the Optimized Assortment table. Select a row in the table, and then click the Halo or Cannibalization buttons on the task bar to review the data.
Table 8-7 Halo Effects
| Field Name | Description |
|---|---|
|
Subclass Ext Code |
The numeric identifier for a subclass with a halo effect from the SKU. |
|
Subclass Name |
The descriptive name for a subclass with a halo effect from the SKU. |
|
Parent Ext Code |
The numeric identifier of the parent class for a subclass. |
|
Parent Name |
The descriptive name for the parent class for a subclass. |
|
Halo Amount |
The calculated halo effect on the subclass's sales amount. |
|
Halo Profit Amount |
The calculated halo effect on the subclass's sales profit. |
|
Halo Units |
The calculated halo effect on the subclass's sales units. |
The Halo pop-up window provides insights into the secondary effect of a SKU on other products. Products with strong market basket affinities may generate large halo effects and thus be good candidates for your assortment.
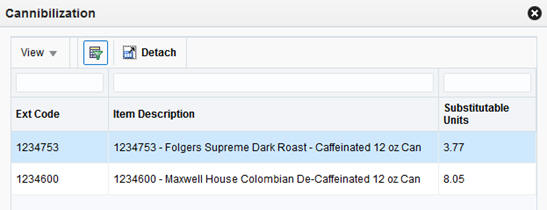
When evaluating the additions and removals on your assortment, it can also be helpful to understand cannibalization effects. These effects are based on the product similarities and assortment elasticities obtained from Demand Transference. Products that are very similar to each other tend to split up the customer demand for this kind of product, since the customer is not likely to buy two similar products. Conversely, products that are not very similar will not have as much overlapping demand. The Cannibalization pop-up window provides some of these insights.
Table 8-8 Cannibalization Effects
| Field Name | Description |
|---|---|
|
Ext Code |
The numeric identifier for a SKU that is cannibalized by the selected assortment SKU. |
|
Item Description |
The descriptive value for the SKU. |
|
Substitutable Units |
The calculated number of sales units that can be cannibalized from other SKUs when the assortment SKU is added, or the number of units transferred to these SKUs when the assortment SKU is dropped. |
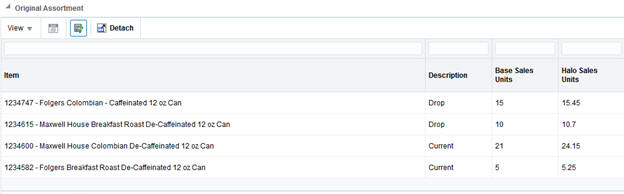
At the bottom of the screen, you can also see the original assortment, along with any SKUs from the assortment that have been dropped in the recommendation.
Table 8-9 Original Assortment
| Field Name | Description |
|---|---|
|
Item |
The item number and description of the SKU in the assortment. |
|
Description |
The recommended change for a SKU in the assortment. This may either be to keep an existing SKU or drop a SKU that was in the assortment. |
|
Base Sales Units |
The average weekly sales units of the SKU at the selected location. |
|
Halo Sales Units |
The average weekly sales units of the SKU at the selected location, after adjusting for demand as a result of Halo sales due to market basket affinity rules involving the SKU. |
|
Base Sales Amount |
The average weekly sales amount of the SKU at the selected location. |
|
Halo Sales Amount |
The average weekly sales amount of the SKU at the selected location, after adjusting for demand as a result of Halo sales due to market basket affinity rules involving the SKU. |
|
Base Sales Profit Amount |
The average weekly sales profit of the SKU at the selected location. |
|
Halo Sales Profit Amount |
The average weekly sales profit of the SKU at the selected location, after adjusting for demand as a result of Halo sales due to market basket affinity rules involving the SKU. |
The assortment recommendations provided within AA aim to achieve the maximum possible value for the chosen target sales measure, such as profit or revenue. Assortment planners may use the results of this process while preparing for the next selling season or fiscal period in order to adjust their current assortments based on their business strategy. Planners may choose to accept the recommendations as-is, or choose a subset of changes in order to see how that will affect their financial targets and assortment plan. This modified assortment can then be provided to AA and reprocessed in the future to refine the recommendations.
The following example describes the workflow of an assortment planner (Anne) working to improve sales in the Coffee category.
Anne starts with the existing assortment of coffee items available in stores, along with current performance measures describing how each item is selling. She knows that certain items are performing poorly and wants to mark them for removal from the assortment. She also has a list of new items that can be added to the assortment. All of this information is provided as inputs to AA prior to performing the optimization process.
After AA has been provided with the assortments and lists of possible changes that Anne wants to make, the system will schedule and execute the optimization process using pre-defined business rules (such as the maximum number of items that can be added or dropped by the system).
Knowing the process executed over the weekend, Anne logs into AA on Monday morning to review the results. She selects a location and her Coffee assortment in the UI prompts, and then begins to analyze the recommendations.
AA has selected three items in the current assortment to be dropped and another four items that should be added. Anne first looks at the dropped items and compares them to the other items she was thinking about removing. She notes that the dropped items are not the worst-selling ones she had chosen, but AA shows them as contributing very little to halo effects in other areas, so they may have very weak market basket affinities that contribute to their removal.
Anne next reviews the recommendation for items to add to the assortment. Of the four items that AA has chosen, three of them have significant halo effects driven by the market basket affinities. Anne is not as sure about the last item, so she selects it and clicks on the Cannibalization button. She notes that the item has relatively low substitutable demand from other items, suggesting it is not very similar to anything in her current assortment. This makes it a good candidate for addition, as it can bring in new demand that the assortment may not have today.
Anne decides to accept all of the recommendations made by AA for this assortment, exports the results to Excel for later reference, and then exits the system to make the necessary changes to her assortment plan.
The remaining screens of the application all relate to the market basket affinity rules generated by AA. The tiles and screens provide a way to view different sets of data, depending on the configurations used for your business.
Market basket rules and their associated metrics are a key insight into product demand and customer buying behaviors. Understanding which products are more likely to sell together allow your business to coordinate targeted offers and promotions for products that have strong affinities elsewhere, without having to promote those other categories. It is also possible to understand market basket differences between customer segments, allowing you to further refine your sales and promotion strategies to target specific groups of customers that will bring in the most value to your business.
There are five screens available for viewing the AA results, each containing a different subset of affinity rules with certain characteristics as described below.
Table 8-10 Market Basket
| Field Name | Description |
|---|---|
|
Class |
Displays market basket affinities between different classes, without any consideration for whether the items were on promotion or not. |
|
Subclass |
Displays market basket affinities between different subclasses, without any consideration for whether the items were on promotion or not. |
|
Promotion |
Displays market basket affinities between different subclasses when the antecedent (if) components are promoted and the consequent (then) components are not promoted. |
|
Customer Segment |
Displays market basket affinities between different subclasses when the antecedent (if) components are promoted and the consequent (then) components are not promoted, further separated by customer segments. |
|
All |
Displays a searchable list of all available affinity rules for all types. |
After you select one of the five info tiles at the top of the screen, you will be presented with additional filter prompts and a data table for displaying results.
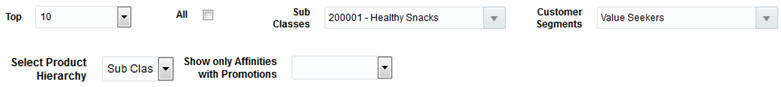
The filters above the table allow you to limit the data displayed in the table. AA can generate a large number of rules, and usually only the most common rules supported by the largest amount of sales transactions are used in analyses. Which filters are displayed will depend on the current screen being viewed. Table 8-11 provides an explanation of how all the filters impact the displayed results.
Table 8-11 Market Basket Filters
| Filter Name | Description |
|---|---|
|
Top |
Selecting a different number changes how many market basket rules are displayed in the results table. |
|
All |
Selecting the check box overrides the Top filter to instead display all available market basket rules. |
|
Classes/Subclasses |
Select specific classes or subclasses for which market basket rules should be displayed. This filter will be applied as an OR condition for either the IF components or the THEN components. If there are multiple IF components, then a match is only required for one of the components. |
|
Customer Segments |
Select specific customer segments for which market basket rules should be displayed. |
|
Select Product Hierarchy |
(All Screen Only) This prompt is used to choose which level of the hierarchy you are entering search criteria for. |
|
Show only Affinities with Promotions |
(All Screen Only) This prompt allows you to choose whether the results should be limited to promoted subclass affinities. |
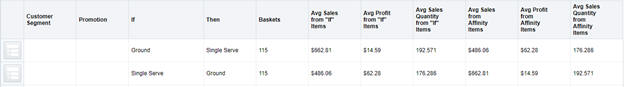
Once you have selected your desired filter settings, you may begin to review the market basket affinities. The main table on each screen describes the product affinities that were found when analyzing the market basket data, sorted in descending order by your chosen performance metric (the Top 10 By global prompt described earlier in this chapter). In addition to the product affinities, numerous metrics are provided to describe the market basket data that contains these products.
Table 8-12 Market Basket Affinities
| Field Name | Description |
|---|---|
|
Customer Segment |
(Customer Segment screen only) Displays the customer segment for which the product affinity was found. |
|
Promotion |
(All affinities screen only) Displays whether the rule represents IF components that were on promotion. |
|
If |
Displays the classes or subclasses containing items that were purchased in the market baskets for a given product affinity. All market baskets that contributed to a rule will contain items from these product categories. |
|
Then |
Displays the class or subclass that was found to have an affinity with the IF components of the market basket rule. Market baskets containing the IF categories were found to contain items from the THEN category enough times to establish a product affinity between the IF and THEN components. |
|
Baskets |
The number of market baskets that contain items from both the IF and THEN components of the rule. |
|
Avg Sales from If Items |
The average sales retail amount from items belonging to the IF classes or subclasses. |
|
Avg Profit from If Items |
The average sales profit from items belonging to the IF classes or subclasses. |
|
Avg Sales Quantity from If Items |
The average sales units from items belonging to the IF classes or subclasses. |
|
Avg Sales from Affinity Items |
The average sales retail amount from items belonging to the THEN class or subclass. |
|
Avg Profit from Affinity Items |
The average sales profit from items belonging to the THEN class or subclass. |
|
Avg Sales Quantity from Affinity Items |
The average sales units from items belonging to the THEN class or subclass. |
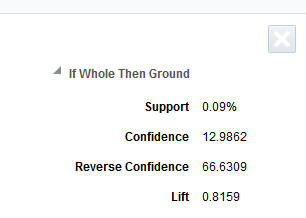
The purpose of these summary metrics is to provide a quick view of the sales and profitability of the market baskets described by each rule. Even though a market basket affinity is present in a large number of baskets, it may not generate much profit or be of particular interest to the business user at this time. The summary metrics allow the user to quickly identify market basket affinities that are worth analyzing in more detail. Once the user has selected a rule to investigate, clicking that row in the table generates additional information about it in a panel to the right side of the screen.
Table 8-13 Market Basket Affinity Details
| Field Name | Description |
|---|---|
|
Support |
The percent of market baskets that contain items from the IF and THEN components of the rule. Written as a formula: Rule Transaction Count/Total Transaction Count |
|
Confidence |
The ratio of the number of transactions where the entire rule is present, compared to all transactions containing IF items. Written as a formula: Rule Transaction Count/Total IF Transaction Count |
|
Reverse Confidence |
The ratio of the number of transactions where the entire rule is present, compared to all transactions containing THEN items. If a rule has a higher Reverse Confidence than its own Confidence value, then it indicates that the rule is better represented by the reversal of the IF and THEN components. Written as a formula: Rule Transaction Count / Total THEN Transaction Count |
|
Lift |
A statistical measure of how strong the product affinity is, as compared to random chance for the rule (higher is better). Written as a formula: Rule Transaction Count * Total Transaction Count / Total IF Transaction Count/Total THEN Transaction Count |
|
Sales Amt Pct Of Total |
The percent of total sales retail amount that the rule represents. Written as a formula: Rule Sales Amount/Average Weekly Total Sales |
|
Avg Rule Sales Amt |
The average weekly sales retail amount across all transactions containing the rule. |
|
Avg Rule Sales Profit Amt |
The average weekly sales profit across all transactions containing the rule. |
|
Avg Rule Sales Qty |
The average weekly sales units across all transactions containing the rule. |
|
Avg Total Sales Amt |
The average weekly sales retail amount across all transactions. |
|
Avg Tot Sales Profit Amt |
The average weekly sales profit across all transactions. |
|
Avg Tot Sales Qty |
The average weekly sales units across all transactions. |
|
Avg Tot Txn Cnt |
The average weekly transaction count across all transactions. |
The detailed metrics for a rule provide more ways to evaluate if the rule is going to be useful for your business purpose. For example, a rule that has both high support and high confidence represents a strong product affinity that is purchased by many of your customers. Any action taken on the categories in such a rule, such as promoting a subclass on the IF side of the rule, can have significant benefits for the THEN components of the rule. Another way to use these metrics is to consider the average sales or profit that a rule brings in relative to total sales over the same period. Rules that represent a significant profit amount may be a more valuable target for your efforts than rules with lower profitability.
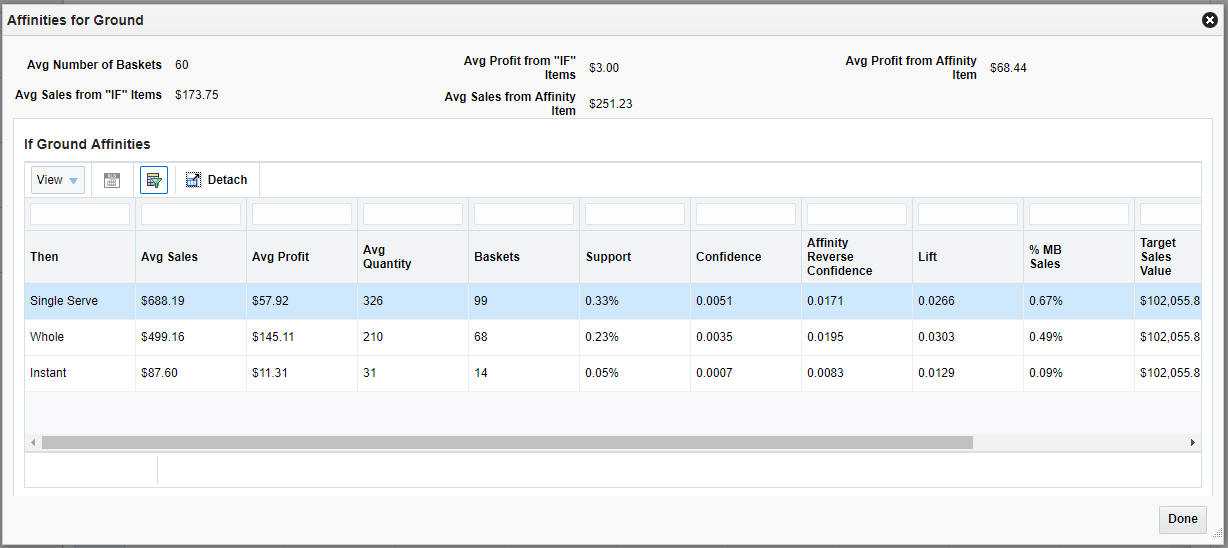
Another way to view the market basket affinities is to click the button found to the left of each row in the data table. This button displays a pop-up window with all of the product affinities that have been found for the IF components of the rule. This can be especially useful when your goal is to find any relationships with a specific product category, rather than seeing all of the relationships between different products.
This screen is split into two main sections: the top section displays summary metrics for all rules associated with the IF components, and the bottom section displays all of the product affinities found for the IF components and a selection of detailed metrics for them.
Table 8-14 Targeted Product Affinities Summary Metrics
| Field Name | Description |
|---|---|
|
Avg Number of Baskets |
The average number of baskets found on a rule containing the IF items. |
|
Avg Sales from IF Items |
The average sales retail amount for the IF items in the rules. |
|
Avg Profit from IF Items |
The average sales profit for the IF items in the rules. |
|
Avg Sales from Affinity Item |
The average sales retail amount for the THEN items in the rules. |
|
Avg Profit from Affinity Item |
The average sales profit for the THEN items in the rules. |
Table 8-15 Targeted Product Affinities Detail Metrics
| Field Name | Description |
|---|---|
|
Then |
Displays the class or subclass that was found to have an affinity with the IF components of the market basket rule. |
|
Avg Sales |
The average weekly sales retail amount for the IF and THEN items in the rules. |
|
Avg Profit |
The average weekly sales profit for the IF and THEN items in the rules. |
|
Avg Quantity |
The average weekly sales units for the IF and THEN items in the rules. |
|
Baskets |
The number of market baskets that contain items from the IF and THEN components of the rule. |
|
Support |
The percent of market baskets that contain items from the IF and THEN components of the rule. |
|
Confidence |
The ratio of the number of transactions where the entire rule is present, compared to all transactions containing IF items. |
|
Affinity Reverse Confidence |
The ratio of the number of transactions where the entire rule is present, compared to all transactions containing THEN items. |
|
Lift |
A statistical measure of how strong the product affinity is, as compared to random chance for the rule (higher is better). |
|
% MB Sales |
The percent of total sales retail amount that the rule represents. |
|
Target Sales Value |
The average weekly total sales retail amount across all transactions in the selected periods. |
|
Target Profit |
The average weekly total sales profit across all transactions in the selected periods. |
|
Target Sales Quantity |
The average weekly total sales units across all transactions in the selected periods. |
This view of market basket affinities provides powerful insight into the relationships between different product categories, as it may expose affinities even between seemingly unrelated categories that your customers tend to purchase together. This screen allows you to see how actions taken on the target (IF) products will impact other areas within your business. For example, any action taken to increase the sales of an IF category can lift the sales of all other products with a strong affinity to those items. Conversely, if you have a category that is performing poorly on the THEN side of a rule, you may be able to take action on the IF products to boost that category's sales indirectly.
There are a variety of ways to take action within your business based on the insights that AA provides. The most common use is to develop a promotion strategy that takes advantage of product affinities to maximize halo effects across other categories. By reducing the amount spent on promotions while increasing the effect of those promotions, you can realize additional revenue and boost profit margins. For example, by analyzing the AA results, it is possible to identify multiple product categories with affinities on a target category, where some categories are more profitable than others. This can provide alternatives for promoting items that will yield more in sales or profit than a more obvious affinity like Hot Dogs and Hot Dog Buns.
Another common practice is for store planners and planogrammers to take advantage of product affinities when deciding how to arrange the products on the shelf or for adding aisle end-caps for strongly associated product categories. AA can show obvious relationships like Bread and Peanut Butter, but it may also reveal previously unknown associations like Pet Food and Beer. Using market basket rules to inform store layouts allows you to place commonly purchased groups of products close together in the store, increasing the chance of customers purchasing more from those categories.
Combining market basket analysis with customer segments further enhances the potential benefits of AA. Customer behavior information is obtained from mining transaction history, and it is correlated with customer segment attributes to inform your promotion strategies. The ability to understand market basket affinities allows marketers to calculate, monitor, and build promotion strategies based on critical metrics such as customer profitability and preferred categories.
As an example, consider a marketer that is planning promotions for the Soda and Chips categories. While analyzing the data in Affinity Analysis, the marketer finds that a particular customer segment, College Singles, has a very strong affinity for buying Soda any time they purchase Chips.Armed with this knowledge, the marketer may decide to create a targeted offer for this customer segment only on the Chips category, knowing that they are likely to also buy Soda in the same basket. This kind of offer is more cost effective than a company-wide promotion on both the chips and soda categories, but may yield almost the same results, because the offer has focused in on the customers that will generate the most revenue in these categories.