| Oracle® Retail Allocation Reports User Guide Release 22.1.301.0 F59763-01 |
|

 Previous |
 Next |
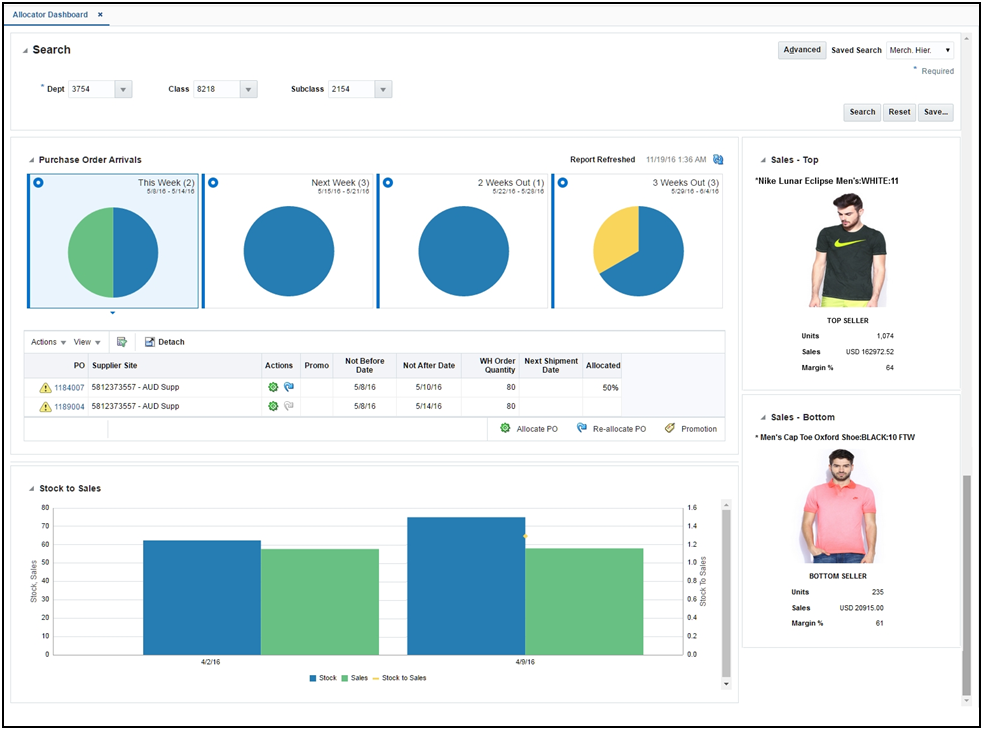
The dashboard surfaces information in a manner that will give allocators visibility to the highest priority tasks, such as incoming POs that need allocating or re-allocating and visibility to potential stock shortages in stores based on sales forecasts. The dashboard also provides a quick way for the allocator to take action on these alerts by launching them contextually into the appropriate Allocation workflows.
The dashboard reports can be viewed by navigating to Tasks menu > Reports > Allocator Dashboard in Allocation.
Users can filter data across the dashboard reports by selecting appropriate values in the prompts provided. You must select a department, but you can also optionally filter on class and subclass.
Allocator Dashboard Reports:
Purchase Order Arrivals Report
Stock to Sales Report
Sales – Top Report
Sales – Bottom Report
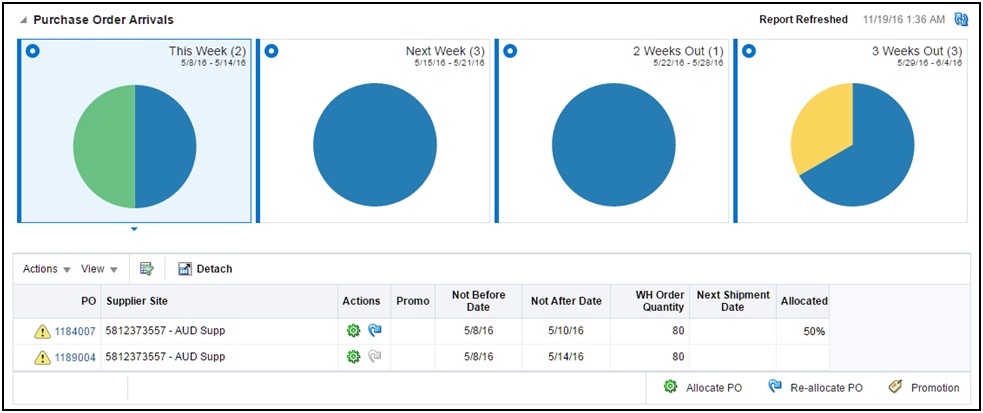
The report consists of two parts:
Tile view that displays the number of POs that are incoming segregated by their not after date in This Week, Next Week, 2 Weeks Out and 3 Weeks Out, respectively. The report also indicates the number split of these incoming POs that are unallocated, fully allocated and partially allocated. You can view the pie chart to deduce the ratio of the incoming POs that are fully allocated, partially allocated and unallocated. You can select a tile to view the details of the POs in a table below that are expected to be received in the given time period. By default, the ’This Week' tile is selected. A refresh feature is also available to update the tiles to reflect the latest data conditions for the selected merchandise hierarchy.
Tabular report that lists the POs and the corresponding ordered quantities that are expected to be received in the time line corresponding to the selected tile. Below PO details can be viewed:
Supplier Site against which the PO is raised
Not Before Date and Not After Date of the PO; that is, the time window within which the PO is expected to be received
Next Shipment Date, the date when the next shipment is expected to be received for the given PO
Ordered Qty, the remaining ordered quantity that is expected to be received in the chosen time period
Allocated %, which is the percentage of the ordered qty that has already been allocated for a given PO
An alert is displayed against the POs that have not yet been allocated above the defined Percentage Allocated PO Threshold beyond the PO Allocation Time threshold, which are system options. For example, if the Percentage Allocated PO Threshold is set to 80% and the PO Allocation Time Threshold is set to 5 days, and if the order quantity expected to be received is 100, then an alert is displayed for a PO that has a Not After Date that is less than 5 days from today and if the already allocated quantity against the PO is less than 80.
The report also indicates if any of the items on the given PO is on a promotion during the given time period as additional guidance in prioritizing the allocation process.
Using the below action links, the allocator can launch the Allocation Maintenance window to create or edit allocations.
Allocate PO – You can click on the allocate PO icon to initiate a workflow to create an allocation for all items on the Purchase Order for the quantities expected to be received on the PO. The allocate PO is displayed only if the quantity against the PO that is yet to be received has not yet been completely allocated.
Reallocate - You can click on the Reallocate icon to initiate a workflow to edit an existing allocation associated to the given PO. This is displayed only if an allocation already exists for the given PO. In case multiple allocations exist against the same PO, the allocation that was created most recently is launched.
The allocator can also click on the purchase order number hyperlink and contextually launch the PO Header Maintenance window of Merchandising and view the purchase order details. This requires that the user has the privileges to view or maintain a purchase order in Merchandising.
|
Note: If the items on a given PO have varied units of measure, Multi UOM is displayed in the Ordered Qty field, as quantity aggregation cannot be performed across multiple UOMs. |
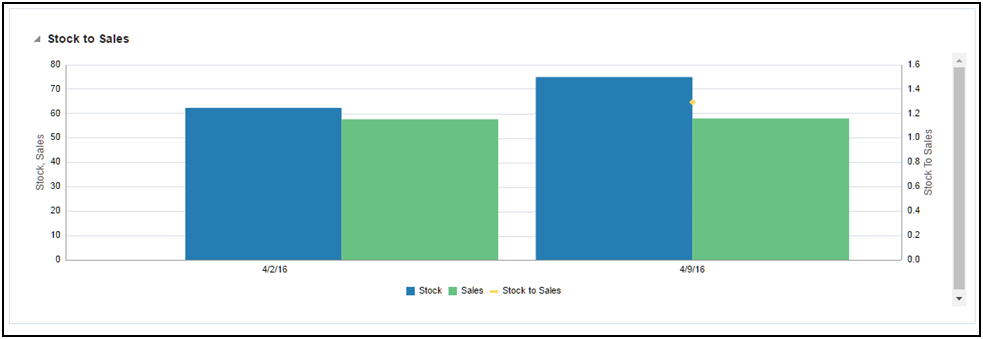
The Stock to Sales report compares the stock available for sale at the beginning of the given week and the corresponding sales achieved by the end of the same week. Data for six weeks prior to the current week can be viewed in this report. The stock and sales is aggregated across all items belonging to the Department/Class/Subclass selected in the prompts and group of stores that source from the selected VWH.
The report also plots the trend of Stock to Sales ratio for six previous weeks to provide historical context to the allocator of the inventory levels in their stores and help gauge where overage or shortage situations occurred.
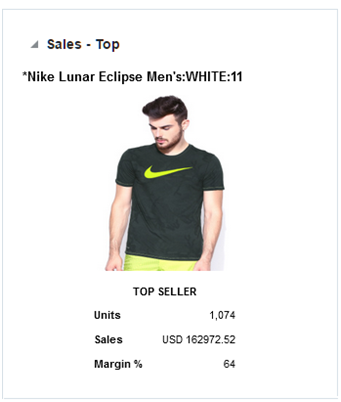
The Sales - Top report displays the top selling item across the Department/Class/Subclass selected in the prompts for a day prior to the current business day.
Additional data on the given item such as the item image, total sales units, retail value of sales and the margin can be viewed.
|
Note: For fashion items, the top seller will represent an item parent - diff aggregate. |
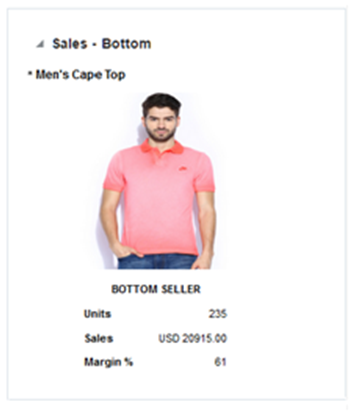
The Sales - Bottom report displays the least selling item across the Department/Class/Subclass selected in the prompts for a day prior to the current business day.
Additional data on the given item such as the item image, total sales units, retail value of sales and the margin can be viewed.
|
Note: For fashion items, the bottom seller will represent an item parent - diff aggregate. |