Through exploration, data quality issues often come to the surface. You must triage them and, in many cases, correct, clean, or change data in some way. The interactive Transform area in Studio helps you turn your data into data that is fit for advanced analysis.
Transform helps you isolate data quality problems and lets you quickly apply a number of data transformations to clean or restructure the data.
You can find Transform in Studio here:
![]()
- You can focus on just a few basic transformations needed to support your visualization or analysis. You do this by running common data transformations, such as filling missing values, converting data types, collapsing values, reshaping, pivoting, grouping, merging, and extracting.
- You can join one or more data sets together within a project and also aggregate attribute values to create new derived attributes that sum, average, find minimum/maximum values, and run other operations.
- You can use live
Preview to see the set of transformations in
action before applying them to the entire data set in Studio.
Because data transformation and data exploration are two integral aspects of any discovery project, you can seamlessly transition between Transform and Explore within a unified interface, which promotes a smooth workflow.
- You can also share your transformation scripts with other BDD users in your team.
Here is an example of what Transform looks like in a project:
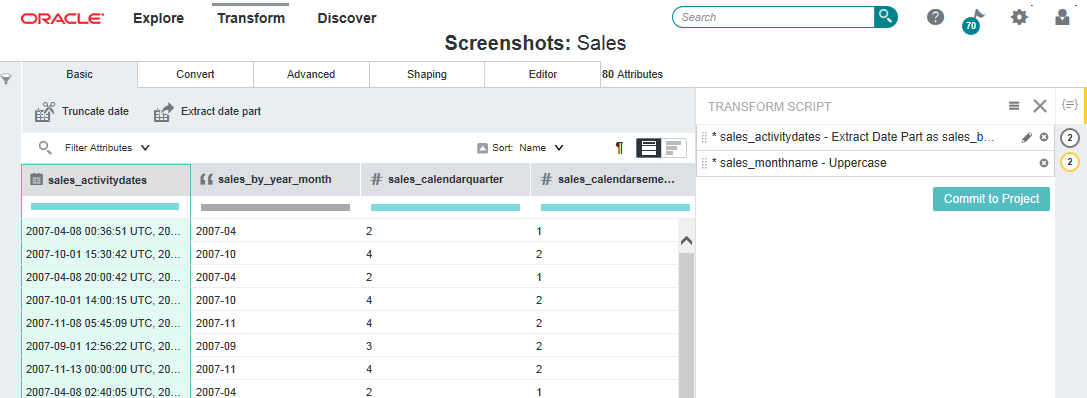
In this image, you can see the Transform area of Studio. Notice the drop-down attribute menu in the second column. It includes options to hide an attribute, mark it as favorite, edit it, and sort it. To the right, you can also see the Transform Script panel, with three transforms created by the project's user.
Also notice the transform menu just under the header. The Transform menu is made up of the tabs: Basic, Convert, Advanced, Shaping, and Editor.
- If you select a date time attribute, the Basic tab displays the Truncate date and Extract date part transforms. These are both transforms that are contextually appropriate for date time attributes.
- If you select a numeric attribute, the Basic tab displays the Absolute value transform. The Absolute value transform is contextually appropriate for numeric attributes.
After you run the transform script by clicking Commit to Project, the data is transformed and ready for further analysis.
