You can create a new Thematic Map component in either the scratchpad or the Discover page.
Choosing the geocode attribute for the thematic map
From the Geo Attribute list, you can select an attribute name on which to aggregate records in the thematic map.
Choosing a geographic grain region for the thematic map
From the
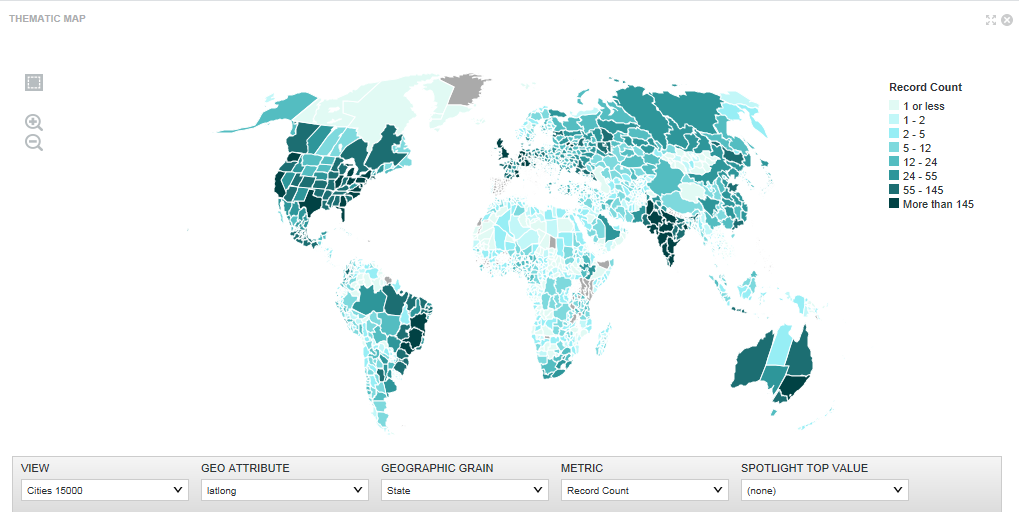
Geographic Grain list, you can select a region
name on which to aggregate records in the thematic map. For example, this
thematic map aggregates records based on State rather than Country:
Choosing a metric and metric aggregation
From the
Metric list, you can select a metric name on
which to aggregate records in the thematic map. Optionally, from the
Metric Aggregation list, you can select a method
to aggregate the value of the metric you selected in the
Metric option. For example, this thematic map
first aggregates records based on State and then sums the records for the state
based on population:

Spotlighting values on the map
The Spotlight Top Value list colors regions according to the largest value of the metric selected in the Metric option.
For example, this map shows the city in each country that has the
maximum population. The grain is set to country, and the metric and metric
aggregation instruct the component to calculate records based on maximum
population, and lastly, the
Spotlight Top Value groups the records by city.
So you can see that in China, the city of Shanghai has the largest
population:

Zooming in/out and redrawing the map
You can use Zoom In and Zoom Out features on the left edge of the component to manipulate the map.
You can multi-select regions using the Marque drawing tool or by using ctrl+click to select regions one at a time. You can also drag the thematic map to different locations on the page and then use the tools to zoom to finer views of the data.
Using custom views with a Thematic Map
ARB("dimgeography_latlong_geo_regionid") AS "dimgeography_latlong_geo_regionid",
ARB("dimgeography_latlong_geo_subregionid") AS "dimgeography_latlong_geo_subregionid",
