For a metric or dimension spotlight value summary item, you can configure different formatting based on the metric value.
On the Conditional Formatting tab for a summary item, to configure the conditional formatting:
-
Select the type of value to use to determine whether the condition
is met:
-
Click the radio button to indicate the value to use.
The options are:
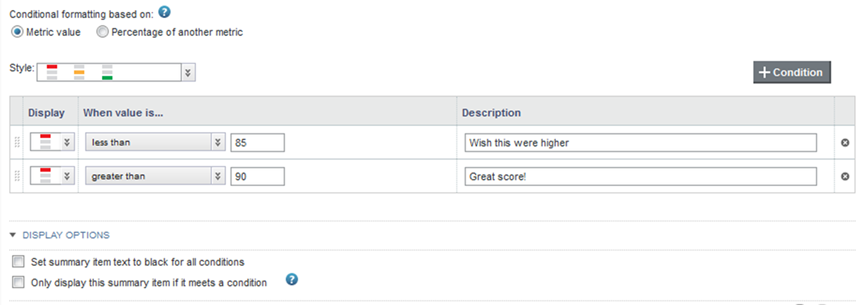
Comparison Type Description Metric value Indicates to apply the conditional formatting based on the actual summary item value. Percentage of another metric Indicates to apply the conditional formatting based on the ratio of the summary item metric value to another metric. For example, if a summary item displays total sales, then you could configure formatting based on the ratio of total sales to expected sales.
So you might configure the total sales to display in green if they are greater than or equal to 100% of the expected sales.
- For a ratio to another metric, to select the other metric, click Select Metric.
- On the Select a Metric dialog, click the metric you want to use, then click Apply.
-
Click the radio button to indicate the value to use.
-
From the
Style list, select the style to use for the
conditional formatting.
The style determines the available set of icons to display on the summary item.
- To add a condition to the list, click +Condition.
-
To configure a condition:
-
From the
Display list, select the icon to display
when the condition is met.
Note that you can have multiple rows that use the same display. For example, you may want to use the same formatting to highlight both very low and very high outlying values.
- Under When value is, select the comparison to use, then enter the appropriate values.
- In the Description column, type a description to display in the summary item tooltip when the condition is met.
-
From the
Display list, select the icon to display
when the condition is met.
- To remove a condition, click its delete icon.
-
In the
Display Options section:
- By default, the text color on the summary item matches the icon color, if color is used. To always display the summary item value in black, check the Set summary item text to black for all conditions check box.
-
To only display the summary item if the value meets one of the
conditions, check the
Only display this summary item if it meets a
condition check box.
For example, if you create a condition for total sales for when the value is less than 1,000,000, then if this check box is selected, the summary item does not display at all when total sales are greater than or equal to 1,000,000.
