| Oracle® Retail Advanced Inventory Planning Store and Warehouse Replenishment Planning User Guide for the RPAS Fusion Client Release 14.1.2 |
|

 Previous |
 Next |
| Oracle® Retail Advanced Inventory Planning Store and Warehouse Replenishment Planning User Guide for the RPAS Fusion Client Release 14.1.2 |
|
Previous |
Next |
This chapter describes the Analyzing activity. Both Store Replenishment Planning (SRP) and Warehouse Replenishment Planning (WRP) interactive workbooks are used to produce reports for stores and warehouses. These interactive workbooks allow you to analyze system output and perform What-if style analysis when replenishment parameters are changed.
The Analyzing activity contains these tasks:
This task allows you to view and maintain the store replenishment plan.
Use the Store Replenishment Plan (SRP) Interactive Evaluation workbook to perform the step for this task. To build this workbook, see "SRP Interactive Evaluation Workbook".
These steps helps you achieve this task:
This step contains views that allow you to examine the store replenishment plan exceptions and overstocks. The available views are:
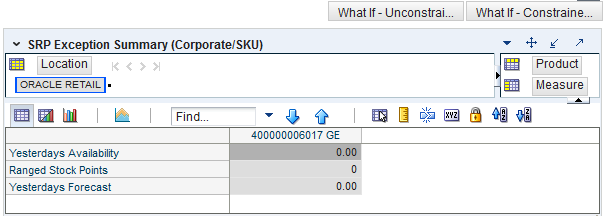
This view allows you to examine alert summary data at the (Corporate/SKU) level.
Table 7-1 lists the measures in this view.
Table 7-1 Measures: SRP Exception Summary (Corporate/SKU) Interactive View
| Measure Label | Description |
|---|---|
|
Ranged Stock Points |
Ranged Stock Points contains the total number of stores across company available to receive and sell items from the previous night's batch run. |
|
Yesterdays Availability |
Yesterdays Availability is the percentage of stores across company for which this product was available to sell. In other words the percentage of stores that did not have stock outs the previous night. It is calculated as 1 minus the ratio of stores out of stock last night to the total number of stores available to sell the product. |
|
Yesterdays Forecast |
Yesterdays Forecast contains the sum of the forecasted demand for this product for the previous night across all stores (company level). |
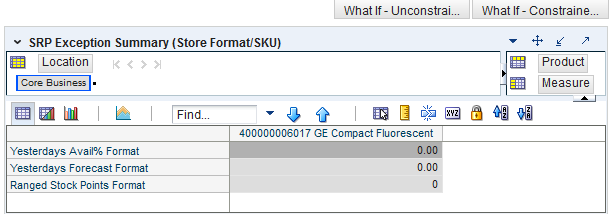
This view allows you to review alert summary data at the Store Format/SKU level.
Table 7-2 lists the measures in this view.
Table 7-2 Measures: SRP Exception Summary (Store Format/SKU)
| Measure Label | Description |
|---|---|
|
Ranged Stock Points Format |
Ranged Stock Points contains the total number of stores with this format available to receive and sell items from the previous night's batch run. |
|
Yesterdays Availability Format |
Yesterdays Availability is the percentage of stores with this format for which this product was available to sell. In other words the percentage of stores that did not have stock outs the previous night. It is calculated as 1 minus the ratio of stores out of stock last night to the total number of stores in this region available to sell the product. |
|
Yesterdays Forecast Format |
Yesterdays Forecast contains the sum of the forecasted demand for this product for the previous night across all stores with this format. |
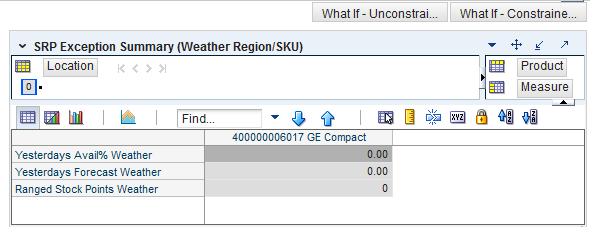
This view allows you to review alert summary data at the Weather Region/SKU level.
Table 7-3 lists the measures in this view.
Table 7-3 Measures: SRP Exception Summary (Weather Region/SKU) Interactive View
| Measure Label | Description |
|---|---|
|
Ranged Stock Points Weather |
Ranged Stock Points contains the total number of stores across Weather Region available to receive and sell items from the previous night's batch run. |
|
Yesterdays Availability Weather |
Yesterdays Availability is the percentage of stores across Weather Region for which this product was available to sell. In other words the percentage of stores that did not have stock outs the previous night. It is calculated as 1 minus the ratio of stores out of stock last night to the total number of stores in this region available to sell the product. |
|
Yesterdays Forecast Weather |
Yesterdays Forecast contains the sum of the forecasted demand for this product for the previous night across all stores in this region. |
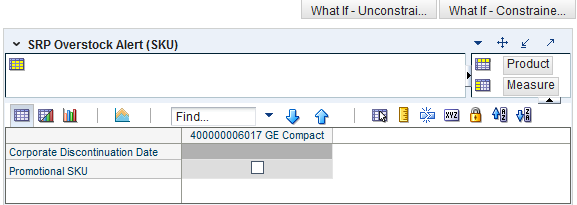
This view allows you to review pertinent information regarding the SKU's status.
Table 7-4 lists the measures in this view.
Table 7-4 Measures: SRP Overstock Alert (SKU) Interactive View
| Measure Label | Description |
|---|---|
|
Corporate Discontinuation Date |
The Corporate Discontinuation Date measure indicates the date measure by when the SKU Pack-size is planned for discontinuation at the corporate level. |
|
Promotional SKU |
The Promotional SKU measure denotes whether a SKU is promotional. |
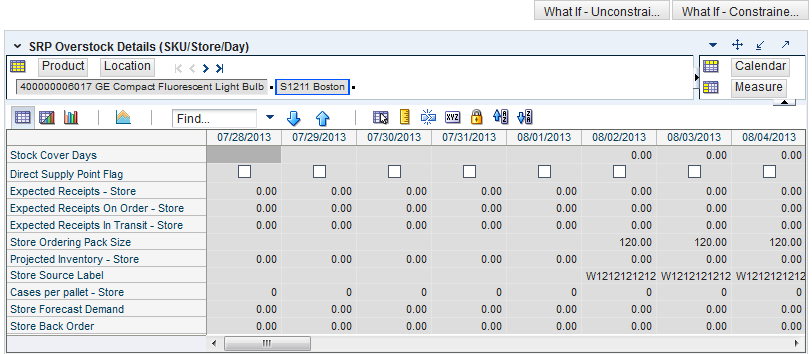
This view displays detailed overstock information at the SKU/Store/Day level.
Table 7-5 lists the measures in this view.
Table 7-5 Measures: SRP Overstock Details (SKU/Store/Day) Interactive View
| Measure Label | Description |
|---|---|
|
Cases Per Pallet - Store |
The Cases Per Pallet - Store measure indicates the pallet multiple for the source warehouse. |
|
Direct Supply Point Flag |
The Direct Supply Point Flag indicates whether the supply point is being sourced directly from a supplier. |
|
Store Back Orders |
Store Back Orders shows the SKU/store back order quantity placed on Today. Back Order should be subtracted from the current day's Projected Inventory before Projected Inventory is involved in further calculation. (Read only) |
|
Stock Cover Days |
Stock Cover Days is calculated as the number of days the store's current inventory covers demand. |
|
Store Forecast Demand |
The Store Forecast Demand is the forecast of the store's future sales. Note: Demand Forecast is loaded from an external forecasting system. |
|
Expected Receipts - Store |
Expected Receipts - Store (ER) are orders that have already been executed and therefore need to be considered when planning future orders for a store. Expected Receipts - Store is the sum of in-transits and on orders. Note: In-transits and on orders s are loaded to SRP from an external system. |
|
Expected Receipts In Transit - Store |
Expected Receipts In Transit - Store represents Inventory in transit from warehouses and suppliers to store. Note: This measure is loaded from an external system. |
|
Expected Receipts On Order - Store |
Expected Receipts On Order - Store are fixed orders currently being processed for delivery to store either from warehouses or directly from suppliers Note: This measure is loaded from an external system. |
|
Store Ordering Pack-size |
The Store Ordering Pack-size represents the primary pack-size to be used when ordering a SKU for a store (either from a warehouse or from a supplier). Note: Store Ordering Pack-size is loaded from Data Management (DM). |
|
Projected Inventory - Store |
Projected Inventory - Store (PI) is calculated in AIP batch and represents a projection of the opening inventory position for any day in the planning horizon at a specific store. None of that day's activities (either receipts or demand) are reflected in PI, and so it is often referred to as a beginning of day position. PI on a given day is calculated as the PI of the previous day plus the net impact of all demand and replenishments on the previous day. Previous day demand is consists of forecasted demand plus any Customer Orders (CO) on that day. Previous day replenishments consist of Expected and Planned Receipts. |
|
Store Source Label |
The Store Source Label identifies the source from which this store receives inventory. |
This step contains views that allow you to examine the store replenishment plansales, orders, and inventory. The available views are:
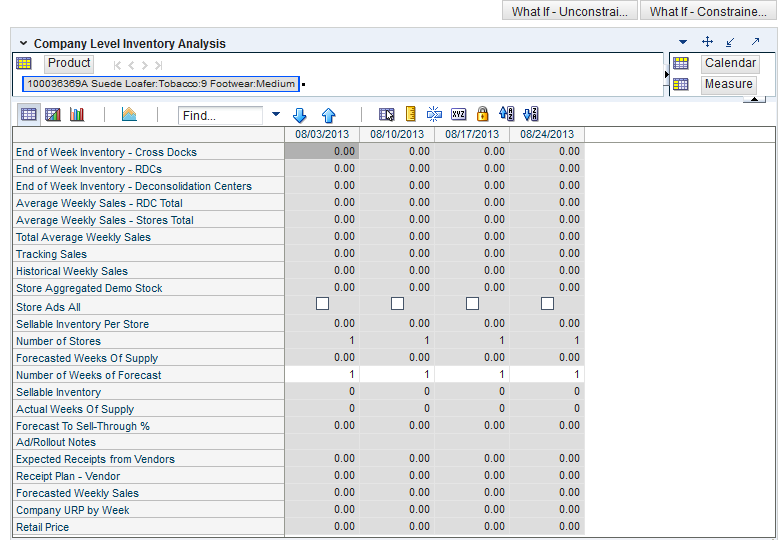
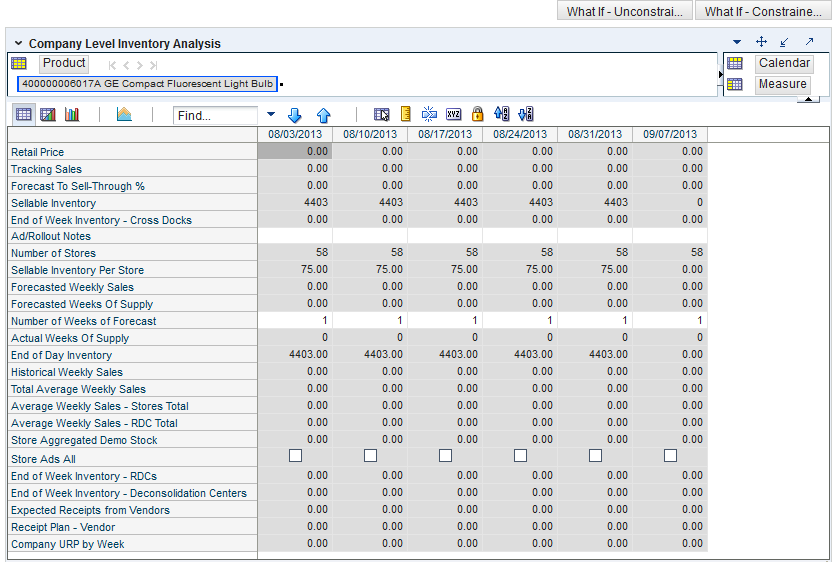
This view provides a company-wide view of inventory levels in the supply chain.
Table 7-6 lists the measures in this view.
Table 7-6 Measures: Company Level Inventory Analysis
| Measure Label | Description |
|---|---|
|
Actual Weekly Sales |
Actual Weekly Sales represents the sum of actual sales data from stores aggregated to the SKU Group/Week level. |
|
Actual Weeks of Supply |
Actual Total Weeks of Supply represents weeks of supply for all locations (stores and warehouses). It is calculated by dividing Saleable Inventory by Total Avg Weekly Sales. |
|
Ad/Rollout Notes |
SKU Ad/Rollout Notes contains notes related to a product ad or rollout. |
|
Aggregated Store Ads |
Aggregated Store Ads indicates the presence of any active ads within the SKU Group/Week level. Aggregated Store Ads is True if at least one ad exists over the week for this SKU Group. |
|
Store Aggregated Demo Stock |
Store Aggregated Demo Stock represents the total demo stock over the week for this SKU Group. It is calculated as the sum of demo stock across all stores on the last day of the week (Saturday). |
|
Company URP by Week |
Company URP by Week is the Unconstrained Receipt Plan (URP) for a given SKU Group across the company for a given week. Unconstrained Receipt Plan (URP) is calculated as Store Receipt Plan (SKU/Store/Day) plus the Store Reconciliation Adjustment (SKU/Store/Day). The resulting URP values for each SKU/Store combination are then aggregated to a SKU Group/Company/Week level. |
|
End of Week Inventory - Cross Docks |
End of Week Inventory - Cross Docks represents the sum a SKU's Projected Inventory on the last day of the week at all warehouses with a warehouse type of Cross Docks. |
|
End of Week Inventory - Deconsolidation Centers |
End of Week Inventory - Deconsolidation Centers represents the sum of a SKU's Projected Inventory on the last day of the week at all warehouses with a warehouse type of Deconsolidation Center. |
|
End of Week Inventory - RDCs |
End of Week Inventory - RDCs represents the sum a SKU's Projected Inventory on the last day of the week at all warehouses with a warehouse type of RDC. |
|
Expected Receipts from Vendors |
Expected Receipts from Vendors shows the total inventory on order from vendors to warehouses and stores for any direct to store shipments. |
|
Receipt Plan - Vendor |
Receipt Plan - Vendor shows the total planned receipts from vendors to warehouses and stores for any direct to store shipments. |
|
Forecast to Sell-Through % |
Forecast to Sell-Through % contains the percentage of actual sales (historical weekly sales) to forecasted sales (forecasted demand at the week level). |
|
Forecasted Weekly Sales |
Forecasted Weekly Sales represents the total forecasted weekly sales (including customer orders) for a given SKU Group. |
|
Forecasted Weeks of Supply |
Forecasted Weeks of Supply represents the forecasted weeks of cover. It is calculated by dividing Saleable Inventory by Forecasted Avg Weekly Sales, where Forecasted Avg Weekly Sales is calculated as Forecasted Weekly Sales divided by the Number of Weeks Forecast. |
|
Sellable Inventory per Store |
Sellable Inventory per Store represents the average inventory level per store, excluding demo stock. It is calculated as the Saleable Inventory divided by the number of stores. |
|
Number of Stores |
Number of Stores represents the total number of stores for this SKU Group. |
|
Number of Weeks Forecast |
Number of Weeks Forecast represents the number of weeks in the future (including present week) over which Forecasted Avg Weekly Sales is calculated. |
|
Retail Price |
Retail Price is the product's retail price. Note: Retail Price is loaded from an external system. |
|
Saleable Inventory |
Saleable Inventory represents the amount of inventory that can actually be sold. It is calculated as the aggregated end of week projected inventory minus the aggregated end of week demo stock. |
|
Average Weekly Sales - RDC Total |
Average Weekly Sales - RDC Total contains the aggregated total of average weekly sales for an Regional Distribution Center (RDC) warehouse. |
|
Average Weekly Sales - Stores Total |
Average Weekly Sales - Stores Total contains the aggregation of an item's average weekly sales across all stores. |
|
Total Avg Weekly Sales |
Total Avg Weekly Sales contains the Sum of SKU of RDC Avg Weekly Sales and SKU Sum of Stores Avg Weekly Sales. |
|
Tracking Sales |
Tracking Sales estimates sales for the current week based on week-to-date sales. First, average daily sales is calculated by dividing the week-to-date sales by the number of days week-to-date (Sunday through the day prior to the current day). Next, the average daily sales are multiplied by seven, resulting in the SKU Tracking Sales. |
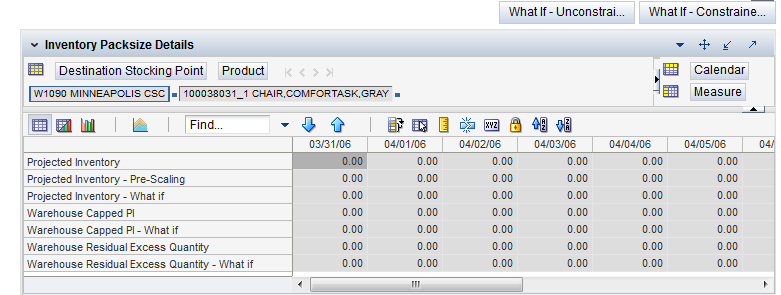
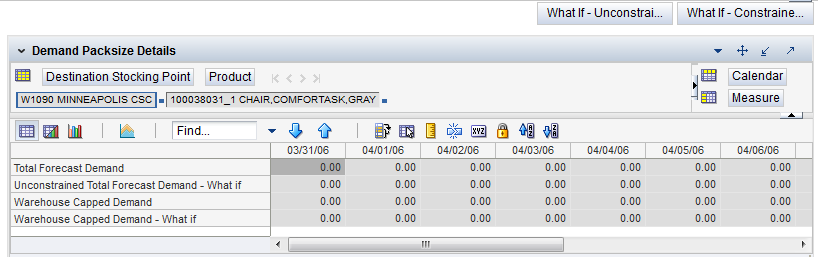
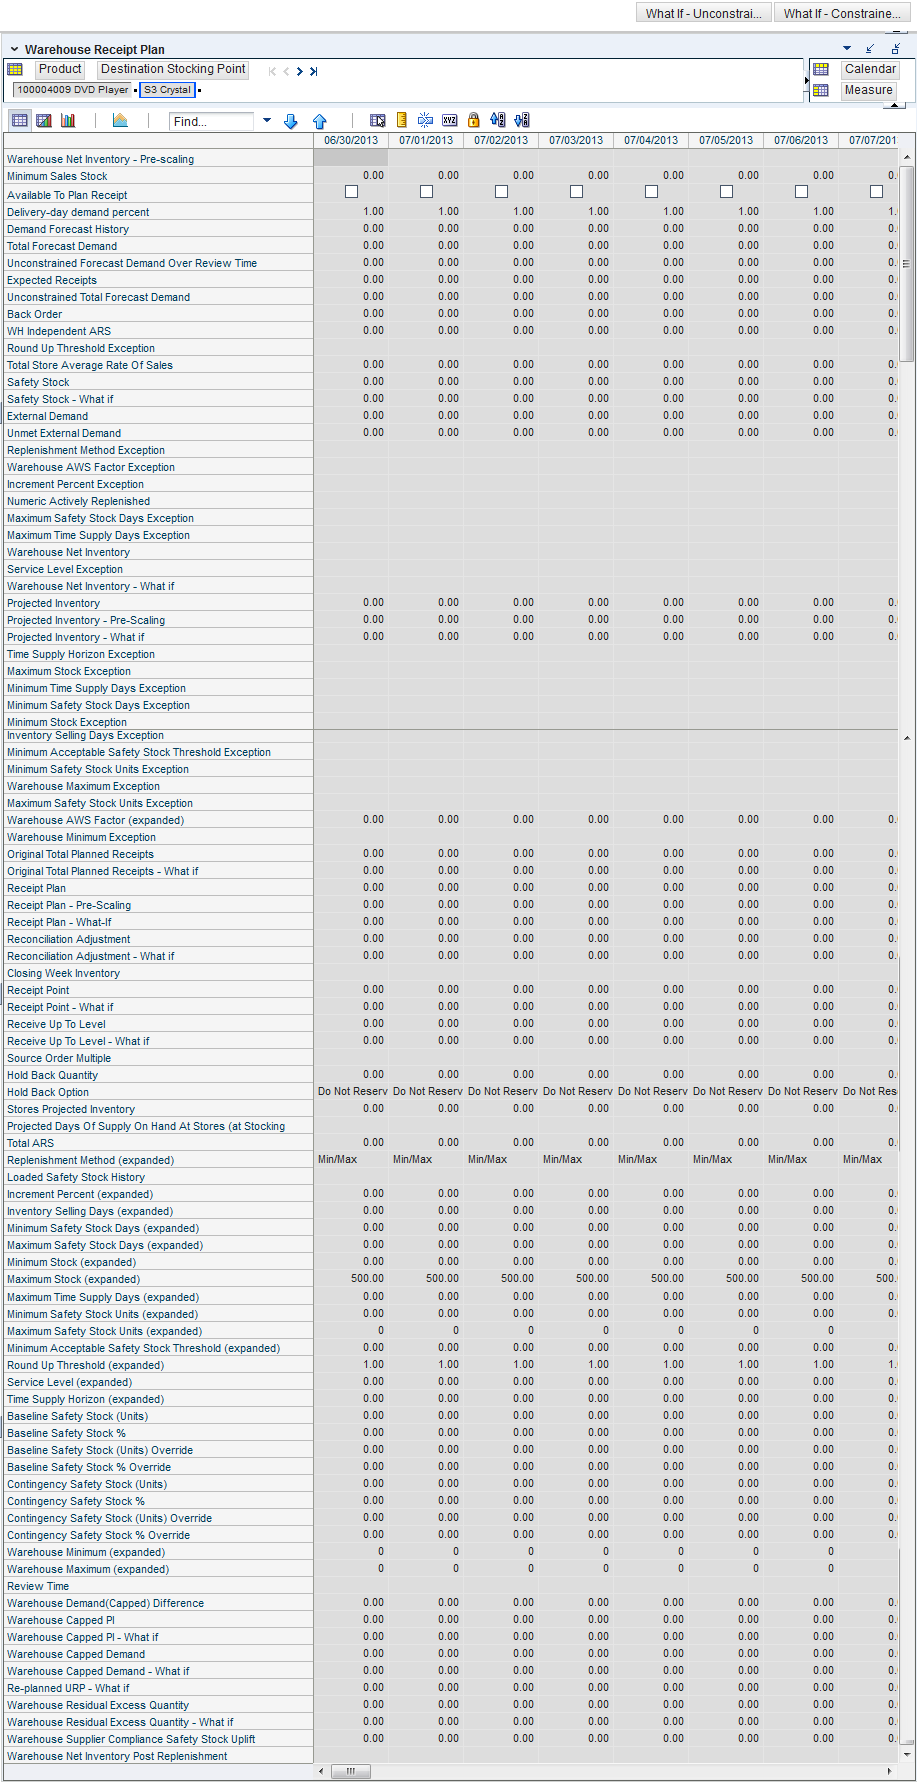
This view displays a filtered view of inventory packsizes at the SKU Pack Size/Destination/Day level.
These measures are read-only.
Table 7-7 lists the read-only measures in this view.
Table 7-7 Measures: Inventory Packsize Details
| Measure Label | Description |
|---|---|
|
Projected Inventory |
The Projected Inventory is the projected inventory calculated in the most recent AIP batch run. It includes any impacts due to scaling to Supplier Minimums and Container Minimums. This is calculated using the standard PI calculation where the Planned Receipts (PR) element represents scaled orders. |
|
Projected Inventory – Pre-Scaling |
The Projected Inventory – Pre-Scaling is the projected inventory calculated in the most recent AIP batch run prior to applying Supplier Minimums and Container Constraints. This is calculated using the standard PI calculation where the Planned Receipts (PR) element represents pre-scaling orders output from replenishment. |
|
Projected Inventory – What-if |
The Projected Inventory – What-if displays the Pre-scaling Projected Inventory calculated in the most recent AIP Batch run. If any changes are made to WRP parameters and you select What-if – Unconstrained or What-if – Constrained from the What-ifoption on the menu bar, this measure is updated with the newly calculated PI for the SKU/Warehouse. |
|
Warehouse Capped PI |
The Warehouse Capped PI is calculated using the standard PI equation: PIt = Max (PIt-1 + ERt-1 – Dmdt-1 + PRt-1 – ESt-1 – COt-1, 0) Where Dmdt = Capped Demand (demand based on CRPs into the destinations) for any day t PRt = Planned Receipts (Receipt Plan) at the warehouse for any day t Both Dmdt and PRt represent aggregate values at the SKUGroup level for all SKUPacks belonging to that SKU Group. |
|
Warehouse Capped PI – What-if |
The Warehouse Capped PI – What-if is the What-if version of Warehouse Capped PI. |
|
Warehouse Residual Excess Quantity |
The Warehouse Residual Excess Quantity is equal to any excess stock that was left at the end of day for which there were no locations available to receive excess stock (either because of inventory capping or no ATP days or for any other reason). After stockless processing for the day, this quantity can be calculated as follows: ResidualQty(t) = Max(PI(t) + ER(t) + CRP(t) – Dmd(t), 0) (essentially the PI calculation for day t+1) |
|
Warehouse Residual Excess Quantity – What-if |
The Warehouse Residual Excess Quantity – What-if is the What-if version of Warehouse Residual Excess Quantity. |
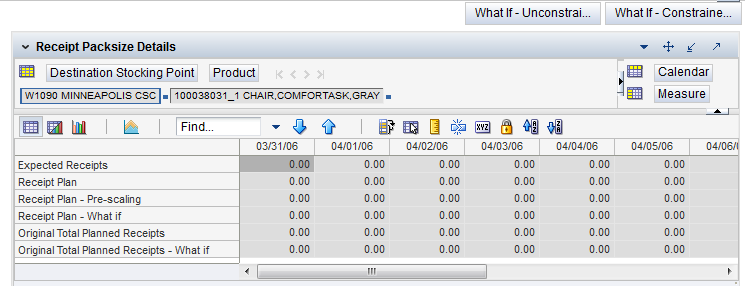
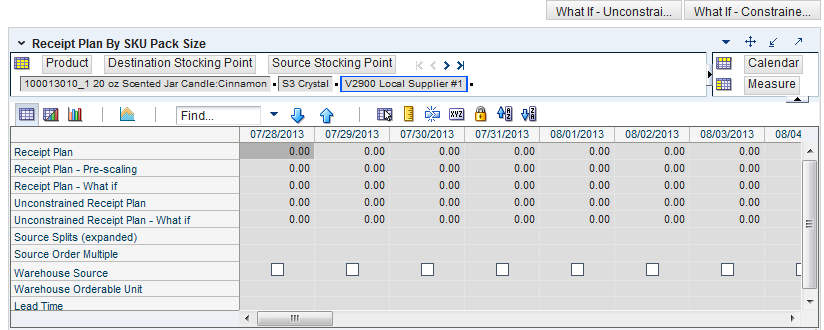
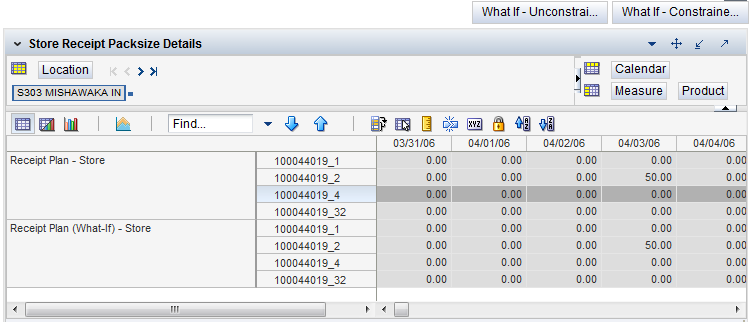
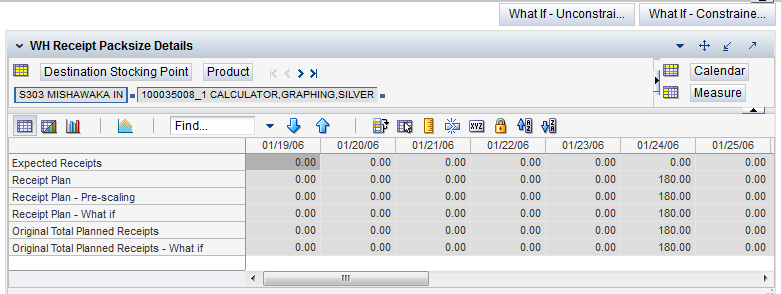
This view displays a filtered view of receipt packsizes at the SKU Pack Size/Destination/Day level.
These measures are read-only.
Table 7-8 lists the read-only measures in this view.
Table 7-8 Measures: Receipt Packsize Details
| Measure Label | Description |
|---|---|
|
Expected Receipts |
Expected Receipts uses historical expected receipts if prior to today; otherwise, the value represents on orders + in transits + placement. Value will change based on user input for Warehouse Stop Receiving Date in the workbook. |
|
Receipt Plan |
Receipt Plan represents the Final Constrained Receipt Plan calculated in the most recent batch run. The receipts include any impacts due to scaling to Supplier Minimums and Container Minimums. |
|
Receipt Plan – Pre-Scaling |
Receipt Plan – Pre-Scaling contains the Constrained Receipt Plan, calculated in the most recent batch run, prior to applying Supplier Minimums and Container Constraints. |
|
Receipt Plan – What-if |
Receipt Plan – What-if initially displays the Pre-scaling Constrained Receipt Plan calculated in the most recent AIP Batch run. If any changes are made to WRP parameters and you select What-if – Unconstrained or What-if – Constrained from the What-if option on the menu bar, this measure will be updated with the newly calculated CRP for the SKU/Warehouse. |
|
Original Total Planned Receipts |
Original Total Planned Receipts represents the original un-reconciled total planned receipts calculated in the most recent batch run. |
|
Original Total Planned Receipts – What-if |
Original Total Planned Receipts – What-if initially displays the un-reconciled total planned receipts calculated in the most recent AIP Batch run. If any changes are made to WRP parameters and you select What-if – Unconstrained or What-if – Constrained from the What-if option on the menu bar, this measure will be updated with the newly calculated URP for the SKU/Warehouse. |
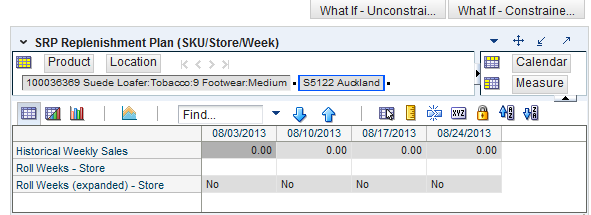
This view allows you to review replenishment plan information at the (SKU/Store/Week) level.
Table 7-9 lists the measures in this view.
Table 7-9 Measures: SRP Replenishment Plan (SKU/Store/Week) Interactive View
| Measure Label | Description |
|---|---|
|
Actual Weekly Sales |
Actual Weekly Sales is used in Sales Week Range and Factor AWS replenishment methods. It represents the actual historical sales by week for a SKU/Store. As a default, SRP maintains the last 52 weeks of history (purge age is set to 371 days). This ensures that the oldest week of history is automatically dropped as each new week of sales history is added. Note: Actual Weekly Sales is loaded to SRP from an external system. |
|
Roll Weeks (expanded) - Store |
The Roll Weeks parameter indicates whether SRP logic should automatically roll the start and end date range settings forward one week or not. Roll weeks is used in the Factor AWS and Sales Week Range Replenishment Methods. The Roll Weeks options are:
Example: Yes causes the start and end date to roll forward one week, allowing you to keep the weekly historical sales at the same relative distance in the past. No does not move the start and end date forward allowing you to use the same weekly historical sales as the system moves forward in time. Roll Weeks (expanded) - Store displays the actual value used in the calculations. This is the merge of exception level (SKU/Store/Day), default level (Sub-class/Store format), and global level (Dept) values entered. |
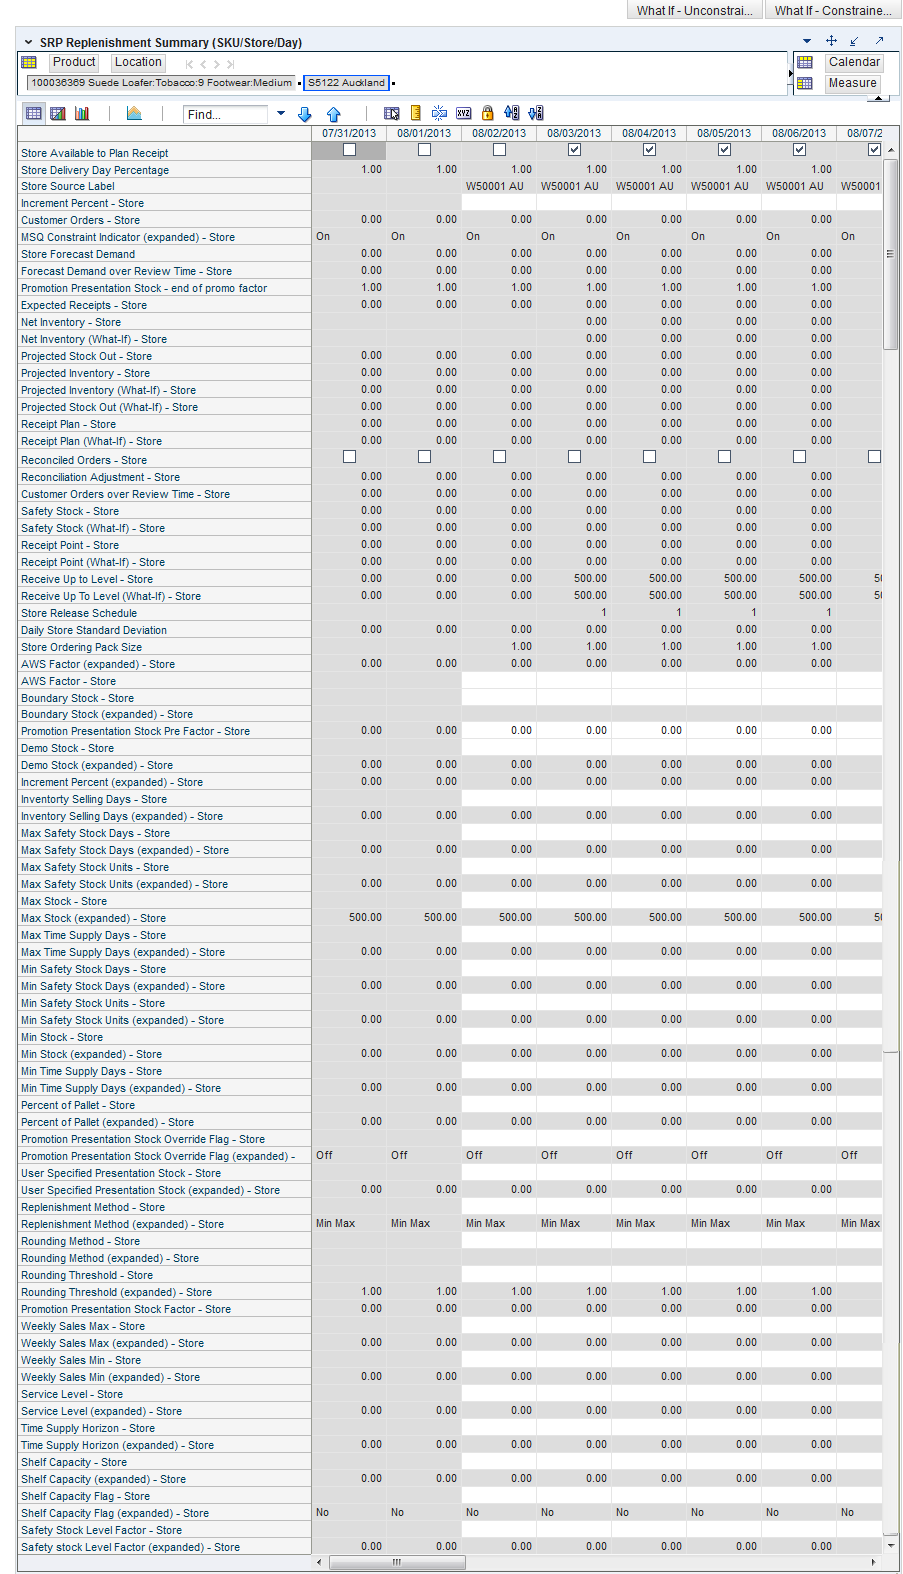
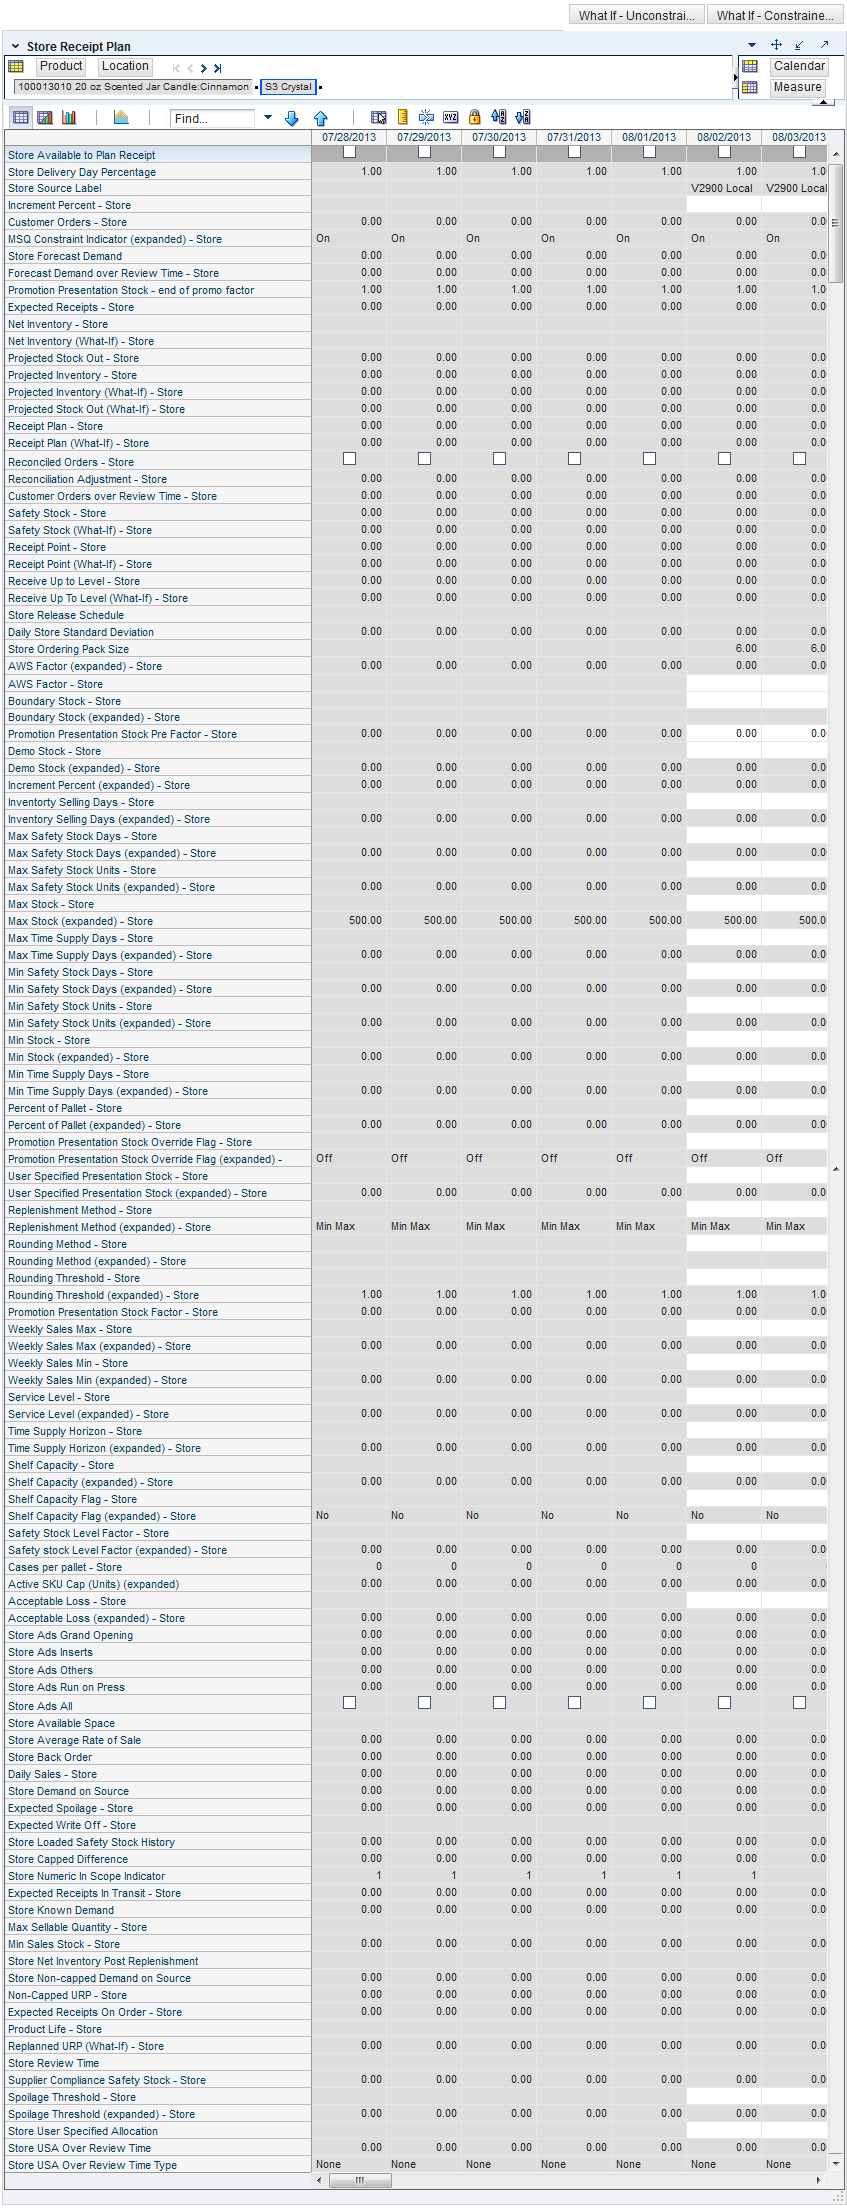
This view provides a company-wide view of inventory levels in the supply chain. This view includes both:
Read-only Measures
Table 7-10 lists the measures in this view that appear automatically when using the default template. All measures are read-only.
Table 7-10 Measures: SRP Replenishment Summary (SKU/Store/Day) Interactive View
| Measure Label | Description |
|---|---|
|
Promotion Presentation Stock Pre Factor - Store |
The Promotion Presentation Stock Pre Factor - Store represents the specified quantity for Store Promotion Presentation Stock before application of the Promotion Presentation Stock - End of Promo Factor. |
|
Daily Store Standard Deviation |
The Daily Store Standard Deviation represents the forecast error assuming a normal distribution. The standard deviation is used in the calculation of dynamic Safety Stock. Note: This measure is loaded from an external system. |
|
Promotion Presentation Stock - end of promo factor (expanded) |
Promotion Presentation Stock - End of Promo Factor (expanded) displays the actual value used in the calculations. This version displays a factor of 1 for the days within the promotion period prior to the ramp down and then shows the designated End of Promotion Factor values as it approaches the end of the promotion. A factor of 1 is displayed after the promotion has ended. |
|
Projected Stock Out - Store |
Projected Stock Out - Store is calculated based on forecasted demand and projected inventory. It represents the projected lost sales as a result of an out of stock at the store. |
|
Store Available To Plan Receipt |
The Store Available to Plan Receipt (ATP) indicates the days on which a store may plan a receipt based on the store's release schedule. A checkmark in a box indicates a receipt may be planned on that day. |
|
Delivery-day Demand Percent (expanded) |
The actual value used in calculations. This is a merge of the multiple levels of Delivery-day Demand Percent. |
|
AWS Factor - Store) |
The AWS Factor allows you to provide a numeric factor to be multiplied against the Average Weekly Sales (AWS) to determine replenishment boundaries (Safety Stock, RP and RUTL) for the Factor AWS replenishment method. Example: An AWS Factor of 0.5 calculates a Safety Stock that is 50% of the average weekly sales. AWS Factor - Store displays the actual value used in the calculations. This is the merge of exception level (SKU/Store/Day), default level (Sub-class/Store format), and global level (Dept) values entered. |
|
Boundary Stock (expanded) - Store |
The Boundary Stock identifier allows you to select the stock level to use in calculating the Store RP and Store RUTL. This stock level is a combination of Safety Stock, Presentation Stock or Promotional Presentation Stock based on the following identifiers. If the identifier contains vs., the greater value is used. This parameter affects all replenishment methods. The boundary options are:
Where, SS = Safety Stock PS = Presentation Stock PPS = Promotional Presentation Stock The default is SS vs. PS + PPS. Example: SS vs. PS adds the greater of SS or PS to the calculated Store RP and Store RUTL values. SS + PS adds the total of SS and PS to the calculated Store RP and Store RUTL values. Boundary Stock (expanded) - Store displays the actual value used in the calculations. This is the merge of exception level (SKU/Store/Day), default level (Sub-class/Store format), and global level (Dept) values entered. |
|
Customer Orders - Store |
Customer Orders - Store (CO) are orders placed by customers at a store for a specific quantity of a SKU to be picked up on a specific delivery date. Customer orders are treated as additional demand on top of normal forecasted demand. Note: Customer Orders are loaded to SRP from an external system. |
|
Customer Orders over Review Time - Store |
Customer Orders over Review Time - Store represents the customer orders that must be accounted for when calculating the Ideal Receipt Quantity on an ATP day. Customer orders are summed from the day after the beginning of the review period through the day before the end of the review period. Customer Orders over Review Time - Store is only calculated on Available to Plan receipt days. |
|
Store Forecast Demand |
The Store Forecast Demand is the forecast of the store's future sales. Note: Demand Forecast is loaded from an external forecasting system. |
|
Demo Stock (expanded) - Store |
Amount of stock that is used as demonstration product, but is still available to sell. Demo Stock is added to the RP and RUTL levels for each day. Demo Stock (expanded) - Store displays the actual value used in the calculations. This is the merge of exception level (SKU/Store/Day), default level (Sub-class/Store format), and global level (Dept) values entered. |
|
Expected Receipts - Store |
Expected Receipts - Store (ER) are orders that have already been executed and therefore need to be considered when planning future orders for a store. Expected Receipts - Store is the sum of in-transits and on orders. Note: In-transits and on orders s are loaded to SRP from an external system. |
|
Forecast Demand over Review Time - Store |
Forecast Demand over Review Time - Store is calculated as the sum of the forecasted demand from the current day through the next receipt day. Forecast Demand over Review Time - Store is only calculated on Available to Plan receipt days. |
|
Increment Percent (expanded) - Store |
The Increment Percent acts as a multiplier for minimum and maximum stock that is designed to handle temporary fluctuation in demand for items using the Min/Max Replenishment Method. An increment percentage factor can be used to temporarily increase or decrease targeted stocking levels without altering the established MIN and MAX values. Example: An Increment Percent of 1.2 adds 20% to the Min and Max Stock. Increment Percent (expanded) - Store displays the actual value used in the calculations. This is the merge of exception level (SKU/Store/Day), default level (Sub-class/Store format), and global level (Dept) values entered. |
|
Inventory Selling Days (expanded) - Store |
The Inventory Selling Days parameter is used to specify the number of days of forecast quantity to be used when calculating the RUTL with the Hybrid, Dynamic, Poisson and Loaded SS Dynamic Replenishment Methods. The RUTL calculation uses the forecast demand over the greater of Inventory Selling Days and Review Time. Inventory Selling Days can be used to avoid producing very small frequent orders. Example: Inventory Selling Days of 14 ensures that an order contains at least 14 days of supply. Inventory Selling Days (expanded) - Store displays the actual value used in the calculations. This is the merge of exception level (SKU/Store/Day), default level (Sub-class/Store format), and global level (Dept) values entered. |
|
Max Safety Stock Days (expanded) - Store |
The Max Safety Stock Days parameter is used to specify the maximum number of days of cover to be kept on hand as Safety Stock. If you enter both Max Safety Stock Days and Max Safety Stock Units, the Maximum Safety Stock boundary uses the larger of demand over Max Safety Stock Days and Max Safety Stock Units. Example: Max Safety Stock Days of 14 ensures the Maximum Safety Stock contains at least 14 days of supply. If Max Safety Stock Units is greater than 14 days of supply, max units would be used as the Maximum Safety Stock, otherwise Maximum Safety Stock would be the number of units required to cover 14 days of demand, calculated as the sum of demand over the next 14 days beginning with the current day. Max Safety Stock Days (expanded) - Store displays the actual value used in the calculations. This is the merge of exception level (SKU/Store/Day), default level (Sub-class/Store format), and global level (Dept) values entered. |
|
Max Safety Stock Units (expanded) - Store |
The Max Safety Stock Units parameter is used to specify the maximum amount of inventory to be kept on hand as Safety Stock. If you enter both Max Safety Stock Days and Max Safety Stock Units, the Maximum Safety Stock boundary uses the larger of demand over Max Safety Stock Days and Max Safety Stock Units. Example: Max Safety Stock Days of 14 ensures the Maximum Safety Stock contains at least 14 days of supply. If Max Safety Stock Units is greater than 14 days of supply, max units would be used as the Maximum Safety Stock, otherwise Maximum Safety Stock would be the number of units required to cover 14 days of demand. Max Safety Stock Units (expanded) - Store displays the actual value used in the calculations. This is the merge of exception level (SKU/Store/Day), default level (Sub-class/Store format), and global level (Dept) values entered. |
|
Max Stock (expanded) - Store |
Max Stock is only used in the Min/Max Replenishment Method. It represents the maximum stock level in units that are desired on hand to satisfy demand. The receipt plan quantity is calculated to bring Net Inventory up to MAX Stock. Max Stock (expanded) - Store displays the actual value used in the calculations. This is the merge of exception level (SKU/Store/Day), default level (Sub-class/Store format), and global level (Dept) values entered. |
|
Max Time Supply Days (expanded) - Store |
Max Time Supply Days is only used in the Time Supply Replenishment Method. It represents maximum stock level in terms of number of days cover that are desired on hand to satisfy demand. The receipt plan quantity is calculated to bring Net Inventory up to Maximum Time Supply Days of cover. Example: Max Time Supply Days of 14 ensures an order brings the inventory level up to 14 days of supply. Max Time Supply Days (expanded) - Store displays the actual value used in the calculations. This is the merge of exception level (SKU/Store/Day), default level (Sub-class/Store format), and global level (Dept) values entered. |
|
Min Safety Stock Days (expanded) - Store |
The Min Safety Stock Days parameter is used to specify the minimum number of days of cover to be kept on hand as Safety Stock. If you enter both Min Safety Stock Days and Min Safety Stock Units, the Minimum Safety Stock boundary uses the larger of demand over Min Safety Stock Days and Min Safety Stock Units. Example: Min Safety Stock Days of 7 ensures the Minimum Safety Stock contains at least seven days of supply. If Min Safety Stock Units is greater than seven days of supply, min units would be used as the Minimum Safety Stock, otherwise Minimum Safety Stock would be the number of units required to cover seven days of demand, calculated as the sum of demand over the next seven days beginning with the current day. Min Safety Stock Days (expanded) - Store displays the actual value used in the calculations. This is the merge of exception level (SKU/Store/Day), default level (Sub-class/Store format), and global level (Dept) values entered. |
|
Min Safety Stock Units (expanded) - Store |
The Min Safety Stock Units parameter is used to specify the minimum amount of inventory to be kept on hand as Safety Stock. If you enter both Min Safety Stock Days and Min Safety Stock Units, the Minimum Safety Stock boundary uses the larger of demand over Min Safety Stock Days and Min Safety Stock Units. Example: Min Safety Stock Days of 7 ensures the Minimum Safety Stock contains at least seven days of supply. If Min Safety Stock Units is greater than seven days of supply, min units would be used as the Minimum Safety Stock, otherwise Minimum Safety Stock would be the number of units required to cover seven days of demand. Min Safety Stock Units (expanded) - Store displays the actual value used in the calculations. This is the merge of exception level (SKU/Store/Day), default level (Sub-class/Store format), and global level (Dept) values entered. |
|
Min Stock (expanded) - Store |
Min Stock is only used in the Min/Max Replenishment Method. It represents the minimum stock level in units that are desired on hand to satisfy demand. Min Stock is used in determining the inventory level at which a replenishment is triggered. Min Stock (expanded) - Store displays the actual value used in the calculations. This is the merge of exception level (SKU/Store/Day), default level (Sub-class/Store format), and global level (Dept) values entered. |
|
Min Time Supply Days (expanded) - Store |
Min Time Supply Days is only used in the Time Supply and Hybrid Replenishment Method. It represents minimum stock level in terms of number of days cover that are desired on hand to satisfy demand. Min Time Supply Days of cover is used in both Safety Stock and RP calculations. Example: To ensure a minimum inventory level that covers seven days of supply; then in the Min Time Supply Days, enter: 7. Min Time Supply Days (expanded) - Store displays the actual value used in the calculations. This is the merge of exception level (SKU/Store/Day), default level (Sub-class/Store format), and global level (Dept) values entered. |
|
MSQ Constraint Indicator (expanded) - Store |
MSQ Constraint Indicator (expanded) - Store displays the actual value used in calculations. This represents the merge of the global default, default, and exception level versions of Store MSQ Constraint Indicator. If the indicator is On, MSQ is applied as a constraint during ordering decisions. |
|
Net Inventory - Store |
Net Inventory - Store (NI) is calculated in batch AIP and is a prediction of the inventory position at the end of review time. It represents what inventory is available to meet demand over the period. The NI calculation is based on the Projected Inventory position at the beginning of the period, then considering the impact of Expected Receipts (ER) and Expected Spoilage (ES) over the review time. Net Inventory - Store is only calculated on Available to Plan receipt days, and is used as the point at which SRP generates a planned receipt. Important: While it is possible to rollup Net Inventory across the time dimension, it is not recommended. Aggregation over time does not produce a meaningful result since the calculation of Net Inventory involves the summation of data over review times which do not correlate with positions in the calendar hierarchy. |
|
Store Net Inventory Post Replenishment |
Store Net Inventory Post Replenishment is the inventory over the review time factoring in a planned receipt. This is Store Net Inventory plus the planned receipt on that day. |
|
Store Ordering Pack-size |
The Store Ordering Pack-size represents the primary pack-size to be used when ordering a SKU for a store (either from a warehouse or from a supplier). Note: Store Ordering Pack-size is loaded from Data Management (DM). |
|
Percent of Pallet (expanded) - Store |
Percent of Pallet is used to determine if the Ideal Receipt Quantity for replenishment should be rounded to a full pallet. It represents the percentage threshold that case demand must exceed in order for pallet rounding to occur. Example: Percent of Pallet of 0.75 rounds an order up to a pallet if the case demand is greater than 75 percent of a pallet. Percent of Pallet (expanded) - Store displays the actual value used in the calculations. This is the merge of exception level (SKU/Store/Day), default level (Sub-class/Store format), and global level (Dept) values entered. |
|
Projected Inventory - Store |
Projected Inventory - Store (PI) is calculated in AIP batch and represents a projection of the opening inventory position for any day in the planning horizon at a specific store. None of that day's activities (either receipts or demand) are reflected in PI, and so it is often referred to as a beginning of day position. PI on a given day is calculated as the PI of the previous day plus the net impact of all demand and replenishments on the previous day. Previous day demand is consists of forecasted demand plus any Customer Orders (CO) on that day. Previous day replenishments consist of Expected and Planned Receipts. |
|
Promotion Presentation Stock - Store |
ThePromotion Presentation Stock - Store represents the Promotion Presentation Stock - End of Promo Factor applied to the Promotion Presentation Stock Pre Factor - Store. If the Promotion Presentation Stock Override Flag (expanded) - Store is turned on, this becomes equal to zero (0). |
|
Promotion Presentation Stock Override Flag (expanded) - Store |
Promotion Presentation Stock Override Flag (expanded) - Store displays the actual value used in the calculations. This is the merge of exception level (SKU/Store/Day), default level (Sub-class/Store format), and global level (Dept) values entered. |
|
Receipt Plan - Store |
The Receipt Plan - Store represents SRP's recommendations for ordering based on demand, allocation boundaries and available inventory. The Receipt Plan is final result calculations in AIP Batch including adjustments made to Ideal Receipt Quantity based on rounding and constraints made to the Unconstrained Receipt Plan based on inventory available at the source. This measure has a related filtered worksheet. See the Receipt Packsize Details View for more information. |
|
Receipt Plan (What-if) - Store |
The Receipt Plan (What-if) - Store is the updated value after What-if calculations have been run on the Receipt Plan - Store measure. |
|
Receipt Point - Store |
The Receipt Point - Store (RP) represents the inventory level below which an order should be triggered. RP is calculated differently based on the selected Replenishment Method. Receipt Point - Store is only calculated on Available to Plan receipt days. |
|
Receive Up to Level - Store |
The Receive Up to Level (RUTL) denotes the target level of inventory when generating an order. RUTL is calculated differently based on the selected Replenishment Method. Receive Up to Level - Store is only calculated on Available to Plan receipt days. |
|
Reconciled Orders - Store |
The Reconciled Orders - Store is an indicator informing users which indicates which orders have been reconciled. |
|
Reconciliation Adjustment - Store |
The Reconciliation Adjustment - Store represents the difference between the Unconstrained Receipt Plan and the Receipt Plan - Store due to inventory constraints, inventory availability at the source location. |
|
Store Release Schedule |
The Store Release Schedule is an integer representing the lead time from a source location to store for a SKU. The release schedule is calculated in Data Management (DM) based on lead time and order cycle. A numeric field indicating the lead times. |
|
Replenishment Method - Store |
The choice of Replenishment Method determines the calculations that are used in generating a store replenishment method. Blank indicates the system preset value of No Replenishment. The Replenishment Method options are:
The default is No Replenishment. Replenishment Method - Store displays the actual value used in the calculations. This is the merge of exception level (SKU/Store/Day), default level (Sub-class/Store format), and global level (Dept) values entered. |
|
Rounding Method (expanded) - Store |
The Rounding Method is used when pack rounding the Ideal Receipt Quantity (IRQ). The Rounding Method options are:
Rounding Method (expanded) - Store displays the actual value used in the calculations. This is the merge of exception level (SKU/Store/Day), default level (Sub-class/Store format), and global level (Dept) values entered. |
|
Rounding Threshold (expanded) - Store |
The Rounding Threshold represents the portion of a pack above which the replenishment plan is rounded up and below which it is rounded down. Example: To round up an order up to a pack when the demand is greater than 25 percent of a pack; then in the Rounding Threshold, enter: 0.25. Rounding Threshold (expanded) - Store displays the actual value used in the calculations. This is the merge of exception level (SKU/Store/Day), default level (Sub-class/Store format), and global level (Dept) values entered. |
|
Safety Stock - Store |
Safety Stock - Store (SS) is inventory held at a location to mitigate the risks of stock outs caused by variability in forecasted demand. Safety stock is calculated differently based on the selected Replenishment Method. All replenishment methods allow the Safety Stock to be bound by minimum and maximum values. Store Safety Stock is only calculated on Available to Plan receipt days. |
|
Safety Stock Level Factor (expanded) - Store |
The Safety Stock Level Factor represents the amount of additional Safety Stock to carry in anticipation of unpredictable events (for instance, weather changes) or to provide additional Safety Stock during a special promotion or event. This provides a temporary lift in the RP and RUTL values. The Safety Stock Level Factor is used in Time Supply, Hybrid, Poisson, Dynamic and Loaded SS Dynamic Replenishment Methods. Example: To increase Safety Stock by 25 units, you would enter a Safety Stock Level Factor of 25. Negative values may also be entered to decrease the Safety Stock level. Safety Stock Level Factor (expanded) - Store displays the actual value used in the calculations. This is the merge of exception level (SKU/Store/Day), default level (Sub-class/Store format), and global level (Dept) values entered. |
|
Service Level (expanded) - Store |
The Service Level is used in the Safety Stock calculations for the Dynamic and Poisson replenishment methods. It is defined as the percentage of time that the stock should be able to meet demand. Example: A Service Level of 0.90 carries enough Safety Stock to maintain a 90% customer service level. Service Level (expanded) - Store displays the actual value used in the calculations. This is the merge of exception level (SKU/Store/Day), default level (Sub-class/Store format), and global level (Dept) values entered. |
|
Shelf Capacity (expanded) - Store |
Shelf capacity is the amount of stock to fill a shelf to the desired maximum level. If the Shelf Capacity Flag (expanded) - Store is set to Yes, the shelf capacity is used to cap the RP and RUTL. Shelf Capacity (expanded) - Store displays the actual value used in the calculations. This is the merge of exception level (SKU/Store/Day), default level (Sub-class/Store format), and global level (Dept) values entered. |
|
Shelf Capacity Flag (expanded) - Store |
The Shelf Capacity Flag is used to determine if the RP and RUTL should be capped by the shelf capacity. The Shelf Capacity Flag options are:
Example: Selecting Yes causes SRP to use shelf capacity to cap RP and RUTL. Selecting No or Default, SRP does not use shelf capacity to cap RP and RUTL. Shelf Capacity Flag (expanded) - Store displays the actual value used in the calculations. This is the merge of exception level (SKU/Store/Day), default level (Sub-class/Store format), and global level (Dept) values entered. |
|
Store Source Label |
The Store Source Label identifies the source from which this store receives inventory. |
|
Time Supply Horizon (expanded) - Store |
The Time Supply Horizon parameter is used to specify days of forecast in order to calculate a rate of sale. If a time supply horizon is specified, the rate of sale is used instead of the actual forecast when calculating demand over the time supply days for inventory target level calculations for the Time Supply Replenishment Method. Example: A Time Supply Horizon of 7 calculates a Rate of Sale (ROS) over a one week period. The ROS is then calculated by summing the forecasted sales over the seven days and dividing that number by seven. Time Supply Horizon (expanded) - Store displays the actual value used in the calculations. This is the merge of exception level (SKU/Store/Day), default level (Sub-class/Store format), and global level (Dept) values entered. |
|
Weekly Sales Max (expanded) - Store |
Maximum stock boundary for the Factor AWS, Sales Week Range, and Loaded SS Dynamic Replenishment methods. Weekly Sales Max (expanded) - Store displays the actual value used in the calculations. This is the merge of exception level (SKU/Store/Day), default level (Sub-class/Store format), and global level (Dept) values entered. |
|
Weekly Sales Min (expanded) - Store) |
Minimum stock boundary for the Factor AWS, Sales Week Range, and Loaded SS Dynamic Replenishment methods. Weekly Sales Min (expanded) - Store displays the actual value used in the calculations. This is the merge of exception level (SKU/Store/Day), default level (Sub-class/Store format), and global level (Dept) values entered. |
|
User Specified Presentation Stock (expanded) - Store |
User Specified Store Presentation Stock is the minimum amount of stock in units desired to have on hand for display/sales purposes. User Specified Store Presentation Stock may be taken into consideration when calculating the RP and RUTL, depending on the Boundary Stock selected. User Specified Presentation Stock (expanded) - Store displays the actual value used in the calculations. This is the merge of exception level (SKU/Store/Day), default level (Sub-class/Store format), and global level (Dept) values entered. |
|
Total Substitute Demand Quantity |
The Total Substitute Demand Quantity is a quantity of demand expected to occur as a result of one or more other SKUs being out of stock. This quantity represents increased demand on the original SKU by other related SKUs. This measure has a related filtered worksheet. See the Substitution Details View for more information. |
|
Total Substitute Received Quantity |
The Total Substitute Received Quantity is a quantity of stock that an original SKU has received from other substitute SKUs in order to attempt to cover a shortage that the original SKU has experienced. |
Hidden Measures
Table 7-11 lists the measures in this view that are hidden when using the default template. They can be displayed and maintained by using the Insert measure function of RPAS. Hidden measures may also be added to the template during configuration.
Table 7-11 Hidden Measures: SRP Replenishment Summary (SKU/Store/Day) Interactive View
| Measure Label | Description |
|---|---|
|
Active SKU CAP (Expanded) |
SKU Cap value (in units) that is used in store replenishment calculations. During replenishment calculations, this is the maximum boundary for inventory at the store. |
|
Cases per Pallet - Store |
Cases per Pallet - Store reflects the number of cases on a pallet. Note: Cases per Pallet - Store is loaded from Data Management (DM). |
|
Daily Sales - Store |
Daily Sales - Store represents the daily sales for a SKU/Store/Day. Note: This measure is loaded from an external system for use in calculating SRP alerts. |
|
Acceptable Loss (expanded) - Store |
Store Acceptable Loss represents the percentage of a case that is acceptable to lose from spoilage in order to prevent stock outs. This measure is used when rounding ideal receipt quantities. Store Spoilage Threshold is calculated as 1 minus Store Acceptable Loss. Example: Store Acceptable Loss of .25 means it is acceptable to lose 25% of a case from spoilage. In this case, spoilage threshold would be calculated as .75, but only acceptable loss would be updated in the database. Acceptable Loss (expanded) - Store displays the actual value used in the calculations. This is the merge of exception level (SKU/Store/Day), default level (Sub-class/Store format), and global level (Dept) values entered. |
|
Store Ads Grand Opening |
Store Ads Grand Opening indicates grand opening ads exist for this SKU/Store/Day. This measure can be aggregated to provide information regarding the number of locations that are on Ad. Note: This measure is loaded from an external system. |
|
Store Ads Inserts |
Store Ads Inserts indicates inserts ads exist for this SKU/Store/Day. This measure can be aggregated to provide information regarding the number of locations that are on Ad. Note: This measure is loaded from an external system. |
|
Store Ads Others |
Store Ads Others indicates other miscellaneous ads exist for this SKU/Store/Day. This measure can be aggregated to provide information regarding the number of locations that are on Ad. Note: This measure is loaded from an external system. |
|
Store Ads Run on Press |
Store Ads Run on Press indicates run on press ads exist for this SKU/Store/Day. This measure can be aggregated to provide information regarding the number of locations that are on Ad. Note: This measure is loaded from an external system. |
|
Store Available Space |
Store Avail Space represents the remaining space available under the SKU Cap after considering Store Inventory and Expected Receipts over the appropriate time periods. |
|
Store Avg Rate of Sale |
Store Avg Rate of Sale represents an item's average daily rate of sale at a store. Note: This measure is loaded from an external system at the SKU/Store level and spread to the SKU/Store/Day level across the planning horizon. |
|
Store Back Orders |
Back Orders shows the SKU/warehouse back order quantity placed on Today. Back Orders is incorporated into the inventory boundaries calculation to increase the warehouse stock level. It represents an increased level of demand and therefore an increased level of inventory visible throughout the plan. |
|
Store Capped Difference |
The Store Capped Difference is equal to Non-Capped URP - URP on any ATP day. |
|
Store Demand on Source |
The Store Demand on Source is equal to the URP time-shifted backwards based on the lead-time on the receipt day of the URP into the store. |
|
Expected Spoilage - Store |
Expected Spoilage refers to a quantity of a SKU at a store whose product life expires and therefore becomes un-sellable at the end of a day. Expired quantities cannot be used for any sales after the day they expire. Expected Spoilage - Store is only calculated when the global Inventory Aging Flag is set to True, the Product Life of the SKU is greater than zero and the Product Life of the SKU is less than or equal to the Aging Threshold. The calculation is based on the inventory position, demand, expected receipts and product life. You can specify an expected write-off quantity which overrides the expected spoilage if the write-off quantity is greater than the calculated value. |
|
Expected Write Off - Store |
Expected Write Off - Store represents the quantity of stock expected to be thrown out for any reason (spoilage, breakage, and so on) on a given day. Expected Write Offs override calculated expected spoilage. Note: This measure is loaded from an external system. |
|
Expected Receipts In Transit - Store |
Expected Receipts In Transit - Store represents Inventory in transit from warehouses and suppliers to store. Note: This measure is loaded from an external system. |
|
Store Known Demand |
Store Known Demand is the quantity in units of confirmed demand that is known for any reason. Known demand is used in place of the forecast if the known demand is greater than the forecast. Note: This measure is loaded from an external system. |
|
Store Loaded Safety Stock History |
Store Loaded Safety Stock History maintains history of the Loaded Safety Stock measure. Note: This measure is loaded from an external system. |
|
Max Selllable Quantity - Store |
Max Selllable Quantity - Store (MSQ) represents a level of inventory that can be sold within the life of a product. It is calculated as all forecast demand over the product life starting from the beginning of the review time. Customer Orders over the Review Time (CORT) are then added. Max Selllable Quantity - Store is only calculated on Available to Plan receipt days. As MSQ is dependent upon Product Life (PL), where Product Life is deemed to be not relevant for a SKU, the MSQ is considered infinite (Unbounded). |
|
Min Sales Stock - Store |
Min Sales Stock - Store (MSS) represents a level of inventory required to meet demand. This is calculated as forecast demand over the review time. Customer Orders over the Review Time (CORT) are then added. For those replenishment methods where forecasted demand is not used, demand in the MSS calculation is replaced with calculated Safety Stock. Min Sales Stock - Store is only calculated on Available to Plan receipt days. If a shelf capacity constraint exists (Shelf Capacity Flag is set to True) Store Minimum Sales Stock may not exceed the level required to fill the shelf to capacity and meet CORT. |
|
Store Non-Capped Demand on Source |
The Store Non-Capped Demand on Source is equal to the Non-Capped URP time-shifted backwards based on the lead-time on the receipt day of the URP into the store. |
|
Store Non-Capped URP |
Store Non-Capped URP represents the theoretical URP at the SKU/Store/day level, which would have been calculated if the SKU was not capped at all across time. |
|
Store Numeric In Scope Indicator |
Store Numeric In Scope Indicator is used in SRP alert processing to determine the alerting store ratio. It represents the number of stores for a SKU that are in-scope (stores which fall between on supply and off supply) during the alert horizon. |
|
Expected Receipts On Order - Store |
Expected Receipts On Order - Store are fixed orders currently being processed for delivery to store either from warehouses or directly from suppliers Note: This measure is loaded from an external system. |
|
Store Product Life |
Store Product Life represents the number of days from the time a product arrives at the store until it spoils. |
|
Store Review Time |
Store Review Time is a calculated measure indicating the number of days until the next delivery. Store Review Time is only calculated on Available to Plan receipt days. |
|
Spoilage Threshold (expanded) - Store |
Spoilage Threshold is a threshold used as a pack rounding constraint. Ideal receipt quantities are rounded up if they exceed the spoilage threshold. Store Acceptable Loss is calculated as 1 minus Spoilage Threshold - Store. Example: A Spoilage Threshold - Store of 0.75 rounds a planned receipt down a case when less than 75% of the case is expected spoilage. In this case, acceptable loss would be calculated as 0.25 and acceptable loss would be updated in the database. Spoilage Threshold (expanded) - Store displays the actual value used in the calculations. This is the merge of exception level (SKU/Store/Day), default level (Sub-class/Store format), and global level (Dept) values entered. |
|
Supplier Compliance Safety Stock - Store |
Supplier Compliance Safety Stock - Store represents additional Safety Stock Units added to the calculated Safety Stock. The Supplier Compliance Safety Stock - Store is calculated as a number of days of demand going forward from the larger of review time or number of inventory selling days. |
|
Store USA Over Review Time |
Store USA Over Review Time (USART) is the sum of User Specified Allocations over the review time. Store USA Over Review Time is only displayed on Available to Plan receipt days. |
|
Store USA Over Review Time Type |
The Store USA Over Review Time Type measure indicates the allocation combination type that is used when regarding the USART quantity as a whole. The first populated USA type in the review time is used as the USART type. Store USA Over Review Time Type Time is only displayed on Available to Plan receipt days. |
|
Store User Specified Allocation |
Store User Specified Allocations (USA) are allocations that are defined by you and accounted for in projected inventory. USAs are maintained in the USA workbooks. |
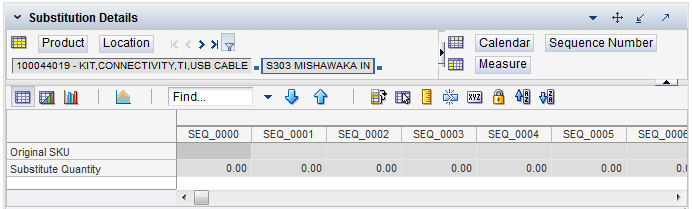
This view displays a filtered view of substitution-specific data at the SSKU/SKU/Destination /Day level.
These measures are read-only.
Table 7-12 lists the read-only measure in this view.
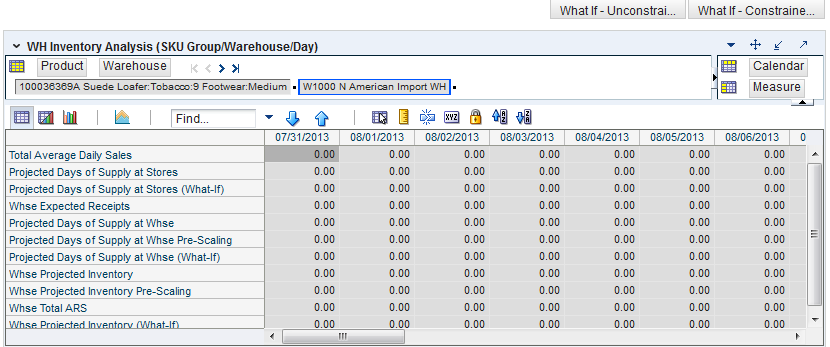
This view contains aggregate warehouse inventory information for review and inventory analysis purposes.
Table 7-13 lists the measures in this view.
Table 7-13 Measures: WH Inventory Analysis (SKU Group/Warehouse/Day) Interactive View
| Measure Label | Description |
|---|---|
|
Projected Days of Supply at Stores |
Projected Days of Stock at the store indicates the total number of days of supply on-hand at stores on a given day for all stores sourced from a given warehouse. Projected Days of Supply at Stores is calculated by summing the Projected Inventory - Store measure for all stores sourced from a given warehouse and dividing that sum by the Total Average Daily Sales. |
|
Total Average Daily Sales |
Total Average Daily Sales represents the sum of the daily Average Rate of Sale (ARS) for a given SKU on a given day for all the stores that are sourced from a given warehouse. Average Rate of Sale (ARS) is calculated by dividing the weekly ARS by seven. Weekly ARS is an external load. |
|
WH Expected Receipts |
WH Expected Receipts represents the total warehouse expected receipts for the store's source warehouse. |
|
Projected Days of Supply at Whse |
Projected Days of Supply at Warehouse indicates the total number of days of supply on-hand at the warehouse on a given day. Projected Days of Supply at Warehouse is calculated in AIP Batch at SKUG/WH/Day level by taking the WH Projected Inventory divided by the WH Total Average Daily Sales. |
|
Projected Days of Supply at Whse Pre-Scaling |
Projected Days of Supply at Warehouse Pre-Scaling indicates the total number of days of supply on-hand at the warehouse on a given day. Projected Days of Supply at Warehouse Pre-Scaling is calculated in AIP Batch at SKUG/WH/Day level by taking the WH Projected Inventory-Pre-scaling divided by the WH Total Average Daily Sales. |
|
WH Projected Inventory |
WH Projected Inventory (PI) represents a projection of the opening inventory position for any day in the planning horizon at the warehouse. None of that day's activities (either receipts or demand) are reflected in PI, and so it is often referred to as a beginning of day position. This measure has a related filtered worksheet. See the Inventory Packsize Details View for more details. |
|
Warehouse Projected Inventory - Pre-scaling |
WH Projected Inventory (PI) represents a projection of the warehouse opening inventory position for any day in the planning horizon. None of that day's activities (either receipts or demand) are reflected in PI, and so it is often referred to as a beginning of day position. When calculating the projected inventory position the planned receipts element of the calculation are the receipt quantities before supplier and container scaling constraints are applied. This measure has a related filtered worksheet. See the Inventory Packsize Details View for more details. |
|
Whse Projected Inventory (What-if) |
Warehouse Projected Inventory (What-if) is the value after What-if calculations have been run on the Warehouse Projected Inventory measure. This measure has a related filtered worksheet. See the Inventory Packsize Details View for more details. |
|
WH Total ARS |
WH Total ARS represents the Total Average Daily Sales and WH Independent ARS. It is calculated by adding the sum of the store ARS for all stores sourced from a given warehouse to the warehouse independent ARS. |
This step contains views that allow you to examine the store replenishment plans. The available views are:
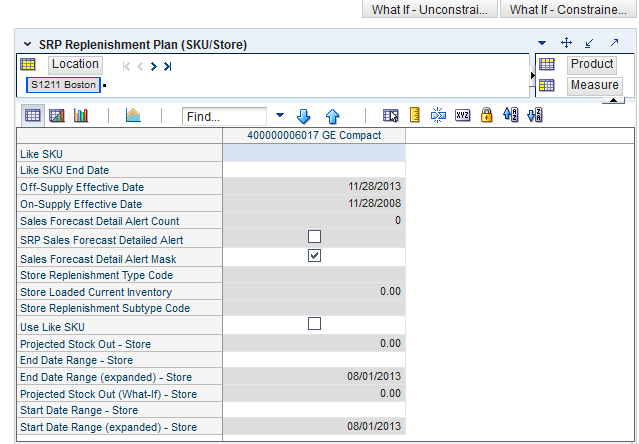
This view allows you to review replenishment plan information at the (SKU/Store) level.
Table 7-14 lists the measures in this view.
Table 7-14 Measures: SRP Replenishment Plan (SKU/Store) Interactive View
| Measure Label | Description |
|---|---|
|
Like SKU |
Like SKU allows you to select a similar SKU to obtain sales history from for new SKUs or SKUs with scant historical data. The new SKU uses the Like SKUs history until the Like SKU End Date when the new SKU has built up stable sales history. The Like SKU's sales history is used in the RP and RUTL boundaries for a new SKU using the Sales Week Range or Factor AWS replenishment method. Valid values are any SKU within the same domain as the new SKU. |
|
Like SKU End Date |
The Like SKU End Date parameter allows you to select the date that should be used as the ending point for using the Like SKUs sales history in calculations for the Sales Week Range and Factor AWS replenishment methods. A pop-up calendar can be used to select the desired end date. |
|
Off-Supply Effective Date |
The Off-Supply Effective Date represents the date a store should stop receiving the product. Note: The Off-Supply Effective Date is loaded from Data Management (DM). (Read only) |
|
On-Supply Effective Date |
The On-Supply Effective Date represents the date a store should begin receiving the product. Note: The On-Supply Effective Date is loaded from Data Management (DM). (Read only) |
|
Projected Stock Out - Store |
Projected Stock Out - Store is calculated based on forecasted demand and projected inventory. It represents the projected lost sales as a result of an out of stock at the store. |
|
Projected Stock Out (What-if) - Store |
Projected Stock Out (What-if) - Store initially displays the value calculated in the previous AIP Batch run. If any changes are made to SRP parameters and you select What-if - Unconstrained or What-if - Constrained from the Quick Access toolbar, this measure is updated with the newly calculated Projected Stock Out - Store for the SKU/Store.(Read only) |
|
Sales Forecast Detail Alert Count |
The Sales Forecast Detail Alert Count represents the number of alert hits from a forecasting system for this SKU/Store. This allows you to consider if action needs to be taken in the forecasting system to correct a problem prior to making changes to any SRP parameters. Note: The Sales Forecast Detail Alert Count is loaded from an external system. (Read only) |
|
Sales Forecast Detail Alert Mask |
The Sales Forecast Detail Alert Mask allows you to start or stop generating the Sales Forecast alert based on dates. If the alert mask is False for the SKU/Store/Day, no alert is generated. Valid values are True or False. The Sales Forecast Detail Alert Mask default is True. |
|
SRP Sales Forecast Detailed Alert |
The SRP Sales Forecast Detailed Alert indicates a Sales Forecast alert exists for this SKU/Store.(Read only) |
|
Store Current Inventory |
Store Current Inventory represents the store's on hand position inventory position. Note: Current Inventory is loaded from an external system. Negative values are rejected by SRP and replaced with a zero. There is a contingency process in the event that the load from a store fails. It provides SRP with a system generated current store inventory value for its replenishment calculations. The calculations starts with yesterdays projected inventory position and adds in the difference between actual sales and forecasted demand. (Read only) |
|
End Date Range - Store |
The End Date Range - Store measure allows you to select the date that should be used as the ending point for determining the historical sales data used by the Sales Week Range and Factor AWS replenishment methods. In the Sales Week Range method, the date range is the period over which sales history is summed. In the Factor AWS method, it is the time period over which average weekly sales is calculated. A pop-up calendar can be used to select the desired end date. Select a date less than or equal to the current date. |
|
End Date Range (expanded) - Store |
End Date Range (expanded) - Store displays the actual value used in the calculations. This is the merge exception level (SKU/Store/Day), default level (Sub-class/Store format), and global level (Dept) values entered.(Read only) |
|
Store Replenishment Subtype Code |
Store Replenishment Subtype Code represents user defined replenishment subtype codes. These codes are display only and are not used in any calculations. Note: Store Replenishment Subtype Code is loaded from an external system. (Read only) |
|
Store Replenishment Type Code |
Store Replenishment Type Code represents user defined replenishment subtype codes. These codes are display only and are not used in any calculations. Note: Store Replenishment Type Code is loaded from an external system. (Read only) |
|
Store Start Date Range |
The Start Date Range parameter allows you to select the date that should be used as the starting point for determining the historical sales data used by the Sales Week Range and Factor AWS replenishment methods. In the Sales Week Range method, the date range is the period over which sales history is summed. In the Factor AWS method, it is the time period over which average weekly sales is calculated. A pop-up calendar can be used to select the desired start date. Select a date less than or equal to the current date. |
|
Start Date Range (expanded) - Store |
Start Date Range (expanded) - Store displays the actual value used in the calculations. This is the merge exception level (SKU/Store/Day), default level (Sub-class/Store format), and global level (Dept) values entered.(Read only) |
|
Use Like SKU |
Use Like SKU indicates whether or not the Like SKU is used to obtain sales history in the RP and RUTL boundary calculations when using the Sales Week Range or Factor AWS replenishment method. Valid values are True or False. The Use Like SKU default is False. |
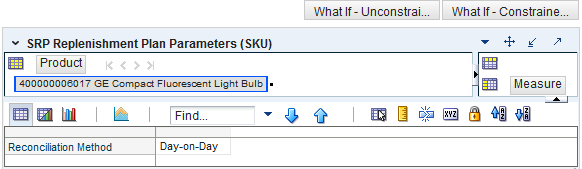
This view allows you to review replenishment plan information at the SKU level.
Table 7-15 lists the measures in this view.
Table 7-15 Measures: SRP Replenishment Plan Parameters (SKU) Interactive View
| Measure Label | Description |
|---|---|
|
Reconciliation Method |
The Reconciliation Method is used to determine if reconciliation occurs on a day by day basis or over time. The Reconciliation Method options are:
Example: Selecting Day-on-Day causes reconciliation from the source warehouse or supplier to occur for each day in the planning horizon. Day-on-Day reconciliation ships the inventory out to the store or warehouse destination quickly, considering only those destination stores or warehouses where a shipment today would arrive on the Available to Plan (ATP) day. While this method may ship the inventory sooner than the Reconcile Over Time method, stores or warehouses with ATP days later in the review period may receive less inventory than those with ATP days earlier in the review period. Selecting Reconcile Over Time causes reconciliation from the source warehouse or supplier to occur over each review period in the planning horizon. Reconcile Over Time allocation may cause some inventory to be retained at the source warehouse or supplier for shipment later in the review period. While this method may not ship the inventory as quickly as the Day-on-Day method, all ATP days within the review period for all stores and warehouses are considered equally in the inventory allocation. |
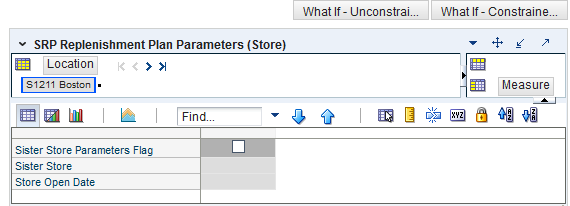
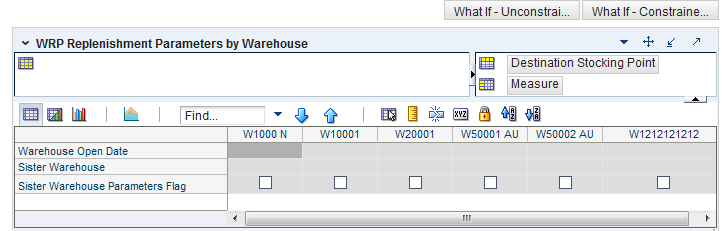
This view allows you to review replenishment plan information at the Store level.
Table 7-16 lists the measures in this view.
Table 7-16 Measures: SRP Replenishment Plan Parameters (Store) Interactive View
| Measure Label | Description |
|---|---|
|
Sister Store |
A Sister Store allows you to model a new store after a store with similar characteristics and anticipated similar sales. To do this, a Sister Store relationship is set up in RMS. Once this relationship is established, AIP performs a one-time copy of all required replenishment settings and parameters from the sister store. AIP performs a weekly copy of sales history from the sister store to a new store that is scheduled to open. It continues to copy the sales history weekly up until the Store Opening Date. |
|
Sister Store Parameters Flag |
The Sister Store Parameters Flag Indicates that a sister store has had all store parameters copied from its sister store to itself. Note: This measure is loaded from Data Management (DM). |
|
Store Open Date |
Store Open Date is used in sister store copy. Sales history from the sister store is copied to the new store until the new store reaches its opening date. Note: This measure is loaded from Data Management (DM). |
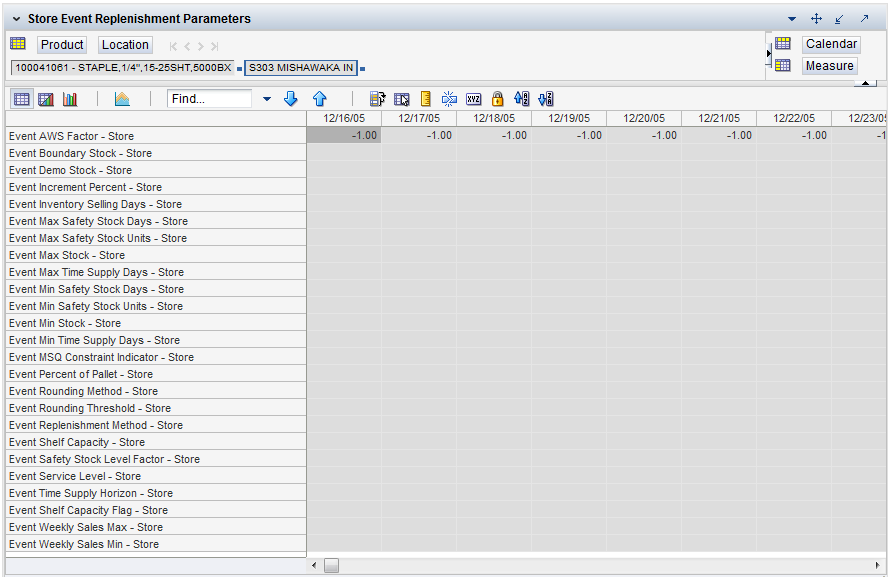
This view allows you to review store event replenishment plan information at the (SKU/Store/Day) level.
Table 7-17 lists the measures in this view.
Table 7-17 Measures: Store Event Replenishment Parameters View
| Measure Label | Description |
|---|---|
|
Event AWS Factor – Store |
The Event AWS Factor – Store is used in the Factor AWS Repl Method |
|
Event Boundary Stock – Store |
The Event Boundary Stock – Store is used in the Factor AWS, Sales Week Range, and Loaded SS Dynamic Repl Methods |
|
Event Demo Stock – Store |
The Event Demo Stock – Store is used in the RP and RUTL calculations |
|
Event Increment Percent – Store |
The Event Increment Percent – Store is used in the Min/Max Repl Method |
|
Event Inventory Selling Days – Store |
The Event Inventory Selling Days – Store is used in the Hybrid, Poisson, Dynamic and Loaded SS Dynamic Repl Methods |
|
Event Max Safety Stock Days – Store |
The Event Max Safety Stock Days – Store is used in the Minimum Safety Stock Boundaries calculation |
|
Event Max Safety Stock Units – Store |
The Event Max Safety Stock Units – Store is used in the Minimum Safety Stock Boundaries calculation |
|
Event Max Stock – Store |
The Event Max Stock – Store is used in the Min/Max Repl Method |
|
Event Max Time Supply Days – Store |
The Event Max Time Supply Days – Store is used in the Time Supply Repl Method |
|
Event Min Safety Stock Days – Store |
The Event Min Safety Stock Days – Store is used in the Minimum Safety Stock Boundaries calculation |
|
Event Min Safety Stock Units – Store |
The Event Min Safety Stock Units – Store is used in the Minimum Safety Stock Boundaries calculation |
|
Event Min Stock – Store |
The Event Min Stock – Store is used in the Min/Max Repl Method |
|
Event Min Time Supply Days – Store |
The Event Min Time Supply Days – Store is used in the Time Supply Repl Method |
|
Event MSQ Constraint Indicator – Store |
Event MSQ Constraint Indicator – Store indicates when the MSQ should be removed from ordering decisions. If the indicator is On, MSQ will be used as a constraint. |
|
Event Percent of Pallet – Store |
The Event Min Stock – Store is used in Pallet Rounding |
|
Event Replenishment Method - Store |
Event-specific measure at the SKU/Store/Day level. The Replenishment Method determines the type of calculations that are used in generating a store replenishment plan. The default is No Replenishment. |
|
Event Rounding Method – Store |
The Event Rounding Method – Store calculates in Data Management for Singles and can be updated at the default and exception level in SRP. |
|
Event Rounding Threshold – Store |
The Event Rounding Threshold – Store is used in the IRQ calculation |
|
Event Safety Stock Level Factor – Store |
The Event Safety Stock Level Factor – Store is used in the Time Supply, Hybrid, Poisson, Dynamic and Loaded SS Dynamic Repl Methods. If a 0 is desired, a small fraction must be entered. |
|
Event Service Level – Store |
The Event Service Level – Store is used in the in Dynamic Repl Method. |
|
Event Shelf Capacity – Store |
Event-specific measure at the SKU/Store/Day level. Shelf Capacity is the amount of stock in units to fill a shelf to the desired maximum level. |
|
Event Shelf Capacity Flag - Store |
The Event Shelf Capacity Flag - Store is used in the RP and RUTL calculations |
|
Event Time Supply Horizon - Store |
The Event Time Supply Horizon - Store is used in the Time Supply Repl Method |
|
Event Weekly Sales Max – Store |
The Event Weekly Sales Max – Store is used in the Factor AWS, Sales Week Range, and Loaded SS Dynamic Repl Methods |
|
Event Weekly Sales Min – Store |
The Event Weekly Sales Min – Store is used in the Factor AWS, Sales Week Range, and Loaded SS Dynamic Repl Methods |
Hidden Measures
Table 7-18 lists the measures in this view that are hidden when using the default template. They can be displayed and maintained by using the Insert measure function of RPAS. Hidden measures may also be added to the template during configuration.
Table 7-18 Hidden Measures: Store Event Replenishment Parameters View
| Measure Label | Description |
|---|---|
|
Event Acceptable Loss – Store |
The Event Acceptable Loss – Store is used in the Expected Spoilage calculation If you edit this measure on this worksheet:
|
|
Event Spoilage Threshold - Store |
The Event Spoilage Threshold - Store is used in theExpected Spoilage calculation If you edit this measure on this worksheet:
|
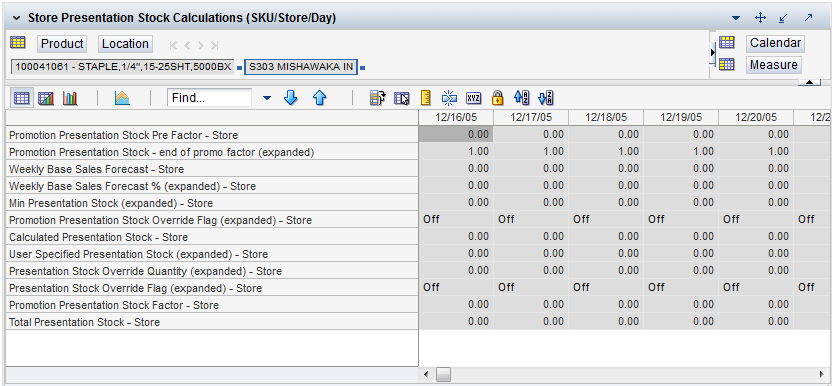
This view allows you to view store presentation stock calculations at the (SKU/Store/Day) level.
Table 7-19 lists the measures in this view.
Table 7-19 Measures: Store Presentation Stock Calculations (SKU/Store/Day) View
| Measure Label | Description |
|---|---|
|
Promotion Presentation Stock Pre Factor - Store |
The Promotion Presentation Stock Pre Factor - Store represents the specified quantity for Store Promotion Presentation Stock before application of the End of Store Promotion Factor. |
|
Promotion Presentation Stock – end of promo factor (expanded) |
The Promotion Presentation Stock – end of promo factor (expanded) displays a factor of 1 for the days within the promotion period prior to the ramp down and will then show the designated End of Promotion Factor values as it approaches the end of the promotion. A factor of 1 will be displayed after the promotion has ended. |
|
Promotion Presentation Stock Override Flag (expanded) – Store |
The expanded version of Store Promotion Presentation Stock Override Flag displays the actual value used in the calculations. This is the merge of exception level (SKU/Store/Day), default level (Sub-class/Store format), and global level (Dept) values entered. |
|
Store Promotion Presentation Stock |
The Store Promotion Presentation Stock calculates at sku/str/day which represents the End of Store Promotion Factor applied to the Base Store Promotion Presentation Stock. If the Store Promotion Presentation Stock Override Flag is turned on, this becomes equal to 0. |
|
Weekly Base Sales Forecast – Store |
The Weekly Base Sales Forecast – Store is the Day level representation of the weekly base sales forecast. This is calculated by replicating the value from Loaded Weekly Base Sales Forecast to sku/str/day. |
|
Weekly Base Sales Forecast % (expanded) - Store |
The expanded version of Store Weekly Base Sales Forecast displays the actual value used in calculations. This represents the merge of the global default, default and exception level versions of Store Weekly Base Sales Forecast. 0 represents 0% of the forecast to be used and 1 will indicate to use 100% of the forecast. |
|
Min Presentation Stock (expanded) - Store |
The expanded version of Store Minimum Presentation Stock displays the actual value used in calculations. This represents the merge of the global default, default and exception level versions of Store Minimum Presentation Stock. |
|
Calculated Presentation Stock - Store |
The Calculated Presentation Stock - Store represents the max(Weekly Base Sales Forecast x Weekly Base Sales Forecast %, Store Minimum Presentation Stock). If the Calculated Store Presentation Stock Indicator is turned off, this value is 0. |
|
Presentation Stock Override Flag (expanded) – Store |
The expanded version of Store Presentation Stock Override Flag displays the actual value used in calculations. This represents the merge of the global default, default and exception level versions of Store Presentation Stock Override Flag. |
|
Presentation Stock Override Quantity (expanded) – Store |
The expanded version of Store Presentation Stock Override Quantity which displays the actual value used in calculations. This represents the merge of the global default, default and exception level versions of Store Presentation Stock Override Quantity. |
|
User Specified Presentation Stock (expanded) - Store |
The expanded version of User Specified Store Presentation Stock displays the actual value used in the calculations. This is the merge of exception level (SKU/Store/Day), default level (Sub-class/Store format), and global level (Dept) values entered |
|
Total Presentation Stock - Store |
The Total Presentation Stock - Store represents the max when the Store Presentation Stock Override Flag is selected. |
This task allows you to examine the warehouse replenishment plan.
Use the WRP Interactive Evaluation workbook to perform the step for this task. To build this workbook, see "WRP Interactive Evaluation Workbook".
These steps helps you achieve this task:
Product & Location Attributes Step
This step contains views that allow you to examine the warehouse replenishment plan. The available views are:
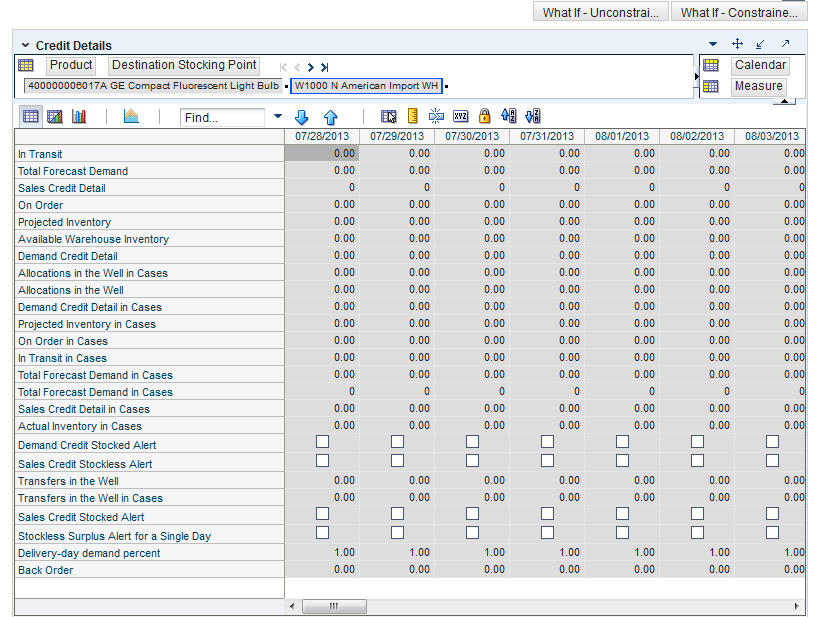
This view provides credit detail information at the SKU Group/destination/day level.
Table 7-20 lists the measures in this view.
Table 7-20 Measures: Credit Details Interactive View
| Measure Label | Description |
|---|---|
|
Actual Inventory in Cases |
Read-only view of inventory at the warehouse; including on order, in transit, transfers in the well, and allocations in the well. Displayed in cases. |
|
Available Warehouse Inventory |
Read-only view of inventory at the warehouse; including on order, in transit, transfers in the well, and allocations in the well. Displayed in units. |
|
Back Orders |
Back Orders shows the SKU/warehouse back order quantity placed on Today. Back Orders is incorporated into the inventory boundaries calculation to increase the warehouse stock level. It represents an increased level of demand and therefore an increased level of inventory visible throughout the plan. |
|
Demand Credit Detail |
Demand credit is the amount the inventory was short of demand. It is calculated as the shortage between the projected actual warehouse inventory and total forecasted warehouse demand for the day. This is a read only measure and is displayed in units. |
|
Demand Credit Detail in Cases |
Demand credit is the amount the inventory was short of demand. It is calculated as the shortage between the projected actual warehouse inventory and total forecasted warehouse demand for the day. This is a read only measure and is displayed in cases. |
|
Demand Credit Stocked Alert |
A demand credit stocked alert notifies you that a stock shortage exists at this warehouse based on forecasted demand. The Demand Credit Stocked Alert for a Single Day for a Stocked SKU indicates that the demand credit exceeds the demand credit threshold AND the demand credit percentage exceeds the demand credit percentage on a given day for a stocked item. This is a read only measure. |
|
In Transit |
This is a read-only view of in-transits in units. In transits are considered orders into the destination stocking point that have left the source stocking point. In transits are included in expected receipts in the projected inventory calculation. |
|
In Transit in Cases |
This is a read-only view of in-transits in cases. In transits are considered orders into the destination stocking point that have left the source stocking point. In transits are included in expected receipts in the projected inventory calculation. |
|
On Order |
This is a read-only view of on orders in units. These are open orders that are currently being processed for delivery to warehouses. On orders are included in expected receipts in the projected inventory calculation. |
|
On Order in Cases |
This is a read-only view of on orders in cases. These are open orders that are currently being processed for delivery to warehouses. On orders are included in expected receipts in the projected inventory calculation. |
|
Transfers in the Well |
This is a read-only view of transfers in the well in units. It represents a total quantity of inventory required to satisfy transfers that have already been released by AIP to the warehouse but not yet picked. |
|
Transfers in the Well in Cases |
Transfers in the Well converted to Cases. |
|
Allocations in the Well |
This is a read-only view of all allocations in the well in units. It represents planned inventory movement out of the warehouse that will consume inventory and therefore is subtracted from the future inventory assessments. |
|
Allocations in the Well in Cases |
Allocations in the Well converted to Cases. |
|
Projected Inventory |
This is a read-only view of projected inventory in units. Projected Inventory (PI) is calculated in batch and represents a projection of the opening inventory position for any day in the planning horizon at a specific warehouse. None of that day's activities (either receipts or demand) are reflected in PI, and so it is often referred to as a beginning of day position. PI on a given day is calculated as the PI of the previous day plus the net impact of all forecasted demand and expected and planned receipts on the previous day. |
|
Projected Inventory in Cases |
This is a read-only view of projected inventory in cases. Projected Inventory (PI) is calculated in batch and represents a projection of the opening inventory position for any day in the planning horizon at a specific warehouse. None of that day's activities (either receipts or demand) are reflected in PI, and so it is often referred to as a beginning of day position. PI on a given day is calculated as the PI of the previous day plus the net impact of all forecasted demand and expected and planned receipts on the previous day. |
|
Sales Credit Detail |
Sales credit is the amount the inventory was short of sales in units. It is calculated as the shortage between the projected warehouse inventory and total forecasted store sales of the day. This read-only measure is calculated each day from today to the end of the fixed period. |
|
Sales Credit Detail in Cases |
Sales credit is the amount the inventory was short of sales in cases. It is calculated as the shortage between the projected warehouse inventory and total forecasted store sales of the day. This read-only measure is calculated each day from today to the end of the fixed period. |
|
Sales Credit Stocked Alert |
A sales credit stocked alert notifies you that a stock shortage exists at this warehouse based on forecasted store orders. The Sales Credit Stocked Alert for a Single Day for a Stocked SKU is read-only and indicates that the sales credit exceeds the sales credit threshold and the sales credit percentage exceeds the sales credit percentage on a given day for a stocked item. |
|
Sales Credit Stockless Alert |
A sales credit stockless alert notifies you that a stock shortage exists at this warehouse based on forecasted store orders. The Sales Credit Stockless Alert for a Single Day for a Stockless SKU is read-only and indicates that the sales credit exceeds the sales credit threshold and the sales credit percentage exceeds the sales credit percentage on a given day for a stockless item. This read only measure is unavailable until the workbook is rolled up to SKU Group/Destination level. |
|
Total Forecast Demand |
Read-only measure that displays constrained forecasted demand in units aggregated to the stocking point level. |
|
Total Forecast Demand in Cases |
Read-only measure that displays constrained forecasted demand in cases aggregated to the stocking point level. |
This view provides credit summary information at the SKU Group/Destination level.
Table 7-21 lists the measures in this view.
Table 7-21 Measures: WRP Credit Summary Interactive View
| Measure Label | Description |
|---|---|
|
Pre-allocation Must Consume Flag |
A read only measure that indicates whether allocations should be created for the entire receipt quantity. This is only applicable when the SKU Group and warehouse are pre-allocated. |
|
Demand Credit Multi-Day Stocked Alert |
A demand credit alert notifies you that a stock shortage exists at this warehouse based on forecasted demand. The demand credit multi-day stocked alert indicates that the number of consecutive days with a demand credit exceeds the demand credit days threshold for this item. This is a read-only measure. |
|
Demand Credit Summary |
A read only summation in units of demand credits for a given SKU group/warehouse. |
|
Demand Credit Summary Alert |
A demand credit alert notifies you that a stock shortage exists at this warehouse based on forecasted demand. It is triggered when either Demand Credit for a Single Day for a Stocked SKU is flagged or Demand Credit for Multiple Days for a Stocked SKU Group is flagged. This is a read-only measure. |
|
Demand Credit Summary in Cases |
A read only summation in cases of demand credits for a given SKU group/warehouse. |
|
Sales Credit Multi-Day Stocked Alert |
A Sales credit alert notifies you that a stock shortage exists at this warehouse based on forecasted store sales. The sales credit multi-day stocked alert indicates that the number of consecutive days with a sales credit exceeds the sales credit days threshold for this item. This is a read-only measure. |
|
Sales Credit Multi-Day Stockless Alert |
A Sales credit alert notifies you that a stock shortage exists at this warehouse based on forecasted store sales. The sales credit multi-day stockless alert indicates that the number of consecutive days with a sales credit exceeds the sales credit days threshold for this item. This is a read-only measure. |
|
Sales Credit Summary |
A read only summation in units of sales credits for a given SKU group/warehouse. |
|
Sales Credit Summary Alert |
A sales credit alert notifies you that a stock shortage exists at this warehouse based on forecasted store sales. It is triggered when either Sales Credit for a Single Day for a Stocked or Stockless SKU is flagged or Sales Credit for Multiple Days for a Stocked or Stockless SKU Group is flagged. This is a read-only measure. |
|
Sales Credit Summary in Cases |
A read only summation in cases of sales credits for a given SKU group/warehouse. |
|
Stockless Surplus Alert for Multiple Days |
A stockless surplus alert notifies you that excessive orders exist at this warehouse based on warehouse demand. If a product is stockless, the Stockless Surplus Alert for Multiple Days triggers when the demand credit exceeds the Stockless Surplus Threshold and the demand credit also exceeds the number of days demand specified by the Stockless Surplus Multi-day Threshold. This is a read-only measure. |
|
Warehouse Stockless Indicator |
A read only measure indicating whether the SKU Group is stockless at the warehouse. |
This view displays detailed overstock information at the SKU Group/Destination/Day level.
Table 7-22 lists the measures in this view.
Table 7-22 Measures: Overstock Details Interactive View
| Measure Label | Description |
|---|---|
|
Back Order |
Back Orders shows the SKU/warehouse back order quantity placed on Today. Back Orders is incorporated into the inventory boundaries calculation to increase the warehouse stock level. It represents an increased level of demand and therefore an increased level of inventory visible throughout the plan. |
|
In Transit |
This is a read-only view of in-transits in units. For a given SKU Pack Size at a warehouse, in transits are considered orders into the destination stocking point that have left the source stocking point. In transits are included in expected receipts in the projected inventory calculation. |
|
In Transit in Cases |
This is a read-only view of in-transits in cases. For a given SKU Pack Size at a warehouse, in transits are considered orders into the destination stocking point that have left the source stocking point. In transits are included in expected receipts in the projected inventory calculation. |
|
On Order |
This is a read-only view of on orders in units. These are open orders that are currently being processed for delivery to warehouses. On orders are included in expected receipts in the projected inventory calculation. |
|
On Order in Cases |
This is a read-only view of on orders in cases. These are open orders that are currently being processed for delivery to warehouses. On orders are included in expected receipts in the projected inventory calculation. |
|
Transfers in the Well |
This is a read-only view of transfers in the well in units. It represents a total quantity of inventory required to satisfy transfers that have already been released by AIP to the warehouse but not yet picked. |
|
Transfers in the Well in Cases |
Transfers in the Well converted to Cases. |
|
Allocations in the Well |
This is a read-only view of all allocations in the well in units. It represents planned inventory movement out of the warehouse that will consume inventory and therefore is subtracted from the future inventory assessments. |
|
Allocations in the Well in Cases |
Allocations in the Well converted to Cases. |
|
Overstock Alert |
A read-only-only measure that indicates that an over stock alert exists for the SKU Group. |
|
Projected Inventory |
This is a read-only view of projected inventory in units. Projected Inventory (PI) is calculated in batch and represents a projection of the opening inventory position for any day in the planning horizon at a specific warehouse. None of that day's activities (either receipts or demand) are reflected in PI, and so it is often referred to as a beginning of day position. PI on a given day is calculated as the PI of the previous day plus the net impact of all forecasted demand and expected and planned receipts on the previous day. |
|
Projected Inventory in Cases |
This is a read-only view of projected inventory in cases. Projected Inventory (PI) is calculated in batch and represents a projection of the opening inventory position for any day in the planning horizon at a specific warehouse. None of that day's activities (either receipts or demand) are reflected in PI, and so it is often referred to as a beginning of day position. PI on a given day is calculated as the PI of the previous day plus the net impact of all forecasted demand and expected and planned receipts on the previous day. |
|
Projected Stock Cover Days |
Projected stock cover is defined as the number of days the opening inventory for a given day satisfies the projected outbound volume. |
|
Total Forecast Demand |
Read-only measure that displays constrained forecasted demand in units aggregated to the stocking point level. |
|
Total Forecast Demand in Cases |
Read-only measure that displays constrained forecasted demand in cases aggregated to the stocking point level. |
This view displays alert information at the SKU Group/destination level.
Table 7-23 lists the measures in this view.
Table 7-23 Measures: SKU Group Credit Totals Interactive View
| Measure Label | Description |
|---|---|
|
Corporate Discontinuation Date |
A read-only display of the corporate discontinuation date, if one has been specified. |
|
Demand Credit Max |
Largest demand credit across all days for a SKU Pack Size in units. Read-only. |
|
Demand Credit Max in Cases |
Largest demand credit across all days for a SKU Pack Size in cases. Read-only. |
|
Demand Credit Total |
A read-only summation of all demand credits at the warehouse in units. |
|
Demand Credit Total in Cases |
A read-only summation of all demand credits at the warehouse in cases. |
|
New SKU Flag |
A read-only measure indicating if the SKU has new SKU status. |
|
Number of Order Alerts |
A read-only total of the number of SKU Group demand credit alerts triggered at a warehouse. |
|
Number of Overstock Alerts |
A read-only total of the number of SKU Group overstock alerts triggered at a warehouse. |
|
Number of Sales Forecast Alerts |
A read-only total of the number of SKU Group Sales Forecast alerts triggered at a warehouse. |
|
Number of Sales Alerts |
A read-only total of the number of SKU Group sales alerts triggered at a warehouse. |
|
Number of Stockless Alerts |
A read-only total of the number of SKU Group stockless alerts triggered at a warehouse. |
|
Sales Credit Max |
Largest sales credit across all days for a SKU group in a warehouse in units. Read-only. |
|
Sales Credit Max in Cases |
Largest sales credit across all days for a SKU group in a warehouse in cases. Read-only. |
|
Sales Credit Total |
A read-only summation of all sales credits at the warehouse in units. |
|
Sales Credit Total in Cases |
A read-only summation of all sales credits at the warehouse in cases. |
This view provides credit information at the source warehouse level.
Table 7-24 lists the measures in this view.
Table 7-24 Measures: Source Credit Totals Interactive View
| Measure Label | Description |
|---|---|
|
Demand Credit Max Source |
Read-only measure showing the largest demand credit across all days for a SKU Pack Size for a source in units. |
|
Demand Credit Max in Cases Source |
Read-only measure showing the largest demand credit across all days for a SKU Pack Size for a source in cases. |
|
Demand Credit Total Source |
A read-only summation of all SKU Pack Size demand credits at the source in units. |
|
Demand Credit Total in Cases Source |
A read-only summation of all SKU Pack Size demand credits at the source in cases. |
|
Number of Order Alerts Source |
A read-only total of the number of SKU Pack Size demand credit alerts triggered at a source. |
|
Number of Sales Alerts Source |
A read-only total of the number of SKU Pack Size sales alerts triggered at a source. |
|
Number of Stockless Alerts Source |
A read-only total of the number of SKU Pack Size stockless alerts triggered at a source. |
|
Sales Credit Max Source |
Largest sales credit across all days for a SKU Pack Size at the source in units. Read-only. |
|
Sales Credit Max in Cases Source |
Largest sales credit across all days for a SKU Pack Size at the source in cases. Read-only. |
|
Sales Credit Total Source |
A read-only summation of all sales credits at the source in units. |
|
Sales Credit Total in Cases Source |
A read-only summation of all sales credits at the source in cases. |
This view provides credit total information at the destination level.
Table 7-25 lists the measures in this view.
Table 7-25 Measures: Warehouse Credit Totals Interactive View
| Measure Label | Description |
|---|---|
|
Demand Credit Max |
Largest demand credit across all days for a SKU Pack Size in units. Read-only. |
|
Demand Credit Max in Cases |
Largest demand credit across all days for a SKU Pack Size in cases. Read-only. |
|
Demand Credit Total |
A read-only summation of all demand credits at the warehouse in units. |
|
Demand Credit Total in Cases |
A read-only summation of all demand credits at the warehouse in cases. |
|
Number of Order Alerts |
A read-only total of the number of SKU Group demand credit alerts triggered at a warehouse. |
|
Number of Overstock Alerts |
A read-only total of the number of SKU Group overstock alerts triggered at a warehouse. |
|
Number of Sales Forecast Alerts |
A read-only total of the number of SKU Group Sales Forecast alerts triggered at a warehouse. |
|
Number of Sales Alerts |
A read-only total of the number of SKU Group sales alerts triggered at a warehouse. |
|
Number of Stockless Alerts |
A read-only total of the number of SKU Group stockless alerts triggered at a warehouse. |
|
Sales Credit Max |
Largest sales credit across all days for a SKU group in a warehouse in units. Read-only. |
|
Sales Credit Max in Cases |
Largest sales credit across all days for a SKU group in a warehouse in cases. Read-only. |
|
Sales Credit Total |
A read-only summation of all sales credits at the warehouse in units. |
|
Sales Credit Total in Cases |
A read-only summation of all sales credits at the warehouse in cases. |
This step contains views that allow you to examine the warehouse replenishment plan. The available views are:
This view provides a company-wide view of inventory levels in the supply chain.
Table 7-26 lists the measures in this view.
Table 7-26 Measures: Company Level Inventory Analysis Interactive View
| Measure Label | Description |
|---|---|
|
Actual Weekly Sales |
Actual Weekly Sales represents the sum of actual sales data from stores aggregated to the SKU Group/Week level. |
|
Actual Weeks of Supply |
Actual Total Weeks of Supply represents weeks of supply for all locations (stores and warehouses). It is calculated by dividing Saleable Inventory by Total Avg Weekly Sales. |
|
Ad/Rollout Notes |
SKU Ad/Rollout Notes contains notes related to a product ad or rollout. |
|
Aggregated Store Ads |
Aggregated Store Ads indicates the presence of any active ads within the SKU Group/Week level. Aggregated Store Ads is True if at least one ad exists over the week for this SKU Group. |
|
Store Aggregated Demo Stock |
Store Aggregated Demo Stock represents the total demo stock over the week for this SKU Group. It is calculated as the sum of demo stock across all stores on the last day of the week (Saturday). |
|
Company URP by Week |
Company URP by Week is the Unconstrained Receipt Plan (URP) for a given SKU Group across the company for a given week. Unconstrained Receipt Plan (URP) is calculated as Store Receipt Plan (SKU/Store/Day) plus the Store Reconciliation Adjustment (SKU/Store/Day). The resulting URP values for each SKU/Store combination are then aggregated to a SKU Group/Company/Week level. |
|
End of Week Inventory - Cross Docks |
End of Week Inventory - Cross Docks represents the sum a SKU's Projected Inventory on the last day of the week at all warehouses with a warehouse type of Cross Docks. |
|
End of Week Inventory - Deconsolidation Centers |
End of Week Inventory - Deconsolidation Centers represents the sum of a SKU's Projected Inventory on the last day of the week at all warehouses with a warehouse type of Deconsolidation Center. |
|
End of Week Inventory - RDCs |
End of Week Inventory - RDCs represents the sum a SKU's Projected Inventory on the last day of the week at all warehouses with a warehouse type of RDC. |
|
Expected Receipts from Vendors |
Expected Receipts from Vendors shows the total inventory on order from vendors to warehouses and stores for any direct to store shipments. |
|
Receipt Plan - Vendor |
Receipt Plan - Vendor shows the total planned receipts from vendors to warehouses and stores for any direct to store shipments. |
|
Forecast to Sell-Through % |
Forecast to Sell-Through % contains the percentage of actual sales (historical weekly sales) to forecasted sales (forecasted demand at the week level). |
|
Forecasted Weekly Sales |
Forecasted Weekly Sales represents the total forecasted weekly sales (including customer orders) for a given SKU Group. |
|
Forecasted Weeks of Supply |
Forecasted Weeks of Supply represents the forecasted weeks of cover. It is calculated by dividing Saleable Inventory by Forecasted Avg Weekly Sales, where Forecasted Avg Weekly Sales is calculated as Forecasted Weekly Sales divided by the Number of Weeks Forecast. |
|
Sellable Inventory per Store |
Sellable Inventory per Store represents the average inventory level per store, excluding demo stock. It is calculated as the Saleable Inventory divided by the number of stores. |
|
Number of Stores |
Number of Stores represents the total number of stores for this SKU Group. |
|
Number of Weeks Forecast |
Number of Weeks Forecast represents the number of weeks in the future (including present week) over which Forecasted Avg Weekly Sales is calculated. |
|
Retail Price |
Retail Price is the product's retail price. Note: Retail Price is loaded from an external system. |
|
Saleable Inventory |
Saleable Inventory represents the amount of inventory that can actually be sold. It is calculated as the aggregated end of week projected inventory minus the aggregated end of week demo stock. |
|
Average Weekly Sales - RDC Total |
Average Weekly Sales - RDC Total contains the aggregated total of average weekly sales for an Regional Distribution Center (RDC) warehouse. |
|
Average Weekly Sales - Stores Total |
Average Weekly Sales - Stores Total contains the aggregation of an item's average weekly sales across all stores. |
|
Total Avg Weekly Sales |
Total Avg Weekly Sales contains the Sum of SKU of RDC Avg Weekly Sales and SKU Sum of Stores Avg Weekly Sales. |
|
Tracking Sales |
Tracking Sales estimates sales for the current week based on week-to-date sales. First, average daily sales is calculated by dividing the week-to-date sales by the number of days week-to-date (Sunday through the day prior to the current day). Next, the average daily sales are multiplied by seven, resulting in the SKU Tracking Sales. |
This view displays a filtered view of demand packsizes at the SKU Pack Size/Destination/Day level.
Table 7-27 lists the read-only measures in this view.
Table 7-27 Measures: Demand Packsize Details
| Measure Label | Description |
|---|---|
|
Total Forecast Demand |
Total Forecast Demand is the aggregated constrained demand from lower level supply-chain nodes sourced by the warehouse, plus external demand; it contains the value currently in the domain and will never change based on user input in the workbook. |
|
Unconstrained Total Forecast Demand |
Unconstrained Total Forecast Demand is the aggregated unconstrained demand from lower level supply-chain nodes sourced by the warehouse, plus external demand; it contains the value currently in the domain and will never change based on user input in the workbook. |
|
Warehouse Capped Demand |
Warehouse Capped Demand for a SKUPack/Destination /Day is calculated as defined in Conceptual Design document for Inventory Capping. The display measure is then aggregated for all SKUPacks within the SKUG for the Destination /Day. |
|
Warehouse Capped Demand – What-if |
The Warehouse Capped Demand – What-if is the What-if version of Warehouse Capped Demand. |
This view provides in-transit detail information at the SKU Group/Destination/Source/Day level.
Table 7-28 lists the measures in this view.
Table 7-28 Measures: In Transit Details Interactive View
| Measure Label | Description |
|---|---|
|
In Transit Details |
A read-only view of in transit orders in units aggregated to SKU group for a specific destination/source. |
|
In Transit Details in Cases |
A read-only view of in transit orders in cases aggregated to SKU group for a specific destination/source. |
|
On Order Details |
A read-only view of open orders in units aggregated to SKU group for a specific destination/source. |
|
On Order Details in Cases |
A read-only view of open orders in cases aggregated to SKU group for a specific destination/source. |
This view displays a filtered view of inventory packsizes at the SKU Pack Size/Destination/Day level.
These measures are read-only.
Table 7-29 lists the read-only measures in this view.
Table 7-29 Measures: Inventory Packsize Details
| Measure Label | Description |
|---|---|
|
Projected Inventory |
The Projected Inventory is the projected inventory calculated in the most recent AIP batch run. It includes any impacts due to scaling to Supplier Minimums and Container Minimums. This is calculated using the standard PI calculation where the Planned Receipts (PR) element represents scaled orders. |
|
Projected Inventory – Pre-Scaling |
The Projected Inventory – Pre-Scaling is the projected inventory calculated in the most recent AIP batch run prior to applying Supplier Minimums and Container Constraints. This is calculated using the standard PI calculation where the Planned Receipts (PR) element represents pre-scaling orders output from replenishment. |
|
Projected Inventory – What-if |
The Projected Inventory – What-if displays the Pre-scaling Projected Inventory calculated in the most recent AIP Batch run. If any changes are made to WRP parameters and you select What-if – Unconstrained or What-if – Constrained from the What-if option on the menu bar, this measure is updated with the newly calculated PI for the SKU/Warehouse. |
|
Warehouse Capped PI |
The Warehouse Capped PI is calculated using the standard PI equation: PIt = Max (PIt-1 + ERt-1 – Dmdt-1 + PRt-1 – ESt-1 – COt-1, 0) Where Dmdt = Capped Demand (demand based on CRPs into the destinations) for any day t PRt = Planned Receipts (Receipt Plan) at the warehouse for any day t Both Dmdt and PRt represent aggregate values at the SKUGroup level for all SKUPacks belonging to that SKU Group. |
|
Warehouse Capped PI – What-if |
The Warehouse Capped PI – What-if is the What-if version of Warehouse Capped PI. |
|
Warehouse Residual Excess Quantity |
The Warehouse Residual Excess Quantity is equal to any excess stock that was left at the end of day for which there were no locations available to receive excess stock (either because of inventory capping or no ATP days or for any other reason). After stockless processing for the day, this quantity can be calculated as follows: ResidualQty(t) = Max(PI(t) + ER(t) + CRP(t) – Dmd(t), 0) (essentially the PI calculation for day t+1) |
|
Warehouse Residual Excess Quantity – What-if |
The Warehouse Residual Excess Quantity – What-if is the What-if version of Warehouse Residual Excess Quantity. |
This view displays a filtered view of receipt packsizes at the SKU Pack Size/Destination/Day level.
These measures are read-only.
Table 7-30 lists the read-only measures in this view.
Table 7-30 Measures: Receipt Packsize Details
| Measure Label | Description |
|---|---|
|
Expected Receipts |
Expected Receipts uses historical expected receipts if prior to today; otherwise, the value represents on orders + in transits + placement. Value changes based on user input for Warehouse Stop Receiving Date in the workbook. |
|
Receipt Plan |
Receipt Plan represents the Final Constrained Receipt Plan calculated in the most recent batch run. The receipts include any impacts due to scaling to Supplier Minimums and Container Minimums. |
|
Receipt Plan – Pre-Scaling |
Receipt Plan – Pre-Scaling contains the Constrained Receipt Plan, calculated in the most recent batch run, prior to applying Supplier Minimums and Container Constraints. |
|
Receipt Plan – What-if |
Receipt Plan – What-if initially displays the Pre-scaling Constrained Receipt Plan calculated in the most recent AIP Batch run. If any changes are made to WRP parameters and you select What-if – Unconstrained or What-if – Constrained from the What-if option on the menu bar, this measure will be updated with the newly calculated CRP for the SKU/Warehouse. |
|
Original Total Planned Receipts |
Original Total Planned Receipts represents the original un-reconciled total planned receipts calculated in the most recent batch run. |
|
Original Total Planned Receipts – What-if |
Original Total Planned Receipts – What-if initially displays the un-reconciled total planned receipts calculated in the most recent AIP Batch run. If any changes are made to WRP parameters and you select What-if – Unconstrained or What-if – Constrained from the What-if option on the menu bar, this measure will be updated with the newly calculated URP for the SKU/Warehouse. |
This view provides management information related to items with fixed purchase quantities. Information is displayed at the SKU Group/Week level.
Table 7-31 lists the measures in this view.
Table 7-31 Measures: SPQ Analysis Interactive View
| Measure Label | Description |
|---|---|
|
Need Above Order Commit |
A read-only measure calculated as the Order Commit Quantity minus the aggregated unconstrained IRQ. |
|
Need Above Order Commit - What-if |
Read-only measure that initially displays the Need Above Order Commit calculated in the previous AIP Batch Run. If any changes are made to WRP parameters and you select What-if - Unconstrained or What-if - Constrained from the Quick Access toolbar, this measure will be updated with the newly calculated Need Above Order Commit. |
|
Remaining Order Commit Quantity |
The Remaining Order Commit Quantity represents the portion of an SPQ order still available in the current week. This measure is calculated by deducting any executed orders from the order commit quantity for that week. |
|
Remaining Order Commit Quantity - What-if |
Read-only measure that initially displays the Remaining Order Commit Quantity calculated in the previous AIP Batch Run. If any changes are made to WRP parameters and you select What-if - Unconstrained or What-if - Constrained from the Quick Access toolbar, this measure will be updated with the newly calculated Remaining Order Commit Quantity. |
|
SPQ Commitment Type (Expanded) |
The expanded read-only version of the SPQ Commitment Type measure that displays the actual value used in calculations. This is a merge of the global (Dept), default (Sub-class/Destination) and exception (SKU/Destination/Day) levels. |
|
SPQ Commitment Type Exception |
The SPQ Commitment Type is used whenever a Supplier Purchase Quantity (SPQ) has been entered for a SKU. The commitment type indicates how the SPQ should be interpreted. The options are Fixed or Capped. Fixed indicates that the user-specified SPQ quantity may not be exceeded, but it must be ordered in its entirety, regardless of whether there is demand for it. Capped indicates that the user-specified SPQ quantity may not be exceeded, but it need not be ordered if it is not required. Blank indicates that the SPQ will be ignored. |
|
SPQ Order Commit Quantity |
The SPQ Order Commit Quantity contains the Fixed or Capped Purchase Quantity agreed upon with the Vendor. |
|
Vendor Lock Period |
The Vendor Lock Period identifies which weeks are in the vendor lock period. The vendor lock period alerts you that there may be a vendor lock during this period. During this time period you would need to negotiate changes to the SPQ with the supplier. This indicator is for information purposes only and does not affect the replenishment plan calculations. |
|
Supplier Residual Excess Quantity |
Supplier Residual Excess Quantity would be equal to any excess stock that was left at the end of the week for which there were no locations available to receive excess stock (either as a result of inventory capping or no ATP days at suitable destinations. |
|
Supplier Residual Excess Quantity - What-if |
Read-only measure that initially displays the Residual Excess Quantity calculated in the previous AIP Batch Run. If any changes are made to WRP parameters and you select What-if - Unconstrained or What-if - Constrained from the Quick Access toolbar, this measure is updated with the newly calculated Supplier Residual Excess Quantity. |
This view shows Historical Supplier Orders at the SKU Pack Size/destination/source level.
Table 7-32 lists the measures in this view.
This view displays the WRP receipt plan and calculation parameters at the SKU Group/Warehouse/Day level. This view contains both:
Default Measures
Table 6-34 lists the measures in this view.
Table 7-33 Measures: WRP Receipt Plan by SKU Group Interactive View
| Measure Label | Description |
|---|---|
|
Available To Plan Receipt |
Boolean that indicates the days on which a warehouse may plan a receipt. This is a read-only measure and remains unchanged regardless of which other parameters are changed in the workbook. |
|
Delivery-day Demand Percent (expanded) |
The actual value used in calculations. This is a merge of the multiple levels of Delivery-day Demand Percent. |
|
Baseline Safety Stock % |
Percent of that days demand that is used for baseline Safety Stock. (Read only) |
|
Baseline Safety Stock % Override |
The Baseline Safety Stock % Override measure allows you to override the Baseline Safety Stock % input in the Additional Stock Maintenance Workbook. Any positive number, including zero, is valid. Example: To use 120% of that days demand that as baseline Safety Stock; then in the Override Percent, enter: 1.2. |
|
Baseline Safety Stock (Units) |
Baseline Safety Stock in units calculated from the baseline Safety Stock percent.(Read only) |
|
Baseline Safety Stock (Units) Override |
The Baseline Safety Stock (Units) Override measure allows you to override the Baseline Safety Stock (Units) input in the Additional Stock Maintenance Workbook.Any positive number, including zero, is valid. |
|
Closing Week Inventory |
When the workbook is built, it is crossed out until you roll up the calendar hierarchy to the week level. Provides you with a read-only projection of inventory at the close of business each Saturday night. This is based upon the projected inventory position of the following Sunday. |
|
Contingency Safety Stock % |
Percent of that days demand that is used for contingency Safety Stock. |
|
Contingency Safety Stock % Override |
The Contingency Safety Stock % Override measure allows you to override the Contingency Safety Stock % input in the Additional Stock Maintenance Workbook. Any positive number, including zero, is valid. Example: To use 120% of that days demand that as contingency Safety Stock; then in the Override Percent, enter: 1.2. |
|
Contingency Safety Stock (Units) |
Baseline Safety Stock in units calculated from the contingency Safety Stock percent.(Read only) |
|
Total Forecast Demand |
Aggregated constrained demand from lower level supply chain nodes sourced by the warehouse, plus external demand. This measure has a related filtered worksheet. See the Demand Packsize Details View for more information. |
|
Unconstrained Total Forecast Demand |
Aggregated unconstrained demand from lower level supply-chain nodes sourced by the warehouse, plus external demand. This measure has a related filtered worksheet. See the Demand Packsize Details View for more information. |
|
Demand Forecast History |
Demand Forecast History represents the forecast for the current day, calculated in the prior batch run. Demand Forecast History is used for contingency purposes, if for any reason current forecast data is not available.(Read only) |
|
Expected Receipts |
Read-only measure displaying the sum of On-orders, in-transits and placement quantities. This measure has a related filtered worksheet. See the Receipt Packsize Details View for more information. |
|
Unconstrained Forecast Demand Over Review Time |
Read-only measure that displays the demand summed over the review time. If the review time is zero, then the displayed value is zero. This value may change if the stop receiving date is updated. |
|
External Demand |
Demand on the warehouse that is generated outside of AIP. The warehouse is replenished for forecast demand and external demand. |
|
Unmet External Demand |
External demand that is not able to be met by the warehouse because of a warehouse shortage. |
|
Receipt Plan |
Read-only measure which represents the final Constrained Receipt Plan calculated in the most recent batch run. The receipts include any impacts due to Supplier and Container Scaling. This measure has a related filtered worksheet. See the Receipt Packsize Details View for more information. |
|
Receipt Plan-Pre-Scaling |
Read-only measure which contains the Constrained Receipt Plan, calculated in the most recent batch run, prior to applying Supplier and Container Scaling Constraints. |
|
Receipt Plan - What-if |
Read-only measure that initially displays the Constrained Receipt Plan (CRP) calculated in the most recent AIP Batch run. If any changes are made to WRP parameters and you select What-if - Unconstrained or What-if - Constrained from the Quick Access toolbar, this measure is updated with the newly calculated CRP for the SKU/Warehouse. What-if does not consider supplier and container scaling constraints. This measure has a related filtered worksheet. See the Receipt Packsize Details View for more information. |
|
Hold Back Option |
Read-only measure which indicates whether the hold back quantity should be considered when the batch determines if an order should be generated. Valid values are Reserve Holdback Quantity or Do Not Reserve Holdback Quantity. Reserve Holdback Quantity means that any user-specified Hold Back quantity should be deducted from the On Hand (Net Inventory) position. Do Not Reserve Holdback Quantity OH means that the On Hand (Net Inventory) calculation ignores any Hold Back quantity specified by you. |
|
Hold Back Quantity |
Read-only measure that represents a quantity of inventory to be held in reserve in the warehouse. The value current domain value is displayed and never changes based on user input in the workbook. |
|
Increment Percent (Expanded) |
The expanded read-only version of the Increment Percent measure that displays the actual value used in calculations. This is a merge of the global (Dept), default (Sub-class/Destination) and exception (SKU/Destination/Day) levels. |
|
Increment Percent Exception |
The Increment Percent acts as a multiplier for minimum and maximum stock that is designed to handle temporary fluctuation in demand for items using Min/Max Replenishment Method. An increment percentage factor can be used to temporarily increase or decrease targeted stocking levels without altering the established MIN and MAX values. Any positive number, including zero, is valid. Example: To use 120% of the Min and Max Stock, enter: 1.2. |
|
Inventory Selling Days (Expanded) |
The expanded read-only version of the Inventory Selling Days measure that displays the actual value used in calculations. This is a merge of the global (Dept), default (Sub-class/Destination) and exception (SKU/Destination/Day) levels. |
|
Inventory Selling Days Exception |
The number of days used to sum the forecasted demand for Dynamic and Hybrid replenishment method calculations. Inventory selling days can be used to ensure a minimum number of days of supply are included in the order. Any positive number is valid. Example: To account for three days of demand, enter: 3. |
|
Loaded Safety Stock History |
A read-only historical view of loaded Safety Stock. The value current domain value is displayed and never changes based on user input in the workbook. |
|
Maximum Safety Stock Days (Expanded) |
The expanded read-only version of the Maximum Safety Stock Days measure that displays the actual value used in calculations. This is a merge of the global (Dept), default (Sub-class/Destination) and exception (SKU/Destination/Day) levels. |
|
Maximum Safety Stock Days Exception |
The Maximum Safety Stock Days parameter is used to specify the maximum number of days of cover to be kept on hand as Safety Stock. If you enter both Max Safety Stock Days and Max Safety Stock Units, the Maximum Safety Stock boundary uses the larger of demand over Max Safety Stock Days and Max Safety Stock Units. Any positive integer, including zero, is valid. Example: To ensure the Maximum Safety Stock contains at least 14 days of supply; then in the Max Safety Stock Days, enter: 14. If Max Safety Stock Units is greater than 14 days of supply, max units would be used as the Maximum Safety Stock, otherwise Maximum Safety Stock would be the number of units required to cover 14 days of demand. |
|
Maximum Safety Stock Units (Expanded) |
The expanded read-only version of the Maximum Safety Stock Units measure that displays the actual value used in calculations. This is a merge of the global (Dept), default (Sub-class/Destination) and exception (SKU/Destination/Day) levels. |
|
Maximum Safety Stock Units Exception |
The Maximum Safety Stock Units parameter is used to specify the maximum amount of inventory (in units) to be kept on hand as Safety Stock. If you enter both Max Safety Stock Days and Max Safety Stock Units, the Maximum Safety Stock boundary uses the larger of demand over Max Safety Stock Days and Max Safety Stock Units. Any positive number, including zero, is valid. Example: To ensure the Maximum Safety Stock contains at least 14 days of supply; then in the Max Safety Stock Days, enter: 14. If Max Safety Stock Units is greater than 14 days of supply, max units would be used as the Maximum Safety Stock, otherwise Maximum Safety Stock would be the number of units required to cover 14 days of demand. |
|
Maximum Stock (Expanded) |
The expanded read-only version of the Maximum Safety measure that displays the actual value used in calculations. This is a merge of the global (Dept), default (Sub-class/Destination) and exception (SKU/Destination/Day) levels. |
|
Maximum Stock Exception |
Maximum Stock is only used in the Min/Max Replenishment Method. It represents the maximum stock level in units that are desired on hand to satisfy demand. The receipt plan quantity is calculated to bring Net Inventory up to the specified Maximum Stock level. Any positive number, including zero, is valid. Example: To set a maximum stock of 20 units, enter: 20. |
|
Maximum Time Supply Days (Expanded) |
The expanded read-only version of the Maximum Time Supply Days measure that displays the actual value used in calculations. This is a merge of the global (Dept), default (Sub-class/Destination) and exception (SKU/Destination/Day) levels. |
|
Maximum Time Supply Days Exception |
Maximum Time Supply Days is only used in the Time Supply Replenishment Method. It represents the maximum stock level in terms of a number of days cover that are desired on hand to satisfy demand. The receipt plan quantity is calculated to bring Net Inventory up to Maximum Time Supply Days of cover. Any positive integer, including zero, is valid. Example: To ensure an order brings the inventory level up to 14 days of supply; then in the Max Time Supply Days, enter: 14. |
|
Minimum Acceptable Safety Stock Threshold (Expanded) |
The expanded read-only version of the Acceptable Safety Stock Threshold measure that displays the actual value used in calculations. This is a merge of the global (Dept), default (Sub-class/Destination) and exception (SKU/Destination/Day) levels. |
|
Minimum Acceptable Safety Stock Threshold Exception |
This parameter indicates the percentage of Safety Stock that must be protected when rounding the Ideal Receipt Quantity (IRQ) to an order multiple. The IRQ cannot be rounded down if doing so results in less than the specified percentage of Safety Stock being ordered. Any positive number, including zero, is valid. Example: To protect 40% of Safety Stock, enter: 0.4. |
|
Minimum Safety Stock Days (Expanded) |
The expanded read-only version of the Minimum Safety Stock Days measure that displays the actual value used in calculations. This is a merge of the global (Dept), default (Sub-class/Destination) and exception (SKU/Destination/Day) levels. |
|
Minimum Safety Stock Days Exception |
The Minimum Safety Stock Days parameter is used to specify the minimum number of days of cover to be kept on hand as Safety Stock. If you enter both Min Safety Stock Days and Min Safety Stock Units, the Minimum Safety Stock boundary uses the larger of demand over Min Safety Stock Days and Min Safety Stock Units. Any positive integer, including zero, is valid. Example: To ensure the Minimum Safety Stock contains at least seven days of supply; then in the Min Safety Stock Days, enter: 7. If Min Safety Stock Units is greater than seven days of supply, min units would be used as the Minimum Safety Stock, otherwise Minimum Safety Stock would be the number of units required to cover seven days of demand. |
|
Minimum Safety Stock Units (Expanded) |
The expanded read-only version of the Minimum Safety Stock Units measure that displays the actual value used in calculations. This is a merge of the global (Dept), default (Sub-class/Destination) and exception (SKU/Destination/Day) levels. |
|
Minimum Safety Stock Units Exception |
The Minimum Safety Stock Units parameter is used to specify the minimum amount of inventory to be kept on hand as Safety Stock. If you enter both Min Safety Stock Days and Min Safety Stock Units, the Minimum Safety Stock boundary uses the larger of demand over Min Safety Stock Days and Min Safety Stock Units. Any positive number, including zero, is valid. Example: To ensure the Minimum Safety Stock contains at least seven days of supply; then in the Min Safety Stock Days, enter: 7. If Min Safety Stock Units is greater than seven days of supply, min units would be used as the Minimum Safety Stock, otherwise Minimum Safety Stock would be the number of units required to cover seven days of demand. |
|
Minimum Stock (Expanded) |
The expanded read-only version of the Minimum Stock measure that displays the actual value used in calculations. This is a merge of the global (Dept), default (Sub-class/Destination) and exception (SKU/Destination/Day) levels. |
|
Minimum Stock Exception |
Minimum Stock is only used in the Min/Max Replenishment Method. It represents the minimum stock level in units that are desired on hand to satisfy demand. Min Stock is used in determining the inventory level at which a replenishment is triggered. Any positive number, including zero, is valid. Example: To set a minimum stock level of five days; then enter: 5. |
|
Minimum Time Supply Days (Expanded) |
The expanded read-only version of the Minimum Time Supply Days measure that displays the actual value used in calculations. This is a merge of the global (Dept), default (Sub-class/Destination) and exception (SKU/Destination/Day) levels. |
|
Minimum Time Supply Days Exception |
Minimum Time Supply Days is only used in the Time Supply Replenishment Method. It represents minimum stock level in terms of number of days cover that are desired on hand to satisfy demand. Min Time Supply Days of cover is used in both Safety Stock and RP calculations. Any positive number, including zero, is valid Example: To set a minimum stock level of five days; then enter: 5. |
|
Numeric Actively Replenished |
Read-only measure that indicates the total number of active stores source from this warehouse for this SKU/day. |
|
Original Total Planned Receipts |
Read-only measure that represents the original un-reconciled total planned receipts. This measure has a related filtered worksheet. See the Receipt Packsize Details View for more information. |
|
Original Total Planned Receipts - What-if |
Read-only measure that initially displays the un-reconciled, un-scaled total planned receipts (URP) calculated in the most recent AIP Batch run. If any changes are made to WRP parameters and you select What-if - Unconstrained or What-if - Constrained from the Quick Access toolbar, this measure is updated with the newly calculated URP for the SKU/Warehouse. This measure has a related filtered worksheet. See the Receipt Packsize Details View for more information. |
|
Projected Days of Supply On Hand At Stores (at Stocking Point) |
Read-only measure that displays a projection of the number of days of inventory on hand at stores that are supplied by the current warehouse. This number is determined by taking the summed projected inventory of the stores and dividing it by the summed average rate of sale. The calculated value changes based on the calculation of Stores Projected Inventory. |
|
Projected Inventory |
The Projected Inventory (PI) is calculated in batch and represents a projection of the opening inventory position for any day in the planning horizon at a specific warehouse. None of that day's activities (either receipts or demand) are reflected in PI, and so it is often referred to as a beginning of day position. PI on a given day is calculated as the PI of the previous day plus the net impact of all forecasted demand and expected and planned receipts on the previous day. The planned receipts include scaled purchase orders. This read-only measure displays the PI calculated in the most recent AIP Batch run. This measure has a related filtered worksheet. See the Inventory Packsize Details View for more information. |
|
Projected Inventory - Pre-Scaling |
The Projected Inventory (PI) is calculated in batch and represents a projection of the opening inventory position for any day in the planning horizon at a specific warehouse. None of that day's activities (either receipts or demand) are reflected in PI, and so it is often referred to as a beginning of day position.PI on a given day is calculated as the PI of the previous day plus the net impact of all forecasted demand and expected and planned receipts on the previous day. The planned receipts are pre-scaling receipt quantities. This read-only measure displays the pre-scaling PI calculated in the most recent AIP Batch run. This measure has a related filtered worksheet. See the Inventory Packsize Details View for more information. |
|
Projected Inventory - What-if |
Read-only measure that initially displays the Projected Inventory (PI) calculated in the most recent AIP Batch run. If any changes are made to WRP parameters and you select What-if - Unconstrained or What-if - Constrained from the Quick Access toolbar, this measure is updated with the newly calculated PI for the SKU/Warehouse. What-if does not consider supplier and container scaling constraints. This measure has a related filtered worksheet. See the Inventory Packsize Details View for more information. |
|
Receipt Point |
The Warehouse Receipt Point (RP) represents the inventory level below which an order should be triggered. Its calculation depends upon the selected Replenishment Method. The RP is only calculated on Available to Plan receipt days. This read-only measure displays the RP calculated in the most recent AIP Batch run. |
|
Receipt Point - What-if |
Read-only measure that initially displays the Receipt Point (RP) calculated in the previous AIP Batch run. If any changes are made to WRP parameters and you select What-if - Unconstrained or What-if - Constrained from the Quick Access toolbar, this measure is updated with the newly calculated RP for the SKU/Warehouse. |
|
Receive Up to Level |
The warehouse Receive Up to Level (RUTL) represents the target inventory level when an order is generated. Its calculation depends upon the selected Replenishment Method. RUTL is only calculated on Available to Plan receipt days. |
|
Receive Up to Level - What-if |
Read-only measure that initially displays the Receive Up to Level calculated in the most recent AIP Batch run. If any changes are made to WRP parameters and you select What-if - Unconstrained or What-if - Constrained from the Quick Access toolbar, this measure is updated with the newly calculated RUTL for the SKU/Warehouse. |
|
Reconciliation Adjustment |
A read-only measure indicating the difference between the Constrained Receipt Plan and the Unconstrained Receipt Plan. |
|
Reconciliation Adjustment - What-if |
Read-only measure that initially displays the Reconciliation Adjustment calculated in the previous AIP Batch run. If any changes are made to WRP parameters and you select What-if - Constrained from the Quick Access toolbar, this measure is updated with the newly calculated Reconciliation Adjustment for the SKU/Warehouse. If you select What-if - Unconstrained, this measure should be set to zero. |
|
Replenishment Method (Expanded) |
The expanded read-only version of the Replenishment Method measure that displays the actual value used in calculations. This is a merge of the global (Dept), default (Sub-class/Destination) and exception (SKU/Destination/Day) levels. |
|
Replenishment Method Exception |
The choice of Replenishment Method determines the type of calculations that is used in generating a warehouse replenishment plan. Blank indicates the system preset value of No Replenishment. You select the Replenishment Method from the following options:
|
|
Review Time |
This read-only measure is only populated for days that are available to plan. It indicates the number of days between the point that a delivery on the current ATP days can be used to satisfy demand and the point at which a delivery on the next ATP day becomes available to meet demand. This period of time identifies the number of days that are the exclusive responsibility of the current ATP day. |
|
Round Up Threshold (Expanded) |
The expanded read-only version of the Round Up Threshold measure that displays the actual value used in calculations. This is a merge of the global (Dept), default (Sub-class/Destination) and exception (SKU/Destination/Day) levels. |
|
Round Up Threshold Exception |
The Rounding Threshold represents the percentage of the last order multiple above which the Ideal Replenishment Quantity is rounded up and below which it is rounded down. Valid values are zero (0) through one (1). Example: To round up when the remaining part of the IRQ is more than 25 percent of an order multiple, then in the Rounding Threshold, enter: 0.25. |
|
Safety Stock |
Safety Stock (SS) is inventory held at a location to mitigate the risks of stock outs caused by variability in forecasted demand. The calculated to determine Safety stock is dependent upon the selected Replenishment Method. All replenishment methods allow the SS to be bound by minimum and maximum values. Store SS is only calculated on Available to Plan receipt days and is read-only. |
|
Safety Stock - What-if |
Read-only measure that initially displays the Safety Stock calculated in the previous AIP Batch run. If any changes are made to WRP parameters and you select What-if - Unconstrained or What-if - Constrained from the Quick Access toolbar, this measure is updated with the newly calculated SS for the SKU/Warehouse. |
|
Service Level (Expanded) |
The expanded read-only version of the Service Level measure that displays the actual value used in calculations. This is a merge of the global (Dept), default (Sub-class/Destination) and exception (SKU/Destination/Day) levels. |
|
Service Level Exception |
Service Level is used in the SS calculations for the Dynamic Replenishment method. It is defined as the percentage of unit demand that should be met by inventory. Valid values are zero (0) through one (1). Example: To carry enough SS to maintain a 90% customer service level, then in the Service Level Exception, enter: 0.90. |
|
Source Order Multiple |
Read-only measure that displays the order multiple used when placing orders on the source. This measure cannot be impacted through changes made by you in the workbook. |
|
Stores Projected Inventory |
Represents the read-only summation of projected inventory of all stores sourced from the warehouse. This value changes due to parameter changes made by you. |
|
Time Supply Horizon (Expanded) |
The expanded read-only version of the Time Supply Horizon measure that displays the actual value used in calculations. This is a merge of the global (Dept), default (Sub-class/Destination) and exception (SKU/Destination/Day) levels. |
|
Time Supply Horizon Exception |
The Time Supply Horizon parameter is only used in the Time Supply Replenishment method. If a time supply horizon is specified, the rate of sale is used instead of the actual forecast when calculating demand over the time supply days for inventory target level calculations. Any positive integer is valid. Example: To calculate a Rate of Sale (ROS) over a one week period; then in the Time Supply Horizon, enter: 7. The ROS is then calculated by summing the forecasted sales over the seven days and dividing that number by seven. |
|
Total ARS |
A read-only summation of Average Rate of Sale (ARS) for stores source from this warehouse plus Warehouse Independent ARS. |
|
Total Store Average Rate of Sales |
A read-only summation of Average Rate of Sale (ARS) for stores source from this warehouse. |
|
Warehouse AWS Factor (Expanded) |
The expanded read-only version of the Warehouse AWS Factor measure that displays the actual value used in calculations. This is a merge of the global (Dept), default (Sub-class/Destination) and exception (SKU/Destination/Day) levels. |
|
Warehouse AWS Factor Exception |
Used only in the Average Weekly Sales (AWS) Replenishment Method, this factor is multiplied by the AWS to produce target stock levels. Any positive value is valid. Example: To multiple the ARS by a factor of two, enter: 2. |
|
Warehouse Maximum (Expanded) |
The expanded read-only version of the Warehouse Maximum measure that displays the actual value used in calculations. This is a merge of the global (Dept), default (Sub-class/Destination) and exception (SKU/Destination/Day) levels. |
|
Warehouse Maximum Exception |
This represents the Maximum SS boundary for the Loaded SS, Sales Week Range, Factor ARS and Factor AWS Replenishment methods. Any positive value is valid. Example: To set a Maximum SS boundary of six units, enter: 6. |
|
Warehouse Minimum (Expanded) |
The expanded read-only version of the Warehouse Minimum measure that displays the actual value used in calculations. This is a merge of the global (Dept), default (Sub-class/Destination) and exception (SKU/Destination/Day) levels. |
|
Warehouse Minimum Exception |
This represents the Minimum SS Boundary for the Loaded SS, Sales Week Range, Factor ARS and Factor AWS Replenishment methods. Any positive value, including zero, is valid. Example: To set a Minimum SS boundary of two units, enter: 2. |
|
Warehouse Net Inventory |
Warehouse Net Inventory (NI) is calculated in batch and is a prediction of the inventory position at the end of review time. It represents what inventory is available to meet demand over the period. The NI calculation is based on the Projected Inventory position, which includes scaled receipts, at the beginning of the period. It then considers the impact of Expected Receipts (ER) and Expected Spoilage (ES) over the review time. Warehouse Net Inventory is only calculated on Available to Plan receipt days, and is compared to the Receipt Point Boundary in order to establish if a receipt is required. Important: While it is possible to rollup Net Inventory across the time dimension, it is not recommended. Aggregation over time does not produce a meaningful result since the calculation of Net Inventory involves the summation of data over review times which do not correlate with positions in the calendar hierarchy. |
|
Warehouse Net Inventory - Pre-scaling |
Warehouse Net Inventory (NI) is calculated in batch and is a prediction of the inventory position, before the affects of scaling, at the end of review time. It represents what inventory is available to meet demand over the period. The NI calculation is based on the Pre-Scaling Projected Inventory position at the beginning of the period, then considering the impact of Expected Receipts (ER) and Expected Spoilage (ES) over the review time. Warehouse Net Inventory is only calculated on Available to Plan receipt days, and is compared to the Receipt Point Boundary in order to establish if a receipt is required. Important: While it is possible to rollup Net Inventory across the time dimension, it is not recommended. Aggregation over time does not produce a meaningful result since the calculation of Net Inventory involves the summation of data over review times which do not correlate with positions in the calendar hierarchy. |
|
Warehouse Net Inventory - What-if |
Read-only measure that initially displays the Warehouse Net Inventory calculated in the most recent AIP Batch run. If any changes are made to WRP parameters and you select What-if - Unconstrained or What-if - Constrained from the Quick Access toolbar, this measure is updated with the newly calculated NI for the SKU/Warehouse. What-if does not consider supplier and container scaling constraints. Important: While it is possible to rollup Net Inventory across the time dimension, it is not recommended. Aggregation over time does not produce a meaningful result since the calculation of Net Inventory involves the summation of data over review times which do not correlate with positions in the calendar hierarchy. |
|
WH Independent ARS |
A read-only measure indicating the externally loaded Average Rate of Sale (ARS) assigned to the warehouse. This is independent of any ARS summed from the store level. |
Hidden Measures
Table 6-35 lists the measures in this view that are hidden when using the default template. They can be displayed and maintained by using the Insert measure function of RPAS. Hidden measures may also be added to the template during configuration.
Table 7-34 Hidden Measures: WRP Receipt Plan by SKU Group Interactive View
| Measure Label | Description |
|---|---|
|
Warehouse Capped Demand |
Warehouse Capped Demand is displayed at the SKU Group level and is calculated by aggregating the Warehouse Capped Demand at SKU-pack/Destination /Day level for all SKU-packs in a SKU Group. This measure has a related filtered worksheet. See the Demand Packsize Details View for more information. |
|
Warehouse Capped PI |
Warehouse Capped PI is calculated using the standard PI equation: PIt = Max (PIt-1 + ERt-1 - Dmdt-1 + PRt-1 - ESt-1 - COt-1, 0) Where Dmdt = Capped Demand (demand based on CRPs into the destinations) for any day t PRt = Planned Receipts (Receipt Plan) at the warehouse for any day t Both Dmdt and PRt would represent aggregate values at the SKUGroup level for all SKU-packs belonging to that SKU Group. This measure has a related filtered worksheet. See the Inventory Packsize Details View for more information. |
|
Warehouse Capped PI - What-if |
Warehouse Capped PI - What-if is a read-only measure that represents the projected inventory using the demand adjusted by SKU caps at the store. If any changes are made to WRP parameters and you select What-if - Unconstrained or What-if - Constrained from the What-if option on the menu bar, this measure is updated with the newly calculated Capped PI for the SKU/Warehouse. This measure has a related filtered worksheet. See the Inventory Packsize Details View for more information. |
|
Warehouse Demand(Capped) Difference |
Warehouse Demand (Capped) Difference is equal to Warehouse Non-Capped Demand at SKUG/Destination /Day - Warehouse Demand SKUG/Destination /Day. |
|
Warehouse Residual Excess Qty (Stockless) |
Warehouse Residual Quantity is equal to any excess stock that was left at the end of day for which there were no locations available to receive excess stock, either because of inventory capping, because there are no ATP days, or for any other reason. After stockless processing for the day, this quantity can be calculated as follows: ResidualQty(t) = Max(PI(t) + ER(t) + CRP(t) - Dmd(t), 0) (essentially the PI calculation for day t+1) This measure has a related filtered worksheet. See the Inventory Packsize Details View for more information. |
|
Warehouse Residual Excess Qty - What-if |
The Warehouse Residual Excess Quantity - What-if is the resultant value after What-if calculations have been run on the Warehouse Residual Excess Quantity measure. This measure has a related filtered worksheet. See the Inventory Packsize Details View for more information. |
|
Supplier Compliance Safety Stock Uplift |
Supplier Compliance Safety Stock Uplift represents the amount in units of additional that should be carried to account for poor Supplier Delivery Performance.(Read only) |
This view displays the WRP receipt plan and calculation parameters at the SKU Pack Size/Destination/Source/Day Level.
Table 7-35 lists the measures in this view.
Table 7-35 Measures: WRP Receipt Plan by SKU Pack Size Interactive View
| Measure Label | Description |
|---|---|
|
Lead Time |
This measure is the final lead time calculated based on multiple inputs in DM Online. This measure cannot be impacted through changes made by you in the workbook.(Read only) |
|
Receipt Plan |
This read-only measure represents the receipt plan. This plan is constrained (by the shortfall reconciliation process) through the fixed period and then unconstrained for the remainder of the planning horizon. |
|
Receipt Plan - What-if |
Read-only measure that initially displays the Receipt Plan calculated in the previous AIP Batch run. If any changes are made to WRP parameters and you select What-if - Unconstrained or What-if - Constrained from the Quick Access toolbar, this measure is updated with the newly calculated Receipt Plan for the SKU Pack-size/Warehouse. |
|
Source Order Multiple |
Read-only measure that displays the order multiple used when placing orders on the source. This measure cannot be impacted through changes made by you in the workbook. |
|
Source Splits (Expanded) |
Read-only measure that displays the target percentage of the warehouses need for the SKU Pack Size that should be satisfied by the source. |
|
Unconstrained Receipt Plan |
This read-only measure represents the receipt plan, unconstrained throughout the entire planning horizon. |
|
Unconstrained Receipt Plan - What-if |
Read-only measure that initially displays the Unconstrained Receipt Plan calculated in the previous AIP Batch run. If any changes are made to WRP parameters and you select What-if - Unconstrained or What-if - Constrained from the Quick Access toolbar, this measure is updated with the newly calculated Unconstrained Receipt Plan for the SKU Pack-size/Warehouse. |
|
Warehouse Orderable Unit |
This read-only measure displays the SKU Pack Size that should be used when ordered from the source into the destination on that day. |
|
Warehouse Source |
This read-only Boolean measure indicates whether the source can deliver the SKU Pack Size into the destination on that day. |
This step contains views that allow you to examine the warehouse replenishment plan. The available views are:
WRP Replenishment Parameters by SKU Group Warehouse Interactive View
WRP Replenishment Parameters by Week By SKU Group Interactive View
This view aids you in identifying Promotional SKUs at the SKU Group/Warehouse level.
Table 7-36 lists the measure in this view.
This view allows you to review store event replenishment plan information at the (SKU/Store/Day) level.
Table 7-37 lists the measures in this view.
Table 7-37 Measures: Store Event Replenishment Parameters View
| Measure Label | Description |
|---|---|
|
Event AWS Factor – Store |
The Event AWS Factor – Store is used in the Factor AWS Repl Method |
|
Event Boundary Stock – Store |
The Event Boundary Stock – Store is used in the Factor AWS, Sales Week Range, and Loaded SS Dynamic Repl Methods |
|
Event Demo Stock – Store |
The Event Demo Stock – Store is used in the RP and RUTL calculations |
|
Event Increment Percent – Store |
The Event Increment Percent – Store is used in the Min/Max Repl Method |
|
Event Inventory Selling Days – Store |
The Event Inventory Selling Days – Store is used in the Hybrid, Poisson, Dynamic and Loaded SS Dynamic Repl Methods |
|
Event Max Safety Stock Days – Store |
The Event Max Safety Stock Days – Store is used in the Minimum Safety Stock Boundaries calculation |
|
Event Max Safety Stock Units – Store |
The Event Max Safety Stock Units – Store is used in the Minimum Safety Stock Boundaries calculation |
|
Event Max Stock – Store |
The Event Max Stock – Store is used in the Min/Max Repl Method |
|
Event Max Time Supply Days – Store |
The Event Max Time Supply Days – Store is used in the Time Supply Repl Method |
|
Event Min Safety Stock Days – Store |
The Event Min Safety Stock Days – Store is used in the Minimum Safety Stock Boundaries calculation |
|
Event Min Safety Stock Units – Store |
The Event Min Safety Stock Units – Store is used in the Minimum Safety Stock Boundaries calculation |
|
Event Min Stock – Store |
The Event Min Stock – Store is used in the Min/Max Repl Method |
|
Event Min Time Supply Days – Store |
The Event Min Time Supply Days – Store is used in the Time Supply Repl Method |
|
Event MSQ Constraint Indicator – Store |
Event MSQ Constraint Indicator – Store indicates when the MSQ should be removed from ordering decisions. If the indicator is On, MSQ will be used as a constraint. |
|
Event Percent of Pallet – Store |
The Event Min Stock – Store is used in Pallet Rounding |
|
Event Replenishment Method - Store |
Event-specific measure at the SKU/Store/Day level. The Replenishment Method determines the type of calculations that are used in generating a store replenishment plan. The default is No Replenishment. |
|
Event Rounding Method – Store |
The Event Rounding Method – Store calculates in Data Management for Singles and can be updated at the default and exception level in SRP. |
|
Event Rounding Threshold – Store |
The Event Rounding Threshold – Store is used in the IRQ calculation |
|
Event Safety Stock Level Factor – Store |
The Event Safety Stock Level Factor – Store is used in the Time Supply, Hybrid, Poisson, Dynamic and Loaded SS Dynamic Repl Methods. If a 0 is desired, a small fraction must be entered. |
|
Event Service Level – Store |
The Event Service Level – Store is used in the in Dynamic Repl Method. |
|
Event Shelf Capacity – Store |
Event-specific measure at the SKU/Store/Day level. Shelf Capacity is the amount of stock in units to fill a shelf to the desired maximum level. |
|
Event Shelf Capacity Flag - Store |
The Event Shelf Capacity Flag - Store is used in the RP and RUTL calculations |
|
Event Time Supply Horizon - Store |
The Event Time Supply Horizon - Store is used in the Time Supply Repl Method |
|
Event Weekly Sales Max – Store |
The Event Weekly Sales Max – Store is used in the Factor AWS, Sales Week Range, and Loaded SS Dynamic Repl Methods |
|
Event Weekly Sales Min – Store |
The Event Weekly Sales Min – Store is used in the Factor AWS, Sales Week Range, and Loaded SS Dynamic Repl Methods |
Hidden Measures
Table 7-38 lists the measures in this view that are hidden when using the default template. They can be displayed and maintained by using the Insert measure function of RPAS. Hidden measures may also be added to the template during configuration.
Table 7-38 Hidden Measures: Store Event Replenishment Parameters View
| Measure Label | Description |
|---|---|
|
Event Acceptable Loss – Store |
The Event Acceptable Loss – Store is used in the Expected Spoilage calculation If you edit this measure on this worksheet:
|
|
Event Spoilage Threshold - Store |
The Event Spoilage Threshold - Store is used in theExpected Spoilage calculation If you edit this measure on this worksheet:
|
This view allows you to view store presentation stock calculations at the (SKU/Store/Day) level.
Table 7-39 lists the measures in this view.
Table 7-39 Measures: Store Presentation Stock Calculations (SKU/Store/Day) View
| Measure Label | Description |
|---|---|
|
Promotion Presentation Stock Pre Factor - Store |
The Promotion Presentation Stock Pre Factor - Store represents the specified quantity for Store Promotion Presentation Stock before application of the End of Store Promotion Factor. |
|
Promotion Presentation Stock – end of promo factor (expanded) |
The Promotion Presentation Stock – end of promo factor (expanded) displays a factor of 1 for the days within the promotion period prior to the ramp down and will then show the designated End of Promotion Factor values as it approaches the end of the promotion. A factor of 1 will be displayed after the promotion has ended. |
|
Promotion Presentation Stock Override Flag (expanded) – Store |
The expanded version of Store Promotion Presentation Stock Override Flag displays the actual value used in the calculations. This is the merge of exception level (SKU/Store/Day), default level (Sub-class/Store format), and global level (Dept) values entered. |
|
Store Promotion Presentation Stock |
The Store Promotion Presentation Stock calculates at sku/str/day which represents the End of Store Promotion Factor applied to the Base Store Promotion Presentation Stock. If the Store Promotion Presentation Stock Override Flag is turned on, this becomes equal to 0. |
|
Weekly Base Sales Forecast – Store |
The Weekly Base Sales Forecast – Store is the Day level representation of the weekly base sales forecast. This is calculated by replicating the value from Loaded Weekly Base Sales Forecast to sku/str/day. |
|
Weekly Base Sales Forecast % (expanded) - Store |
The expanded version of Store Weekly Base Sales Forecast displays the actual value used in calculations. This represents the merge of the global default, default and exception level versions of Store Weekly Base Sales Forecast. 0 represents 0% of the forecast to be used and 1 will indicate to use 100% of the forecast. |
|
Min Presentation Stock (expanded) - Store |
The expanded version of Store Minimum Presentation Stock displays the actual value used in calculations. This represents the merge of the global default, default and exception level versions of Store Minimum Presentation Stock. |
|
Calculated Presentation Stock - Store |
The Calculated Presentation Stock - Store represents the max(Weekly Base Sales Forecast x Weekly Base Sales Forecast %, Store Minimum Presentation Stock). If the Calculated Store Presentation Stock Indicator is turned off, this value is 0. |
|
Presentation Stock Override Flag (expanded) – Store |
The expanded version of Store Presentation Stock Override Flag displays the actual value used in calculations. This represents the merge of the global default, default and exception level versions of Store Presentation Stock Override Flag. |
|
Presentation Stock Override Quantity (expanded) – Store |
The expanded version of Store Presentation Stock Override Quantity which displays the actual value used in calculations. This represents the merge of the global default, default and exception level versions of Store Presentation Stock Override Quantity. |
|
User Specified Presentation Stock (expanded) - Store |
The expanded version of User Specified Store Presentation Stock displays the actual value used in the calculations. This is the merge of exception level (SKU/Store/Day), default level (Sub-class/Store format), and global level (Dept) values entered |
|
Total Presentation Stock - Store |
The Total Presentation Stock - Store represents the max when the Store Presentation Stock Override Flag is selected. |
This view displays WRP replenishment parameters at the SKU Group/Warehouse level.
Table 7-40 lists the measures in this view.
Table 7-40 Measures: WRP Replenishment Parameters by SKU Group Warehouse Interactive View
| Measure Label | Description |
|---|---|
|
Loaded Safety Stock |
A read-only historical view of loaded Safety Stock. The value current domain value is displayed and never changes based on user input in the workbook. |
|
Replenishment Subtype Code |
A read-only measure loaded from an external system containing user defined replenishment sub-type codes. |
|
Replenishment Type Code |
A read-only measure loaded from an external system containing user defined replenishment type codes. |
|
Warehouse End Date Range Exception |
This End date dictates the end of the time period used to establish demand in the Sales Week Range and Factor AWS Replenishment methods. A pop-up calendar can be used to select the desired end date. Any date prior to the current day is valid. |
|
Warehouse End Date Range (Expanded) |
The expanded read-only version of the Warehouse End Date measure that displays the actual value used in calculations. This is a merge of the global (Dept), default (Sub-class/Destination) and exception (SKU/Destination) levels. |
|
Warehouse Start Date Range Exception |
This Start date dictates the beginning of the time period used to establish demand in the Sales Week Range and Factor AWS Replenishment methods. A pop-up calendar can be used to select the desired start date. Any date prior to the current day is valid. |
|
Warehouse Start Date Range (Expanded) |
The expanded read-only version of the Warehouse Start Date measure that displays the actual value used in calculations. This is a merge of the global (Dept), default (Sub-class/Destination) and exception (SKU/Destination) levels. |
|
Warehouse Stop Receiving Date |
If specified, this indicates the date on and after which no receipts can take place at the warehouse. The receipt plan is zero on and after this date. A pop-up calendar can be used to select the desired date. Any date after today is valid. |
|
WRP Sales Forecast Detailed Alert |
A read-only measure indicating a Sales Forecast alert exists for this SKU Pack Size on this warehouse/day. |
This view displays information pertaining to Sister Warehouse functionality. This view is at the destination level.
Table 6-39 lists the measures in this view.
Table 7-41 Measures: WRP Replenishment Parameters by Warehouse Interactive View
| Measure Label | Description |
|---|---|
|
Sister Warehouse |
Defines a sister-warehouse association. Replenishment parameters and sales history is copied from this location. This relationship is maintained in RMS. |
|
Sister Warehouse Parameters Flag |
This flag indicates that all replenishment parameters have been copied from the sister warehouse to this location. |
|
Warehouse Open Date |
Warehouse Independent ARS from the sister warehouse is copied to the new warehouse from the copy date until the new warehouse reaches its opening date. All other parameters are copied from the sister warehouse to the new warehouse beginning from the open date onward. |
This view displays WRP replenishment parameters at the SKU Group/Warehouse/Week level.
Table 6-40 lists the measures in this view.
Table 7-42 Measures: WRP Replenishment Parameters By Week By SKU Group Interactive View
| Measure Label | Description |
|---|---|
|
Warehouse ARS Factor Exception |
Used only in the Average Weekly Sales (AWS) Replenishment Method, this factor is multiplied by the AWS to produce target stock levels. Any positive value is valid. Example: To multiple the ARS by a factor of two; then in the Warehouse ARS Factor Exception, enter: 2. |
|
Warehouse ARS Factor (Expanded) |
The expanded read-only version of the ARS Factor measure that displays the actual value used in calculations. This is a merge of the global (Dept), default (Sub-class/Destination/Week) and exception (SKU/Destination/Week) levels. |
|
Warehouse Roll Weeks Exception |
This parameter specifically relates to the interpretation of the date range specified by you to establish demand in the Sales Week Range and Factor AWS Replenishment methods. If the parameter is set to False, then the date range specified by you remains static and does not change as the replenishment process progresses through the planning horizon. If the parameter is set to True, then the date range is migrated forward a week for each new week encountered in the planning horizon. Valid values are zero for False and one for True. |
|
Warehouse Roll Weeks (Expanded) |
The expanded read-only version of the Warehouse Roll Weeks measure that displays the actual value used in calculations. This is a merge of the global (Dept), default (Sub-class/Destination/Week) and exception (SKU/Destination/Week) levels. |
This view displays warehouse replenishment parameters at the SKU Group/Destination/Source/Day level.
Table 6-41 lists the measures in this view.
Table 7-43 Measures: WRP Temporarily Un-Orderable Interactive View
| Measure Label | Description |
|---|---|
|
Temporary Un-orderable Unit |
A Boolean measure indicating whether the orderable unit is unavailable from the source on that day. You should set this to True if the orderable unit is not available form the source on the day. |
|
Warehouse Orderable Unit |
This read-only measure displays the SKU Pack Size that should be used when ordered from the source into the destination on that day. |
This task allows you to perform overnight replenishment.
Use the Network Replenishment Interactive Evaluation workbook to perform the step for this task. See "Network Replenishment Workbook".
This step helps you achieve this task:
This step contains views that allow you to examine the store and warehouse replenishment plan. The available views are:
This view displays a filtered view of demand packsizes at the SKU Pack Size/Destination/Day level.
Table 7-44 lists the read-only measures in this view.
Table 7-44 Measures: Demand Packsize Details
| Measure Label | Description |
|---|---|
|
Total Forecast Demand |
Total Forecast Demand is the aggregated constrained demand from lower level supply-chain nodes sourced by the warehouse, plus external demand; it contains the value currently in the domain and will never change based on user input in the workbook. |
|
Unconstrained Total Forecast Demand |
Unconstrained Total Forecast Demand is the aggregated unconstrained demand from lower level supply-chain nodes sourced by the warehouse, plus external demand; it contains the value currently in the domain and will never change based on user input in the workbook. |
|
Warehouse Capped Demand |
Warehouse Capped Demand for a SKUPack/Destination /Day is calculated as defined in Conceptual Design document for Inventory Capping. The display measure is then aggregated for all SKUPacks within the SKUG for the Destination /Day. |
|
Warehouse Capped Demand – What-if |
The Warehouse Capped Demand – What-if is the What-if version of Warehouse Capped Demand. |
This view displays a filtered view of inventory packsizes at the SKU Pack Size/Destination/Day level.
These measures are read-only.
Table 7-45 lists the read-only measures in this view.
Table 7-45 Measures: Inventory Packsize Details
| Measure Label | Description |
|---|---|
|
Projected Inventory |
The Projected Inventory is the projected inventory calculated in the most recent AIP batch run. It includes any impacts due to scaling to Supplier Minimums and Container Minimums. This is calculated using the standard PI calculation where the Planned Receipts (PR) element represents scaled orders. |
|
Projected Inventory – Pre-Scaling |
The Projected Inventory – Pre-Scaling is the projected inventory calculated in the most recent AIP batch run prior to applying Supplier Minimums and Container Constraints. This is calculated using the standard PI calculation where the Planned Receipts (PR) element represents pre-scaling orders output from replenishment. |
|
Projected Inventory – What-if |
The Projected Inventory – What-if displays the Pre-scaling Projected Inventory calculated in the most recent AIP Batch run. If any changes are made to WRP parameters and you select What-if – Unconstrained or What-if – Constrained from the What-if option on the menu bar, this measure is updated with the newly calculated PI for the SKU/Warehouse. |
|
Warehouse Capped PI |
The Warehouse Capped PI is calculated using the standard PI equation: PIt = Max (PIt-1 + ERt-1 – Dmdt-1 + PRt-1 – ESt-1 – COt-1, 0) Where Dmdt = Capped Demand (demand based on CRPs into the destinations) for any day t PRt = Planned Receipts (Receipt Plan) at the warehouse for any day t Both Dmdt and PRt represent aggregate values at the SKUGroup level for all SKUPacks belonging to that SKU Group. |
|
Warehouse Capped PI – What-if |
The Warehouse Capped PI – What-if is the What-if version of Warehouse Capped PI. |
|
Warehouse Residual Excess Quantity |
The Warehouse Residual Excess Quantity is equal to any excess stock that was left at the end of day for which there were no locations available to receive excess stock (either because of inventory capping or no ATP days or for any other reason). After stockless processing for the day, this quantity can be calculated as follows: ResidualQty(t) = Max(PI(t) + ER(t) + CRP(t) – Dmd(t), 0) (essentially the PI calculation for day t+1) |
|
Warehouse Residual Excess Quantity – What-if |
The Warehouse Residual Excess Quantity – What-if is the What-if version of Warehouse Residual Excess Quantity. |
This view displays the WRP receipt plan and calculation parameters at the SKU Pack Size/Destination/Source/Day Level.
Table 6-44 lists the measures in this view.
Table 7-46 Measures: Receipt Plan By SKU Pack Size Interactive View
| Measure Label | Description |
|---|---|
|
Lead Time |
This measure is the final lead time calculated based on multiple inputs in DM Online. This measure cannot be impacted through changes made by you in the workbook.(Read only) |
|
Receipt Plan |
This read-only measure represents the receipt plan. This plan is constrained (by the shortfall reconciliation process) through the fixed period and then unconstrained for the remainder of the planning horizon. |
|
Receipt Plan - What-if |
Read-only measure that initially displays the Receipt Plan calculated in the previous AIP Batch run. If any changes are made to WRP parameters and you select What-if - Unconstrained or What-if - Constrained from the Quick Access toolbar, this measure is updated with the newly calculated Receipt Plan for the SKU Pack-size/Warehouse. |
|
Source Order Multiple |
Read-only measure that displays the order multiple used when placing orders on the source. This measure cannot be impacted through changes made by you in the workbook. |
|
Source Splits (Expanded) |
Read-only measure that displays the target percentage of the warehouses need for the SKU Pack Size that should be satisfied by the source. |
|
Unconstrained Receipt Plan |
This read-only measure represents the receipt plan, unconstrained throughout the entire planning horizon. |
|
Unconstrained Receipt Plan - What-if |
Read-only measure that initially displays the Unconstrained Receipt Plan calculated in the previous AIP Batch run. If any changes are made to WRP parameters and you select What-if - Unconstrained or What-if - Constrained from the Quick Access toolbar, this measure is updated with the newly calculated Unconstrained Receipt Plan for the SKU Pack-size/Warehouse. |
|
Warehouse Orderable Unit |
This read-only measure displays the SKU Pack Size that should be used when ordered from the source into the destination on that day. |
|
Warehouse Source |
This read-only Boolean measure indicates whether the source can deliver the SKU Pack Size into the destination on that day. |
This view allows you to review store event replenishment plan information at the (SKU/Store/Day) level.
Table 7-47 lists the measures in this view.
Table 7-47 Measures: Store Event Replenishment Parameters View
| Measure Label | Description |
|---|---|
|
Event AWS Factor – Store |
The Event AWS Factor – Store is used in the Factor AWS Repl Method |
|
Event Boundary Stock – Store |
The Event Boundary Stock – Store is used in the Factor AWS, Sales Week Range, and Loaded SS Dynamic Repl Methods |
|
Event Demo Stock – Store |
The Event Demo Stock – Store is used in the RP and RUTL calculations |
|
Event Increment Percent – Store |
The Event Increment Percent – Store is used in the Min/Max Repl Method |
|
Event Inventory Selling Days – Store |
The Event Inventory Selling Days – Store is used in the Hybrid, Poisson, Dynamic and Loaded SS Dynamic Repl Methods |
|
Event Max Safety Stock Days – Store |
The Event Max Safety Stock Days – Store is used in the Minimum Safety Stock Boundaries calculation |
|
Event Max Safety Stock Units – Store |
The Event Max Safety Stock Units – Store is used in the Minimum Safety Stock Boundaries calculation |
|
Event Max Stock – Store |
The Event Max Stock – Store is used in the Min/Max Repl Method |
|
Event Max Time Supply Days – Store |
The Event Max Time Supply Days – Store is used in the Time Supply Repl Method |
|
Event Min Safety Stock Days – Store |
The Event Min Safety Stock Days – Store is used in the Minimum Safety Stock Boundaries calculation |
|
Event Min Safety Stock Units – Store |
The Event Min Safety Stock Units – Store is used in the Minimum Safety Stock Boundaries calculation |
|
Event Min Stock – Store |
The Event Min Stock – Store is used in the Min/Max Repl Method |
|
Event Min Time Supply Days – Store |
The Event Min Time Supply Days – Store is used in the Time Supply Repl Method |
|
Event MSQ Constraint Indicator – Store |
Event MSQ Constraint Indicator – Store indicates when the MSQ should be removed from ordering decisions. If the indicator is On, MSQ will be used as a constraint. |
|
Event Percent of Pallet – Store |
The Event Min Stock – Store is used in Pallet Rounding |
|
Event Replenishment Method - Store |
Event-specific measure at the SKU/Store/Day level. The Replenishment Method determines the type of calculations that are used in generating a store replenishment plan. The default is No Replenishment. |
|
Event Rounding Method – Store |
The Event Rounding Method – Store calculates in Data Management for Singles and can be updated at the default and exception level in SRP. |
|
Event Rounding Threshold – Store |
The Event Rounding Threshold – Store is used in the IRQ calculation |
|
Event Safety Stock Level Factor – Store |
The Event Safety Stock Level Factor – Store is used in the Time Supply, Hybrid, Poisson, Dynamic and Loaded SS Dynamic Repl Methods. If a 0 is desired, a small fraction must be entered. |
|
Event Service Level – Store |
The Event Service Level – Store is used in the in Dynamic Repl Method. |
|
Event Shelf Capacity – Store |
Event-specific measure at the SKU/Store/Day level. Shelf Capacity is the amount of stock in units to fill a shelf to the desired maximum level. |
|
Event Shelf Capacity Flag - Store |
The Event Shelf Capacity Flag - Store is used in the RP and RUTL calculations |
|
Event Time Supply Horizon - Store |
The Event Time Supply Horizon - Store is used in the Time Supply Repl Method |
|
Event Weekly Sales Max – Store |
The Event Weekly Sales Max – Store is used in the Factor AWS, Sales Week Range, and Loaded SS Dynamic Repl Methods |
|
Event Weekly Sales Min – Store |
The Event Weekly Sales Min – Store is used in the Factor AWS, Sales Week Range, and Loaded SS Dynamic Repl Methods |
Hidden Measures
Table 7-48 lists the measures in this view that are hidden when using the default template. They can be displayed and maintained by using the Insert measure function of RPAS. Hidden measures may also be added to the template during configuration.
Table 7-48 Hidden Measures: Store Event Replenishment Parameters View
| Measure Label | Description |
|---|---|
|
Event Acceptable Loss – Store |
The Event Acceptable Loss – Store is used in the Expected Spoilage calculation If you edit this measure on this worksheet:
|
|
Event Spoilage Threshold - Store |
The Event Spoilage Threshold - Store is used in theExpected Spoilage calculation If you edit this measure on this worksheet:
|
This view allows you to view store presentation stock calculations at the (SKU/Store/Day) level.
Table 7-49 lists the measures in this view.
Table 7-49 Measures: Store Presentation Stock Calculations (SKU/Store/Day) View
| Measure Label | Description |
|---|---|
|
Promotion Presentation Stock Pre Factor - Store |
The Promotion Presentation Stock Pre Factor - Store represents the specified quantity for Store Promotion Presentation Stock before application of the End of Store Promotion Factor. |
|
Promotion Presentation Stock – end of promo factor (expanded) |
The Promotion Presentation Stock – end of promo factor (expanded) displays a factor of 1 for the days within the promotion period prior to the ramp down and will then show the designated End of Promotion Factor values as it approaches the end of the promotion. A factor of 1 will be displayed after the promotion has ended. |
|
Promotion Presentation Stock Override Flag (expanded) – Store |
The expanded version of Store Promotion Presentation Stock Override Flag displays the actual value used in the calculations. This is the merge of exception level (SKU/Store/Day), default level (Sub-class/Store format), and global level (Dept) values entered. |
|
Store Promotion Presentation Stock |
The Store Promotion Presentation Stock calculates at sku/str/day which represents the End of Store Promotion Factor applied to the Base Store Promotion Presentation Stock. If the Store Promotion Presentation Stock Override Flag is turned on, this becomes equal to 0. |
|
Weekly Base Sales Forecast – Store |
The Weekly Base Sales Forecast – Store is the Day level representation of the weekly base sales forecast. This is calculated by replicating the value from Loaded Weekly Base Sales Forecast to sku/str/day. |
|
Weekly Base Sales Forecast % (expanded) - Store |
The expanded version of Store Weekly Base Sales Forecast displays the actual value used in calculations. This represents the merge of the global default, default and exception level versions of Store Weekly Base Sales Forecast. 0 represents 0% of the forecast to be used and 1 will indicate to use 100% of the forecast. |
|
Min Presentation Stock (expanded) - Store |
The expanded version of Store Minimum Presentation Stock displays the actual value used in calculations. This represents the merge of the global default, default and exception level versions of Store Minimum Presentation Stock. |
|
Calculated Presentation Stock - Store |
The Calculated Presentation Stock - Store represents the max(Weekly Base Sales Forecast x Weekly Base Sales Forecast %, Store Minimum Presentation Stock). If the Calculated Store Presentation Stock Indicator is turned off, this value is 0. |
|
Presentation Stock Override Flag (expanded) – Store |
The expanded version of Store Presentation Stock Override Flag displays the actual value used in calculations. This represents the merge of the global default, default and exception level versions of Store Presentation Stock Override Flag. |
|
Presentation Stock Override Quantity (expanded) – Store |
The expanded version of Store Presentation Stock Override Quantity which displays the actual value used in calculations. This represents the merge of the global default, default and exception level versions of Store Presentation Stock Override Quantity. |
|
User Specified Presentation Stock (expanded) - Store |
The expanded version of User Specified Store Presentation Stock displays the actual value used in the calculations. This is the merge of exception level (SKU/Store/Day), default level (Sub-class/Store format), and global level (Dept) values entered |
|
Total Presentation Stock - Store |
The Total Presentation Stock - Store represents the max when the Store Presentation Stock Override Flag is selected. |
This view displays a filtered view of store receipt packsizes at the SKU Pack Size/Store/Day level.
These measures are read-only.
Table 7-50 lists the read-only measures in this view.
Table 7-50 Measures: Store Receipt Packsize Details View
| Measure Label | Description |
|---|---|
|
Receipt Plan – Store |
The Receipt Plan – Store displays future planned receipts based on available to plan receipt days inventory position |
|
Receipt Plan (What-if) – Store |
The Receipt Plan (What-if) – Store measure updates after What-if calculations. |
This view provides a company-wide view of inventory levels in the supply chain. This view has both:
Read-only Measures
The loaded and calculated measures are read-only. Parameter values at the SKU/Store/Day level may be maintained. Expanded measures are read-only.
Table 6-46 lists the measures in this view that display automatically when using the default template.
Table 7-51 Measures: Store Receipt Plan (SKU/Store/Day) Interactive View
| Measure Label | Description |
|---|---|
|
AWS Factor (expanded) - Store |
The AWS Factor allows you to provide a numeric factor to be multiplied against the Average Weekly Sales (AWS) to determine replenishment boundaries (SS, RP and RUTL) for the Factor AWS replenishment method. Example: An AWS Factor of 0.5 calculates a SS that is 50% of the average weekly sales. AWS Factor (expanded) - Store displays the actual value used in the calculations. This is the merge of exception level (SKU/Store/Day), default level (Sub-class/Store format), and global level (Dept) values entered. |
|
Boundary Stock (expanded) - Store |
The Boundary Stock (expanded) - Store identifier allows you to select the stock level to use in calculating the Store RP and Store RUTL. This stock level is a combination of Safety Stock, Presentation Stock or Promotional Presentation Stock based on the following identifiers. If the identifier contains vs., the greater value is used. This parameter affects all replenishment methods. The boundary options are:
Where, SS = Safety Stock PS = Presentation Stock PPS = Promotional Presentation Stock The default is SS vs. PS + PPS. Example: SS vs. PS adds the greater of SS or PS to the calculated Store RP and Store RUTL values. SS + PS adds the total of SS and PS to the calculated Store RP and Store RUTL values. Boundary Stock (expanded) - Store displays the actual value used in the calculations. This is the merge of exception level (SKU/Store/Day), default level (Sub-class/Store format), and global level (Dept) values entered. |
|
Customer Orders - Store |
Customer Orders - Store (CO) are orders placed by customers at a store for a specific quantity of a SKU to be picked up on a specific delivery date. Customer orders are treated as additional demand on top of normal forecasted demand. Note: Customer Orders are loaded to SRP from an external system. |
|
Customer Orders Over Review Time - Store |
Customer Orders Over Review Time - Store represents the customer Orders that must be accounted for when calculating the Ideal Receipt Quantity on an ATP day. Customer Orders are summed from the day after the beginning of the review period through the day before the end of the review period. Store Customer Orders Over Review Time is only calculated on Available to Plan receipt days. |
|
Daily Store Standard Deviation |
The Daily Store Standard Deviation represents the forecast error assuming a normal distribution. The standard deviation is used in the calculation of dynamic Safety Stock. Note: This measure is loaded from an external system. |
|
Delivery-day Demand Percent (expanded) |
The actual value used in calculations. This is a merge of the multiple levels of Delivery-day Demand Percent. |
|
Demo Stock (expanded) - Store |
Amount of stock that is used as demonstration product, but is still available to sell. Demo Stock is added to the RP and RUTL levels for each day. Demo Stock (expanded) - Store displays the actual value used in the calculations. This is the merge of exception level (SKU/Store/Day), default level (Sub-class/Store format), and global level (Dept) values entered. |
|
Expected Receipts - Store |
Expected Receipts - Store (ER) are orders that have already been executed and therefore need to be considered when planning future orders for a store. Expected Receipts - Store is the sum of in-transits and on orders. Note: In-transits and on orders s are loaded to SRP from an external system. |
|
Forecast Demand Over Review Time - Store |
The Forecast Demand Over Review Time - Store is calculated as the sum of the forecasted demand from the current day through the next receipt day. Forecast Demand Over Review Time - Store is only calculated on Available to Plan receipt days. |
|
Increment Percent (expanded) - Store |
The Increment Percent acts as a multiplier for minimum and maximum stock that is designed to handle temporary fluctuation in demand for items using the Min/Max Replenishment Method. An increment percentage factor can be used to temporarily increase or decrease targeted stocking levels without altering the established MIN and MAX values. Example: An Increment Percent of 1.2 adds 20% to the Min and Max Stock. Increment Percent (expanded) - Store displays the actual value used in the calculations. This is the merge of exception level (SKU/Store/Day), default level (Sub-class/Store format), and global level (Dept) values entered. |
|
Inventory Selling Days (expanded) - Store |
The Inventory Selling Days parameter is used to specify the number of days of forecast quantity to be used when calculating the RUTL with the Hybrid, Dynamic, Poisson and Loaded SS Dynamic Replenishment Methods. The RUTL calculation uses the forecast demand over the greater of Inventory Selling Days and Review Time. Inventory Selling Days can be used to avoid producing very small frequent orders. Example: Inventory Selling Days of 14 ensures that an order contains at least 14 days of supply. Inventory Selling Days (expanded) - Store displays the actual value used in the calculations. This is the merge of exception level (SKU/Store/Day), default level (Sub-class/Store format), and global level (Dept) values entered. |
|
Max Safety Stock Days (expanded) - Store |
The Max Safety Stock Days parameter is used to specify the maximum number of days of cover to be kept on hand as Safety Stock. If you enter both Max Safety Stock Days and Max Safety Stock Units, the Maximum Safety Stock boundary uses the larger of demand over Max Safety Stock Days and Max Safety Stock Units. Example: Max Safety Stock Days of 14 ensures the Maximum Safety Stock contains at least 14 days of supply. If Max Safety Stock Units is greater than 14 days of supply, max units would be used as the Maximum Safety Stock, otherwise Maximum Safety Stock would be the number of units required to cover 14 days of demand, calculated as the sum of demand over the next 14 days beginning with the current day. Max Safety Stock Days (expanded) - Store displays the actual value used in the calculations. This is the merge of exception level (SKU/Store/Day), default level (Sub-class/Store format), and global level (Dept) values entered. |
|
Max Safety Stock Units (expanded) - Store |
The Max Safety Stock Units parameter is used to specify the maximum amount of inventory to be kept on hand as Safety Stock. If you enter both Max Safety Stock Days and Max Safety Stock Units, the Maximum Safety Stock boundary uses the larger of demand over Max Safety Stock Days and Max Safety Stock Units. Example: Max Safety Stock Days of 14 ensures the Maximum Safety Stock contains at least 14 days of supply. If Max Safety Stock Units is greater than 14 days of supply, max units would be used as the Maximum Safety Stock, otherwise Maximum Safety Stock would be the number of units required to cover 14 days of demand Max Safety Stock Units (expanded) - Store displays the actual value used in the calculations. This is the merge of exception level (SKU/Store/Day), default level (Sub-class/Store format), and global level (Dept) values entered. |
|
Max Stock (expanded) - Store |
Max Stock is only used in the Min/Max Replenishment Method. It represents the maximum stock level in units that are desired on hand to satisfy demand. The receipt plan quantity is calculated to bring Net Inventory up to MAX Stock. Max Stock (expanded) - Store displays the actual value used in the calculations. This is the merge of exception level (SKU/Store/Day), default level (Sub-class/Store format), and global level (Dept) values entered. |
|
Max Time Supply Days (expanded) - Store |
Max Time Supply Days is only used in the Time Supply Replenishment Method. It represents maximum stock level in terms of number of days cover that are desired on hand to satisfy demand. The receipt plan quantity is calculated to bring Net Inventory up to Maximum Time Supply Days of cover. Example: Max Time Supply Days of 14 ensures an order brings the inventory level up to 14 days of supply. Max Time Supply Days (expanded) - Store displays the actual value used in the calculations. This is the merge of exception level (SKU/Store/Day), default level (Sub-class/Store format), and global level (Dept) values entered. |
|
Min Safety Stock Days (expanded) - Store |
The Min Safety Stock Days parameter is used to specify the minimum number of days of cover to be kept on hand as Safety Stock. If you enter both Min Safety Stock Days and Min Safety Stock Units, the Minimum Safety Stock boundary uses the larger of demand over Min Safety Stock Days and Min Safety Stock Units. Example: Min Safety Stock Days of 7 ensures the Minimum Safety Stock contains at least seven days of supply. If Min Safety Stock Units is greater than seven days of supply, min units would be used as the Minimum Safety Stock, otherwise Minimum Safety Stock would be the number of units required to cover seven days of demand, calculated as the sum of demand over the next seven days beginning with the current day. Min Safety Stock Days (expanded) - Store displays the actual value used in the calculations. This is the merge of exception level (SKU/Store/Day), default level (Sub-class/Store format), and global level (Dept) values entered. |
|
Min Safety Stock Units (expanded) - Store |
The Min Safety Stock Units parameter is used to specify the minimum amount of inventory to be kept on hand as Safety Stock. If you enter both Min Safety Stock Days and Min Safety Stock Units, the Minimum Safety Stock boundary uses the larger of demand over Min Safety Stock Days and Min Safety Stock Units. Example: Min Safety Stock Days of 7 ensures the Minimum Safety Stock contains at least seven days of supply. If Min Safety Stock Units is greater than seven days of supply, min units would be used as the Minimum Safety Stock, otherwise Minimum Safety Stock would be the number of units required to cover seven days of demand. Min Safety Stock Units (expanded) - Store displays the actual value used in the calculations. This is the merge of exception level (SKU/Store/Day), default level (Sub-class/Store format), and global level (Dept) values entered. |
|
Min Stock (expanded) - Store |
Min Stock is only used in the Min/Max Replenishment Method. It represents the minimum stock level in units that are desired on hand to satisfy demand. Min Stock is used in determining the inventory level at which a replenishment is triggered. Min Stock (expanded) - Store displays the actual value used in the calculations. This is the merge of exception level (SKU/Store/Day), default level (Sub-class/Store format), and global level (Dept) values entered. |
|
Min Time Supply Days (expanded) - Store |
Min Time Supply Days is only used in the Time Supply and Hybrid Replenishment Method. It represents minimum stock level in terms of number of days cover that are desired on hand to satisfy demand. Min Time Supply Days of cover is used in both SS and RP calculations. Example: To ensure a minimum inventory level that covers seven days of supply; then in the Min Time Supply Days, enter: 7. Min Time Supply Days (expanded) - Store displays the actual value used in the calculations. This is the merge of exception level (SKU/Store/Day), default level (Sub-class/Store format), and global level (Dept) values entered. |
|
MSQ Constraint Indicator (expanded) - Store |
The expanded version of Store MSQ Constraint Indicator displays the actual value used in calculations. This represents the merge of the global default, default, and exception level versions of Store MSQ Constraint Indicator. If the indicator is On, MSQ is applied as a constraint during ordering decisions. |
|
Net Inventory - Store |
Net Inventory - Store (NI) is calculated in batch AIP and is a prediction of the inventory position at the end of review time. It represents what inventory is available to meet demand over the period. The NI calculation is based on the Projected Inventory position at the beginning of the period, then considering the impact of Expected Receipts (ER) and Expected Spoilage (ES) over the review time. Net Inventory - Store is only calculated on Available to Plan receipt days, and is used as the point at which SRP generates a planned receipt. Important: While it is possible to rollup Net Inventory across the time dimension, it is not recommended. Aggregation over time does not produce a meaningful result since the calculation of Net Inventory involves the summation of data over review times which do not correlate with positions in the calendar hierarchy. |
|
Percent of Pallet (expanded) - Store |
The Percent of Pallet (expanded) - Store represents the primary pack-size to be used when ordering a SKU for a store (either from a warehouse or from a supplier). Note: Percent of Pallet (expanded) - Store is loaded from Data Management (DM). |
|
Percent of Pallet (expanded) - Store |
Percent of pallet is used to determine if the Ideal Receipt Quantity for replenishment should be rounded to a full pallet. It represents the percentage threshold that case demand must exceed in order for pallet rounding to occur. Example: Percent of Pallet of 0.75 rounds an order up to a pallet if the case demand is greater than 75 percent of a pallet. Percent of Pallet (expanded) - Store displays the actual value used in the calculations. This is the merge of exception level (SKU/Store/Day), default level (Sub-class/Store format), and global level (Dept) values entered. |
|
Projected Inventory - Store |
Projected Inventory - Store (PI) is calculated in AIP batch and represents a projection of the opening inventory position for any day in the planning horizon at a specific store. None of that day's activities (either receipts or demand) are reflected in PI, and so it is often referred to as a beginning of day position. PI on a given day is calculated as the PI of the previous day plus the net impact of all demand and replenishments on the previous day. Previous day demand is consists of forecasted demand plus any Customer Orders (CO) on that day. Previous day replenishments consist of Expected and Planned Receipts. |
|
Projected Stock Out- Store |
Projected Stock Out - Store is calculated based on forecasted demand and projected inventory. It represents the projected lost sales as a result of an out of stock at the store. |
|
Promotion Presentation Stock - End of Store Promotion Factor (expanded) |
Promotion Presentation Stock - End of Store Promotion Factor (expanded) displays the actual value used in the calculations. This version displays a factor of 1 for the days within the promotion period prior to the ramp down and then shows the designated End of Promotion Factor values as it approaches the end of the promotion. A factor of 1 is displayed after the promotion has ended. |
|
Promotion Presentation Stock - Store |
The Promotion Presentation Stock - Store represents the Promotion Presentation Stock - End of Promo Factor applied to the Promotion Presentation Stock Pre Factor - Store. If the Promotion Presentation Stock Override Flag (expanded) - Store Override Flag is turned on, this becomes equal to zero (0). |
|
Promotion Presentation Stock Override Flag (expanded) - Store |
The Promotion Presentation Stock Override Flag (expanded) - Store displays the actual value used in the calculations. This is the merge of exception level (SKU/Store/Day), default level (Sub-class/Store format), and global level (Dept) values entered. |
|
Promotion Presentation Stock Pre Factor - Store |
The Promotion Presentation Stock Pre Factor - Store represents the specified quantity for Store Promotion Presentation Stock before application of the Promotion Presentation Stock - End of Promo Factor. |
|
Receipt Plan - Store |
The Receipt Plan - Store represents SRP's recommendations for ordering based on demand, allocation boundaries and available inventory. The Receipt Plan is final result calculations in AIP Batch including adjustments made to Ideal Receipt Quantity based on rounding and constraints made to the Unconstrained Receipt Plan based on inventory available at the source. This measure has a related filtered worksheet. See the Store Receipt Packsize Details View for more information. |
|
Receipt Plan (Store) - What-if |
The Store Receipt Plan - What-if initially displays the Receipt Plan calculated in the previous AIP Batch run. If any changes are made to SRP parameters and you select What-if - Unconstrained or What-if - Constrained from the What-if button on the menu bar, this measure is updated with the newly calculated Receipt Plan for the SKU/Store. This measure has a related filtered worksheet. See the Store Receipt Packsize Details View for more information. |
|
Receipt Point - Store |
The Receipt Point - Store represents the inventory level below which an order should be triggered. RP is calculated differently based on the selected Replenishment Method. Receipt Point - Store is only calculated on Available to Plan receipt days. |
|
Receive Up to Level - Store |
The Receive Up to Level (RUTL) denotes the target level of inventory when generating an order. Receive Up to Level is calculated differently based on the selected Replenishment Method. Receive Up to Level - Store is only calculated on Available to Plan receipt days. |
|
Reconciled Orders - Store |
The Reconciled Orders - Store is an indicator informing users which indicates which orders have been reconciled. |
|
Reconciliation Adjustment - Store |
The Reconciliation Adjustment - Store represents the difference between the Unconstrained Receipt Plan and the Store Receipt Plan due to inventory constraints, inventory availability at the source location. |
|
Replenishment Method (expanded) - Store |
The choice of Replenishment Method determines the calculations that are used in generating a store replenishment method. Blank indicates the system preset value of No Replenishment. The Replenishment Method options are:
The default is No Replenishment. Replenishment Method (expanded) - Store displays the actual value used in the calculations. This is the merge of exception level (SKU/Store/Day), default level (Sub-class/Store format), and global level (Dept) values entered. |
|
Rounding Method (expanded) - Store |
The Rounding Method is used when pack rounding the Ideal Receipt Quantity (IRQ). The Rounding Method options are:
Rounding Method (expanded) - Store displays the actual value used in the calculations. This is the merge of exception level (SKU/Store/Day), default level (Sub-class/Store format), and global level (Dept) values entered. |
|
Rounding Threshold (expanded) - Store |
The Rounding Threshold represents the portion of a pack above which the replenishment plan is rounded up and below which it is rounded down. Example: To round up an order up to a pack when the demand is greater than 25 percent of a pack; then in the Rounding Threshold, enter: 0.25. Rounding Threshold (expanded) - Store displays the actual value used in the calculations. This is the merge of exception level (SKU/Store/Day), default level (Sub-class/Store format), and global level (Dept) values entered. |
|
Safety Stock - Store |
Safety Stock - Store (SS) is inventory held at a location to mitigate the risks of stock outs caused by variability in forecasted demand. Safety stock is calculated differently based on the selected Replenishment Method. All replenishment methods allow the Safety Stock to be bound by minimum and maximum values. Safety Stock - Store is only calculated on Available to Plan receipt days. |
|
Safety Stock Level Factor (expanded) - Store |
The Safety Stock Level Factor represents the amount of additional Safety Stock to carry in anticipation of unpredictable events (for instance, weather changes) or to provide additional Safety Stock during a special promotion or event. This provides a temporary lift in the RP and RUTL values. The Safety Stock Level Factor is used in Time Supply, Hybrid, Poisson, Dynamic and Loaded SS Dynamic Replenishment Methods. Example: To increase Safety Stock by 25 units, you would enter a Safety Stock Level Factor of 25. Negative values may also be entered to decrease the Safety Stock level. Safety Stock Level Factor (expanded) - Store displays the actual value used in the calculations. This is the merge of exception level (SKU/Store/Day), default level (Sub-class/Store format), and global level (Dept) values entered. |
|
Service Level (expanded) - Store |
The Service Level is used in the Safety Stock calculations for the Dynamic and Poisson replenishment methods. It is defined as the percentage of time that the stock should be able to meet demand. Example: A Service Level of 0.90 carries enough Safety Stock to maintain a 90% customer service level. Service Level (expanded) - Store displays the actual value used in the calculations. This is the merge of exception level (SKU/Store/Day), default level (Sub-class/Store format), and global level (Dept) values entered. |
|
Shelf Capacity (expanded) - Store |
Shelf capacity is the amount of stock to fill a shelf to the desired maximum level. If the Shelf Capacity Flag is set to Yes, the shelf capacity is used to cap the RP and RUTL. Shelf Capacity (expanded) - Store displays the actual value used in the calculations. This is the merge of exception level (SKU/Store/Day), default level (Sub-class/Store format), and global level (Dept) values entered. |
|
Shelf Capacity Flag (expanded) - Store |
The Shelf Capacity Flag is used to determine if the RP and RUTL should be capped by the shelf capacity. The Shelf Capacity Flag options are:
Example: Selecting Yes causes SRP to use shelf capacity to cap RP and RUTL. Selecting No or Default, SRP does not use shelf capacity to cap RP and RUTL. Shelf Capacity Flag (expanded) - Store displays the actual value used in the calculations. This is the merge of exception level (SKU/Store/Day), default level (Sub-class/Store format), and global level (Dept) values entered. |
|
Store Available To Plan Receipt |
The Store Available to Plan Receipt (ATP) indicates the days on which a store may plan a receipt based on the store's release schedule. A checkmark in a box indicates a receipt may be planned on that day. |
|
Store Forecast Demand |
The Store Forecast Demand is the forecast of the store's future sales. Note: Demand Forecast is loaded from an external forecasting system. |
|
Store Net Inventory Post Replenishment |
Store Net Inventory Post Replenishment is the inventory over the review time factoring in a planned receipt. This is Store Net Inventory plus the planned receipt on that day. |
|
Store Release Schedule |
The Store Release Schedule is an integer representing the lead time from a source location to store for a SKU. The release schedule is calculated in Data Management (DM) based on lead time and order cycle. A numeric field indicating the lead times. |
|
Store Source Label |
The Store Source Label identifies the source from which this store receives inventory. |
|
Time Supply Horizon (expanded) - Store |
The Time Supply Horizon parameter is used to specify days of forecast in order to calculate a rate of sale. If a time supply horizon is specified, the rate of sale is used instead of the actual forecast when calculating demand over the time supply days for inventory target level calculations for the Time Supply Replenishment Method. Example: A Time Supply Horizon of 7 calculates a Rate of Sale (ROS) over a one week period. The ROS is then calculated by summing the forecasted sales over the seven days and dividing that number by seven. Time Supply Horizon (expanded) - Store displays the actual value used in the calculations. This is the merge of exception level (SKU/Store/Day), default level (Sub-class/Store format), and global level (Dept) values entered. |
|
User Specified Store Presentation Stock (expanded) - Store |
User Specified Store Presentation Stock is the minimum amount of stock in units desired to have on hand for display/sales purposes. User Specified Store Presentation Stock may be taken into consideration when calculating the RP and RUTL, depending on the Boundary Stock selected. User Specified Store Presentation Stock (expanded) - Store displays the actual value used in the calculations. This is the merge of exception level (SKU/Store/Day), default level (Sub-class/Store format), and global level (Dept) values entered. |
|
Weekly Sales Max (expanded) - Store |
Maximum stock boundary for the Factor AWS, Sales Week Range, and Loaded SS Dynamic Replenishment methods. Weekly Sales Max (expanded) - Store displays the actual value used in the calculations. This is the merge of exception level (SKU/Store/Day), default level (Sub-class/Store format), and global level (Dept) values entered. |
|
Weekly Sales Min (expanded) - Store |
Minimum stock boundary for the Factor AWS, Sales Week Range, and Loaded SS Dynamic Replenishment methods. Weekly Sales Min (expanded) - Store displays the actual value used in the calculations. This is the merge of exception level (SKU/Store/Day), default level (Sub-class/Store format), and global level (Dept) values entered. |
|
Total Substitute Demand Quantity |
Total Substitute Demand Quantity is a quantity of demand expected to occur as a result of one or more other SKUs being out of stock. This quantity represents increased demand on the original SKU by other related SKUs. This measure has a related filtered worksheet. See the Substitution Details View for more information. |
|
Total Substitute Received Quantity |
Total Substitute Received Quantity is a quantity of stock that an original SKU has received from other substitute SKUs in order to attempt to cover a shortage that the original SKU has experienced. |
Hidden Measures
Table 6-47 lists the measures in this view that are hidden when using the default template. They can be displayed and maintained by using the Insert measure function of RPAS.
Table 7-52 Hidden Measures: Store Receipt Plan (SKU/Store/Day) Interactive View
| Measure Label | Description |
|---|---|
|
Acceptable Loss (expanded) - Store |
Acceptable Loss (expanded) - Store displays the actual value used in the calculations. This is the merge of exception level (SKU/Store/Day), default level (Sub-class/Store format), and global level (Dept) values entered.(Read only) |
|
Active SKU CAP (Units) (Expanded) |
SKU Cap (value in units) is used in store replenishment calculations. During replenishment calculations, this is the maximum boundary for inventory at the store. |
|
Aggregated Store Ads |
Aggregated Store Ads indicates the presence of any active ads within the SKU Group/Week level. Aggregated Store Ads is True if at least one ad exists over the week for this SKU Group. |
|
Cases Per Pallet- Store |
Cases Per Pallet- Store reflects the number of cases on a pallet. Note: Cases Per Pallet- Store is loaded from Data Management (DM). (Read only) |
|
Daily Sales- Store |
Daily Sales- Store represents the daily sales for a SKU/Store/Day. Note: This measure is loaded from an external system for use in calculating SRP alerts. (Read only) |
|
Expected Receipts In Transit - Store |
Expected Receipts In Transit - Store represents inventory in transit from warehouses and suppliers to store. Note: This measure is loaded from an external system. (Read only) |
|
Expected Spoilage - Store |
Expected Spoilage - Store refers to a quantity of a SKU at a store whose product life expires and therefore becomes un-sellable at the end of a day. Expired quantities cannot be used for any sales after the day they expire. Expected Spoilage - Store is only calculated when the global Inventory Aging Flag is set to True, the Product Life of the SKU is greater than zero and the Product Life of the SKU is less than or equal to the Aging Threshold. The calculation is based on the inventory position, demand, expected receipts and product life. You can specify an expected write-off quantity which overrides the expected spoilage if the write-off quantity is greater than the calculated value. (Read only) |
|
Expected Write-off - Store |
Expected Write-off - Store represents the quantity of stock expected to be thrown out for any reason (spoilage, breakage, and so on) on a given day. Expected Write-offs override calculated expected spoilage. Note: This measure is loaded from an external system. (Read only) |
|
Max Sellable Quantity - Store |
Max Sellable Quantity - Store (MSQ) represents a level of inventory that can be sold within the life of a product. If the Freshness Flag is set to True, then Maximum Sellable Quantity is calculated as the sum of forecasted demand over the product life starting from the beginning of the review time and Customer Orders over Review Time. If the Freshness Flag is set to False, the Customer Orders are summed for the life of the product, then added to the sum of Forecast Sales over the life of the product and Back Orders to determine the final MSQ. It is calculated as all forecast demand over the product life starting from the beginning of the review time. Customer Orders over the Review Time (CORT), an additional non-forecast-able source of demand, and Back Orders, are then added. Max Sellable Quantity - Store is only calculated on Available to Plan receipt days. As MSQ is dependent upon Product Life (PL), where Product Life is deemed to be not relevant for a SKU, the MSQ is considered infinite (Unbounded). (Read only) |
|
Min Sales Stock - Store |
Min Sales Stock - Store (MSS) represents a level of inventory required to meet demand. This is calculated as the minimum between MSQ and the sum of Forecasted Demand over Review Time and Customer Orders over the Review Time. For those replenishment methods where forecasted demand is not used, demand in the MSS calculation is replaced with calculated Safety Stock. Min Sales Stock - Store is only calculated on Available to Plan receipt days. If a shelf capacity constraint exists (Shelf Capacity Flag is set to True) Store Minimum Sales Stock may not exceed the level required to fill the shelf to capacity and meet CORT. (Read only) |
|
Non-Capped URP - Store |
Non-Capped URP - Store represents the theoretical URP at the SKU/Store/day level, which would have been calculated if the SKU was not capped at all across time. |
|
On Orders - Store |
On Orders - Store are fixed orders currently being processed for delivery to store either from warehouses or directly from suppliers Note: This measure is loaded from an external system. (Read only) |
|
Product Life - Store |
Product Life - Store represents the number of days from the time a product arrives at the store until it spoils. Any positive integer, including zero, is valid. Special Values: -1 (Use Previous) |
|
Spoilage Threshold (expanded) - Store |
Spoilage Threshold (expanded) - Store displays the actual value used in the calculations. This is the merge of exception level (SKU/Store/Day), default level (Sub-class/Store format), and global level (Dept) values entered.(Read only) |
|
Store Ads Grand Opening |
Store Ads Grand Opening indicates grand opening ads exist for this SKU/Store/Day. This measure can be aggregated to provide information regarding the number of locations that are on Ad. Note: This measure is loaded from an external system. (Read only) |
|
Store Ads Inserts |
Store Ads Inserts indicates inserts ads exist for this SKU/Store/Day. This measure can be aggregated to provide information regarding the number of locations that are on Ad. Note: This measure is loaded from an external system. (Read only) |
|
Store Ads Others |
Store Ads Others indicates other miscellaneous ads exist for this SKU/Store/Day. This measure can be aggregated to provide information regarding the number of locations that are on Ad. Note: This measure is loaded from an external system. (Read only) |
|
Store Ads Run on Press |
Store Ads Run on Press indicates run on press ads exist for this SKU/Store/Day. This measure can be aggregated to provide information regarding the number of locations that are on Ad. Note: This measure is loaded from an external system. (Read only) |
|
Store Available Space |
Store Avail Space represents the remaining space available under the SKU Cap after considering Store Inventory and Expected Receipts over the appropriate time periods. |
|
Store Avg Rate of Sale |
Store Avg Rate of Sale represents an item's average daily rate of sale at a store. Note: This measure is loaded from an external system at the SKU/Store level and spread to the SKU/Store/Day level across the planning horizon. (Read only) |
|
Store Back Orders |
Back Orders shows the SKU/warehouse back order quantity placed on Today. Back Orders is incorporated into the inventory boundaries calculation to increase the warehouse stock level. It represents an increased level of demand and therefore an increased level of inventory visible throughout the plan.) |
|
Store Capped Difference |
The Store Capped Difference is equal to Non-Capped URP - URP on any ATP day. |
|
Store Demand on Source |
The Store Demand on Source is equal to the URP time-shifted backwards based on the lead-time on the receipt day of the URP into the store. |
|
Store Known Demand |
Store Known Demand is the quantity in units of confirmed demand that is known for any reason. Known demand is used in place of the forecast if the known demand is greater than the forecast. Note: This measure is loaded from an external system. (Read only) |
|
Store Loaded Safety Stock History |
Store Loaded Safety Stock History maintains history of the Loaded Safety Stock measure. Note: This measure is loaded from an external system. (Read only) |
|
Store Non-Capped Demand on Source |
The Store Non-Capped Demand on Source is equal to the Non-Capped URP time-shifted backwards based on the lead-time on the receipt day of the URP into the store. |
|
Store Numeric In Scope Indicator |
Store Numeric In Scope Indicator is used in SRP alert processing to determine the alerting store ratio. It represents the number of stores for a SKU that are in-scope (stores which fall between on supply and off supply) during the alert horizon.(Read only) |
|
Store Review Time |
Store Review Time is a calculated measure indicating the number of days until the next delivery. Store Review Time is only calculated on Available to Plan receipt days. (Read only) |
|
Store USA Over Review Time |
Store USA Over Review Time (USART) is the sum of User Specified Allocations over the review time. Store USA Over Review Time is only displayed on Available to Plan receipt days. (Read only) |
|
Store USA Over Review Time Type |
The Store USA Over Review Time Type measure indicates the allocation combination type that is used when regarding the USART quantity as a whole. The first populated USA type in the review time is used as the USART type. Store USA Over Review Time Type Time is only displayed on Available to Plan receipt days. (Read only) |
|
Supplier Compliance Safety Stock - Store |
Supplier Compliance Safety Stock - Store represents additional Safety Stock units added to the calculated Safety Stock. The Supplier Compliance Safety Stock Uplift is calculated as a number of days of demand going forward from the larger of review time or number of inventory selling days. Any positive number, including zero, is valid.
|
|
User Specified Allocation - Store |
User Specified Allocations - Store (USA) are allocations that are defined by you and accounted for in projected inventory. USAs are maintained in the USA workbooks. (Read only) |
This view displays a filtered view of substitution-specific data at the SSKU/SKU/Destination /Day level.
These measures are read-only.
Table 7-53 lists the read-only measure in this view.
This view provides management information related to items with fixed purchase quantities. Information is displayed at the SKU Group/Week level.
Table 6-49 lists the measures in this view.
Table 7-54 Measures: SPQ Analysis Interactive View
| Measure Label | Description |
|---|---|
|
Need Above Order Commit |
A read-only measure calculated as the Order Commit Quantity minus the aggregated unconstrained IRQ. |
|
Need Above Order Commit - What-if |
Read-only measure that initially displays the Need Above Order Commit calculated in the previous AIP Batch Run. If any changes are made to WRP parameters and you select What-if - Unconstrained or What-if - Constrained from the Quick Access toolbar, this measure will be updated with the newly calculated Need Above Order Commit. |
|
Remaining Order Commit Quantity |
The Remaining Order Commit Quantity represents the portion of an SPQ order still available in the current week. This measure is calculated by deducting any executed orders from the order commit quantity for that week. |
|
Remaining Order Commit Quantity - What-if |
Read-only measure that initially displays the Remaining Order Commit Quantity calculated in the previous AIP Batch Run. If any changes are made to WRP parameters and you select What-if - Unconstrained or What-if - Constrained from the Quick Access toolbar, this measure will be updated with the newly calculated Remaining Order Commit Quantity. |
|
SPQ Commitment Type (Expanded) |
The expanded read-only version of the SPQ Commitment Type measure that displays the actual value used in calculations. This is a merge of the global (Dept), default (Sub-class/Destination) and exception (SKU/Destination/Day) levels. |
|
SPQ Commitment Type Exception |
The SPQ Commitment Type is used whenever a Supplier Purchase Quantity (SPQ) has been entered for a SKU. The commitment type indicates how the SPQ should be interpreted. The options are Fixed or Capped. Fixed indicates that the user-specified SPQ quantity may not be exceeded, but it must be ordered in its entirety, regardless of whether there is demand for it. Capped indicates that the user-specified SPQ quantity may not be exceeded, but it need not be ordered if it is not required. Blank indicates that the SPQ will be ignored. |
|
SPQ Order Commit Quantity |
The SPQ Order Commit Quantity contains the Fixed or Capped Purchase Quantity agreed upon with the Vendor. |
|
Vendor Lock Period |
The Vendor Lock Period identifies which weeks are in the vendor lock period. The vendor lock period alerts you that there may be a vendor lock during this period. During this time period you would need to negotiate changes to the SPQ with the supplier. This indicator is for information purposes only and does not affect the replenishment plan calculations. |
|
Supplier Residual Excess Quantity |
Supplier Residual Excess Quantity would be equal to any excess stock that was left at the end of the week for which there were no locations available to receive excess stock (either as a result of inventory capping or no ATP days at suitable destinations. |
|
Supplier Residual Excess Quantity - What-if |
Read-only measure that initially displays the Residual Excess Quantity calculated in the previous AIP Batch Run. If any changes are made to WRP parameters and you select What-if - Unconstrained or What-if - Constrained from the Quick Access toolbar, this measure is updated with the newly calculated Supplier Residual Excess Quantity. |
This view displays the WRP receipt plan and calculation parameters at the SKU Group/Warehouse/Day level. This view contains both:
Default Measures
Table 6-50 lists the measures in this view.
Table 7-55 Measures: Warehouse Receipt Plan Interactive View
| Measure Label | Description |
|---|---|
|
Available To Plan Receipt |
Boolean that indicates the days on which a warehouse may plan a receipt. This is a read-only measure and remains unchanged regardless of which other parameters are changed in the workbook. |
|
Delivery-day Demand Percent (expanded) |
The actual value used in calculations. This is a merge of the multiple levels of Delivery-day Demand Percent. |
|
Baseline Safety Stock % |
Percent of that days demand that is used for baseline Safety Stock. (Read only) |
|
Baseline Safety Stock % Override |
The Baseline Safety Stock % Override measure allows you to override the Baseline Safety Stock % input in the Additional Stock Maintenance Workbook. Any positive number, including zero, is valid. Example: To use 120% of that days demand that as baseline Safety Stock; then in the Override Percent, enter: 1.2. |
|
Baseline Safety Stock (Units) |
Baseline Safety Stock in units calculated from the baseline Safety Stock percent.(Read only) |
|
Baseline Safety Stock (Units) Override |
The Baseline Safety Stock (Units) Override measure allows you to override the Baseline Safety Stock (Units) input in the Additional Stock Maintenance Workbook.Any positive number, including zero, is valid. |
|
Closing Week Inventory |
When the workbook is built, it is crossed out until you roll up the calendar hierarchy to the week level. Provides you with a read-only projection of inventory at the close of business each Saturday night. This is based upon the projected inventory position of the following Sunday. |
|
Contingency Safety Stock % |
Percent of that days demand that is used for contingency Safety Stock. |
|
Contingency Safety Stock % Override |
The Contingency Safety Stock % Override measure allows you to override the Contingency Safety Stock % input in the Additional Stock Maintenance Workbook. Any positive number, including zero, is valid. Example: To use 120% of that days demand that as contingency Safety Stock; then in the Override Percent, enter: 1.2. |
|
Contingency Safety Stock (Units) |
Baseline Safety Stock in units calculated from the contingency Safety Stock percent.(Read only) |
|
Total Forecast Demand |
Aggregated constrained demand from lower level supply chain nodes sourced by the warehouse, plus external demand. This measure has a related filtered worksheet. See the Demand Packsize Details View for more information. |
|
Unconstrained Total Forecast Demand |
Aggregated unconstrained demand from lower level supply-chain nodes sourced by the warehouse, plus external demand. This measure has a related filtered worksheet. See the Demand Packsize Details View for more information. |
|
Demand Forecast History |
Demand Forecast History represents the forecast for the current day, calculated in the prior batch run. Demand Forecast History is used for contingency purposes, if for any reason current forecast data is not available.(Read only) |
|
Expected Receipts |
Read-only measure displaying the sum of On-orders, in-transits and placement quantities. This measure has a related filtered worksheet. See the WH Receipt Packsize Details View for more information. |
|
Unconstrained Forecast Demand Over Review Time |
Read-only measure that displays the demand summed over the review time. If the review time is zero, then the displayed value is zero. This value may change if the stop receiving date is updated. |
|
External Demand |
Demand on the warehouse that is generated outside of AIP. The warehouse is replenished for forecast demand and external demand. |
|
Unmet External Demand |
External demand that is not able to be met by the warehouse because of a warehouse shortage. |
|
Receipt Plan |
Read-only measure which represents the final Constrained Receipt Plan calculated in the most recent batch run. The receipts include any impacts due to Supplier and Container Scaling. This measure has a related filtered worksheet. See the WH Receipt Packsize Details View for more information. |
|
Receipt Plan-Pre-Scaling |
Read-only measure which contains the Constrained Receipt Plan, calculated in the most recent batch run, prior to applying Supplier and Container Scaling Constraints. This measure has a related filtered worksheet. See the WH Receipt Packsize Details View for more information. |
|
Receipt Plan - What-if |
Read-only measure that initially displays the Constrained Receipt Plan (CRP) calculated in the most recent AIP Batch run. If any changes are made to WRP parameters and you select What-if - Unconstrained or What-if - Constrained from the Quick Access toolbar, this measure is updated with the newly calculated CRP for the SKU/Warehouse. What-if does not consider supplier and container scaling constraints. This measure has a related filtered worksheet. See the WH Receipt Packsize Details View for more information. |
|
Hold Back Option |
Read-only measure which indicates whether the hold back quantity should be considered when the batch determines if an order should be generated. Valid values are Reserve Holdback Quantity or Do Not Reserve Holdback Quantity. Reserve Holdback Quantity means that any user-specified Hold Back quantity should be deducted from the On Hand (Net Inventory) position. Do Not Reserve Holdback Quantity OH means that the On Hand (Net Inventory) calculation ignores any Hold Back quantity specified by you. |
|
Hold Back Quantity |
Read-only measure that represents a quantity of inventory to be held in reserve in the warehouse. The value current domain value is displayed and never changes based on user input in the workbook. |
|
Increment Percent (Expanded) |
The expanded read-only version of the Increment Percent measure that displays the actual value used in calculations. This is a merge of the global (Dept), default (Sub-class/Destination) and exception (SKU/Destination/Day) levels. |
|
Increment Percent Exception |
The Increment Percent acts as a multiplier for minimum and maximum stock that is designed to handle temporary fluctuation in demand for items using Min/Max Replenishment Method. An increment percentage factor can be used to temporarily increase or decrease targeted stocking levels without altering the established MIN and MAX values. Any positive number, including zero, is valid. Example: To use 120% of the Min and Max Stock, enter: 1.2. |
|
Inventory Selling Days (Expanded) |
The expanded read-only version of the Inventory Selling Days measure that displays the actual value used in calculations. This is a merge of the global (Dept), default (Sub-class/Destination) and exception (SKU/Destination/Day) levels. |
|
Inventory Selling Days Exception |
The number of days used to sum the forecasted demand for Dynamic and Hybrid replenishment method calculations. Inventory selling days can be used to ensure a minimum number of days of supply are included in the order. Any positive number is valid. Example: To account for three days of demand, enter: 3. |
|
Loaded Safety Stock History |
A read-only historical view of loaded Safety Stock. The value current domain value is displayed and never changes based on user input in the workbook. |
|
Maximum Safety Stock Days (Expanded) |
The expanded read-only version of the Maximum Safety Stock Days measure that displays the actual value used in calculations. This is a merge of the global (Dept), default (Sub-class/Destination) and exception (SKU/Destination/Day) levels. |
|
Maximum Safety Stock Days Exception |
The Maximum Safety Stock Days parameter is used to specify the maximum number of days of cover to be kept on hand as Safety Stock. If you enter both Max Safety Stock Days and Max Safety Stock Units, the Maximum Safety Stock boundary uses the larger of demand over Max Safety Stock Days and Max Safety Stock Units. Any positive integer, including zero, is valid. Example: To ensure the Maximum Safety Stock contains at least 14 days of supply; then in the Max Safety Stock Days, enter: 14. If Max Safety Stock Units is greater than 14 days of supply, max units would be used as the Maximum Safety Stock, otherwise Maximum Safety Stock would be the number of units required to cover 14 days of demand. |
|
Maximum Safety Stock Units (Expanded) |
The expanded read-only version of the Maximum Safety Stock Units measure that displays the actual value used in calculations. This is a merge of the global (Dept), default (Sub-class/Destination) and exception (SKU/Destination/Day) levels. |
|
Maximum Safety Stock Units Exception |
The Maximum Safety Stock Units parameter is used to specify the maximum amount of inventory (in units) to be kept on hand as Safety Stock. If you enter both Max Safety Stock Days and Max Safety Stock Units, the Maximum Safety Stock boundary uses the larger of demand over Max Safety Stock Days and Max Safety Stock Units. Any positive number, including zero, is valid. Example: To ensure the Maximum Safety Stock contains at least 14 days of supply; then in the Max Safety Stock Days, enter: 14. If Max Safety Stock Units is greater than 14 days of supply, max units would be used as the Maximum Safety Stock, otherwise Maximum Safety Stock would be the number of units required to cover 14 days of demand. |
|
Maximum Stock (Expanded) |
The expanded read-only version of the Maximum Safety measure that displays the actual value used in calculations. This is a merge of the global (Dept), default (Sub-class/Destination) and exception (SKU/Destination/Day) levels. |
|
Maximum Stock Exception |
Maximum Stock is only used in the Min/Max Replenishment Method. It represents the maximum stock level in units that are desired on hand to satisfy demand. The receipt plan quantity is calculated to bring Net Inventory up to the specified Maximum Stock level. Any positive number, including zero, is valid. Example: To set a maximum stock of 20 units, enter: 20. |
|
Maximum Time Supply Days (Expanded) |
The expanded read-only version of the Maximum Time Supply Days measure that displays the actual value used in calculations. This is a merge of the global (Dept), default (Sub-class/Destination) and exception (SKU/Destination/Day) levels. |
|
Maximum Time Supply Days Exception |
Maximum Time Supply Days is only used in the Time Supply Replenishment Method. It represents the maximum stock level in terms of a number of days cover that are desired on hand to satisfy demand. The receipt plan quantity is calculated to bring Net Inventory up to Maximum Time Supply Days of cover. Any positive integer, including zero, is valid. Example: To ensure an order brings the inventory level up to 14 days of supply; then in the Max Time Supply Days, enter: 14. |
|
Minimum Acceptable Safety Stock Threshold (Expanded) |
The expanded read-only version of the Acceptable Safety Stock Threshold measure that displays the actual value used in calculations. This is a merge of the global (Dept), default (Sub-class/Destination) and exception (SKU/Destination/Day) levels. |
|
Minimum Acceptable Safety Stock Threshold Exception |
This parameter indicates the percentage of Safety Stock that must be protected when rounding the Ideal Receipt Quantity (IRQ) to an order multiple. The IRQ cannot be rounded down if doing so results in less than the specified percentage of Safety Stock being ordered. Any positive number, including zero, is valid. Example: To protect 40% of Safety Stock, enter: 0.4. |
|
Minimum Safety Stock Days (Expanded) |
The expanded read-only version of the Minimum Safety Stock Days measure that displays the actual value used in calculations. This is a merge of the global (Dept), default (Sub-class/Destination) and exception (SKU/Destination/Day) levels. |
|
Minimum Safety Stock Days Exception |
The Minimum Safety Stock Days parameter is used to specify the minimum number of days of cover to be kept on hand as Safety Stock. If you enter both Min Safety Stock Days and Min Safety Stock Units, the Minimum Safety Stock boundary uses the larger of demand over Min Safety Stock Days and Min Safety Stock Units. Any positive integer, including zero, is valid. Example: To ensure the Minimum Safety Stock contains at least seven days of supply; then in the Min Safety Stock Days, enter: 7. If Min Safety Stock Units is greater than seven days of supply, min units would be used as the Minimum Safety Stock, otherwise Minimum Safety Stock would be the number of units required to cover seven days of demand. |
|
Minimum Safety Stock Units (Expanded) |
The expanded read-only version of the Minimum Safety Stock Units measure that displays the actual value used in calculations. This is a merge of the global (Dept), default (Sub-class/Destination) and exception (SKU/Destination/Day) levels. |
|
Minimum Safety Stock Units Exception |
The Minimum Safety Stock Units parameter is used to specify the minimum amount of inventory to be kept on hand as Safety Stock. If you enter both Min Safety Stock Days and Min Safety Stock Units, the Minimum Safety Stock boundary uses the larger of demand over Min Safety Stock Days and Min Safety Stock Units. Any positive number, including zero, is valid. Example: To ensure the Minimum Safety Stock contains at least seven days of supply; then in the Min Safety Stock Days, enter: 7. If Min Safety Stock Units is greater than seven days of supply, min units would be used as the Minimum Safety Stock, otherwise Minimum Safety Stock would be the number of units required to cover seven days of demand. |
|
Minimum Stock (Expanded) |
The expanded read-only version of the Minimum Stock measure that displays the actual value used in calculations. This is a merge of the global (Dept), default (Sub-class/Destination) and exception (SKU/Destination/Day) levels. |
|
Minimum Stock Exception |
Minimum Stock is only used in the Min/Max Replenishment Method. It represents the minimum stock level in units that are desired on hand to satisfy demand. Min Stock is used in determining the inventory level at which a replenishment is triggered. Any positive number, including zero, is valid. Example: To set a minimum stock level of five days; then enter: 5. |
|
Minimum Time Supply Days (Expanded) |
The expanded read-only version of the Minimum Time Supply Days measure that displays the actual value used in calculations. This is a merge of the global (Dept), default (Sub-class/Destination) and exception (SKU/Destination/Day) levels. |
|
Minimum Time Supply Days Exception |
Minimum Time Supply Days is only used in the Time Supply Replenishment Method. It represents minimum stock level in terms of number of days cover that are desired on hand to satisfy demand. Min Time Supply Days of cover is used in both Safety Stock and RP calculations. Any positive number, including zero, is valid Example: To set a minimum stock level of five days; then enter: 5. |
|
Numeric Actively Replenished |
Read-only measure that indicates the total number of active stores source from this warehouse for this SKU/day. |
|
Original Total Planned Receipts |
Read-only measure that represents the original un-reconciled total planned receipts. This measure has a related filtered worksheet. See the WH Receipt Packsize Details View for more information. |
|
Original Total Planned Receipts - What-if |
Read-only measure that initially displays the un-reconciled, un-scaled total planned receipts (URP) calculated in the most recent AIP Batch run. If any changes are made to WRP parameters and you select What-if - Unconstrained or What-if - Constrained from the Quick Access toolbar, this measure is updated with the newly calculated URP for the SKU/Warehouse. This measure has a related filtered worksheet. See the WH Receipt Packsize Details View for more information. |
|
Projected Days of Supply On Hand At Stores (at Stocking Point) |
Read-only measure that displays a projection of the number of days of inventory on hand at stores that are supplied by the current warehouse. This number is determined by taking the summed projected inventory of the stores and dividing it by the summed average rate of sale. The calculated value changes based on the calculation of Stores Projected Inventory. |
|
Projected Inventory |
The Projected Inventory (PI) is calculated in batch and represents a projection of the opening inventory position for any day in the planning horizon at a specific warehouse. None of that day's activities (either receipts or demand) are reflected in PI, and so it is often referred to as a beginning of day position. PI on a given day is calculated as the PI of the previous day plus the net impact of all forecasted demand and expected and planned receipts on the previous day. The planned receipts include scaled purchase orders. This read-only measure displays the PI calculated in the most recent AIP Batch run. This measure has a related filtered worksheet. See the Inventory Packsize Details View for more information. |
|
Projected Inventory - Pre-Scaling |
The Projected Inventory (PI) is calculated in batch and represents a projection of the opening inventory position for any day in the planning horizon at a specific warehouse. None of that day's activities (either receipts or demand) are reflected in PI, and so it is often referred to as a beginning of day position.PI on a given day is calculated as the PI of the previous day plus the net impact of all forecasted demand and expected and planned receipts on the previous day. The planned receipts are pre-scaling receipt quantities. This read-only measure displays the pre-scaling PI calculated in the most recent AIP Batch run. This measure has a related filtered worksheet. See the Inventory Packsize Details View for more information. |
|
Projected Inventory - What-if |
Read-only measure that initially displays the Projected Inventory (PI) calculated in the most recent AIP Batch run. If any changes are made to WRP parameters and you select What-if - Unconstrained or What-if - Constrained from the Quick Access toolbar, this measure is updated with the newly calculated PI for the SKU/Warehouse. What-if does not consider supplier and container scaling constraints. This measure has a related filtered worksheet. See the Inventory Packsize Details View for more information. |
|
Receipt Point |
The Warehouse Receipt Point (RP) represents the inventory level below which an order should be triggered. Its calculation depends upon the selected Replenishment Method. The RP is only calculated on Available to Plan receipt days. This read-only measure displays the RP calculated in the most recent AIP Batch run. |
|
Receipt Point - What-if |
Read-only measure that initially displays the Receipt Point (RP) calculated in the previous AIP Batch run. If any changes are made to WRP parameters and you select What-if - Unconstrained or What-if - Constrained from the Quick Access toolbar, this measure is updated with the newly calculated RP for the SKU/Warehouse. |
|
Receive Up to Level |
The warehouse Receive Up to Level (RUTL) represents the target inventory level when an order is generated. Its calculation depends upon the selected Replenishment Method. RUTL is only calculated on Available to Plan receipt days. |
|
Receive Up to Level - What-if |
Read-only measure that initially displays the Receive Up to Level calculated in the most recent AIP Batch run. If any changes are made to WRP parameters and you select What-if - Unconstrained or What-if - Constrained from the Quick Access toolbar, this measure is updated with the newly calculated RUTL for the SKU/Warehouse. |
|
Reconciliation Adjustment |
A read-only measure indicating the difference between the Constrained Receipt Plan and the Unconstrained Receipt Plan. |
|
Reconciliation Adjustment - What-if |
Read-only measure that initially displays the Reconciliation Adjustment calculated in the previous AIP Batch run. If any changes are made to WRP parameters and you select What-if - Constrained from the Quick Access toolbar, this measure is updated with the newly calculated Reconciliation Adjustment for the SKU/Warehouse. If you select What-if - Unconstrained, this measure should be set to zero. |
|
Replenishment Method (Expanded) |
The expanded read-only version of the Replenishment Method measure that displays the actual value used in calculations. This is a merge of the global (Dept), default (Sub-class/Destination) and exception (SKU/Destination/Day) levels. |
|
Replenishment Method Exception |
The choice of Replenishment Method determines the type of calculations that is used in generating a warehouse replenishment plan. Blank indicates the system preset value of No Replenishment. You select the Replenishment Method from the following options:
|
|
Review Time |
This read-only measure is only populated for days that are available to plan. It indicates the number of days between the point that a delivery on the current ATP days can be used to satisfy demand and the point at which a delivery on the next ATP day becomes available to meet demand. This period of time identifies the number of days that are the exclusive responsibility of the current ATP day. |
|
Round Up Threshold (Expanded) |
The expanded read-only version of the Round Up Threshold measure that displays the actual value used in calculations. This is a merge of the global (Dept), default (Sub-class/Destination) and exception (SKU/Destination/Day) levels. |
|
Round Up Threshold Exception |
The Rounding Threshold represents the percentage of the last order multiple above which the Ideal Replenishment Quantity is rounded up and below which it is rounded down. Valid values are zero (0) through one (1). Example: To round up when the remaining part of the IRQ is more than 25 percent of an order multiple, then in the Rounding Threshold, enter: 0.25. |
|
Safety Stock |
Safety Stock (SS) is inventory held at a location to mitigate the risks of stock outs caused by variability in forecasted demand. The calculated to determine Safety stock is dependent upon the selected Replenishment Method. All replenishment methods allow the SS to be bound by minimum and maximum values. Store SS is only calculated on Available to Plan receipt days and is read-only. |
|
Safety Stock - What-if |
Read-only measure that initially displays the Safety Stock calculated in the previous AIP Batch run. If any changes are made to WRP parameters and you select What-if - Unconstrained or What-if - Constrained from the Quick Access toolbar, this measure is updated with the newly calculated SS for the SKU/Warehouse. |
|
Service Level (Expanded) |
The expanded read-only version of the Service Level measure that displays the actual value used in calculations. This is a merge of the global (Dept), default (Sub-class/Destination) and exception (SKU/Destination/Day) levels. |
|
Service Level Exception |
Service Level is used in the SS calculations for the Dynamic Replenishment method. It is defined as the percentage of unit demand that should be met by inventory. Valid values are zero (0) through one (1). Example: To carry enough SS to maintain a 90% customer service level, then in the Service Level Exception, enter: 0.90. |
|
Source Order Multiple |
Read-only measure that displays the order multiple used when placing orders on the source. This measure cannot be impacted through changes made by you in the workbook. |
|
Stores Projected Inventory |
Represents the read-only summation of projected inventory of all stores sourced from the warehouse. This value changes due to parameter changes made by you. |
|
Time Supply Horizon (Expanded) |
The expanded read-only version of the Time Supply Horizon measure that displays the actual value used in calculations. This is a merge of the global (Dept), default (Sub-class/Destination) and exception (SKU/Destination/Day) levels. |
|
Time Supply Horizon Exception |
The Time Supply Horizon parameter is only used in the Time Supply Replenishment method. If a time supply horizon is specified, the rate of sale is used instead of the actual forecast when calculating demand over the time supply days for inventory target level calculations. Any positive integer is valid. Example: To calculate a Rate of Sale (ROS) over a one week period; then in the Time Supply Horizon, enter: 7. The ROS is then calculated by summing the forecasted sales over the seven days and dividing that number by seven. |
|
Total ARS |
A read-only summation of Average Rate of Sale (ARS) for stores source from this warehouse plus Warehouse Independent ARS. |
|
Total Store Average Rate of Sales |
A read-only summation of Average Rate of Sale (ARS) for stores source from this warehouse. |
|
Warehouse AWS Factor (Expanded) |
The expanded read-only version of the Warehouse AWS Factor measure that displays the actual value used in calculations. This is a merge of the global (Dept), default (Sub-class/Destination) and exception (SKU/Destination/Day) levels. |
|
Warehouse AWS Factor Exception |
Used only in the Average Weekly Sales (AWS) Replenishment Method, this factor is multiplied by the AWS to produce target stock levels. Any positive value is valid. Example: To multiple the ARS by a factor of two, enter: 2. |
|
Warehouse Maximum (Expanded) |
The expanded read-only version of the Warehouse Maximum measure that displays the actual value used in calculations. This is a merge of the global (Dept), default (Sub-class/Destination) and exception (SKU/Destination/Day) levels. |
|
Warehouse Maximum Exception |
This represents the Maximum SS boundary for the Loaded SS, Sales Week Range, Factor ARS and Factor AWS Replenishment methods. Any positive value is valid. Example: To set a Maximum SS boundary of six units, enter: 6. |
|
Warehouse Minimum (Expanded) |
The expanded read-only version of the Warehouse Minimum measure that displays the actual value used in calculations. This is a merge of the global (Dept), default (Sub-class/Destination) and exception (SKU/Destination/Day) levels. |
|
Warehouse Minimum Exception |
This represents the Minimum SS Boundary for the Loaded SS, Sales Week Range, Factor ARS and Factor AWS Replenishment methods. Any positive value, including zero, is valid. Example: To set a Minimum SS boundary of two units, enter: 2. |
|
Warehouse Net Inventory |
Warehouse Net Inventory (NI) is calculated in batch and is a prediction of the inventory position at the end of review time. It represents what inventory is available to meet demand over the period. The NI calculation is based on the Projected Inventory position, which includes scaled receipts, at the beginning of the period. It then considers the impact of Expected Receipts (ER) and Expected Spoilage (ES) over the review time. Warehouse Net Inventory is only calculated on Available to Plan receipt days, and is compared to the Receipt Point Boundary in order to establish if a receipt is required. Important: While it is possible to rollup Net Inventory across the time dimension, it is not recommended. Aggregation over time does not produce a meaningful result since the calculation of Net Inventory involves the summation of data over review times which do not correlate with positions in the calendar hierarchy. |
|
Warehouse Net Inventory - Pre-scaling |
Warehouse Net Inventory (NI) is calculated in batch and is a prediction of the inventory position, before the affects of scaling, at the end of review time. It represents what inventory is available to meet demand over the period. The NI calculation is based on the Pre-Scaling Projected Inventory position at the beginning of the period, then considering the impact of Expected Receipts (ER) and Expected Spoilage (ES) over the review time. Warehouse Net Inventory is only calculated on Available to Plan receipt days, and is compared to the Receipt Point Boundary in order to establish if a receipt is required. Important: While it is possible to rollup Net Inventory across the time dimension, it is not recommended. Aggregation over time does not produce a meaningful result since the calculation of Net Inventory involves the summation of data over review times which do not correlate with positions in the calendar hierarchy. |
|
Warehouse Net Inventory - What-if |
Read-only measure that initially displays the Warehouse Net Inventory calculated in the most recent AIP Batch run. If any changes are made to WRP parameters and you select What-if - Unconstrained or What-if - Constrained from the Quick Access toolbar, this measure is updated with the newly calculated NI for the SKU/Warehouse. What-if does not consider supplier and container scaling constraints. Important: While it is possible to rollup Net Inventory across the time dimension, it is not recommended. Aggregation over time does not produce a meaningful result since the calculation of Net Inventory involves the summation of data over review times which do not correlate with positions in the calendar hierarchy. |
|
WH Independent ARS |
A read-only measure indicating the externally loaded Average Rate of Sale (ARS) assigned to the warehouse. This is independent of any ARS summed from the store level. |
Hidden Measures
Table 6-51 lists the measures in this view that are hidden when using the default template. They can be displayed and maintained by using the Insert measure function of RPAS. Hidden measures may also be added to the template during configuration.
Table 7-56 Hidden Measures: Warehouse Receipt Plan Interactive View
| Measure Label | Description |
|---|---|
|
Warehouse Capped Demand |
Warehouse Capped Demand is displayed at the SKU Group level and is calculated by aggregating the Warehouse Capped Demand at SKU-pack/Destination /Day level for all SKU-packs in a SKU Group. |
|
Warehouse Capped Demand - What-if |
Warehouse Capped Demand - What-if is the resulting value after What-if calculations have been performed on the Warehouse Capped Demand measure. This measure has a related filtered worksheet. See Demand Packsize Details View for more information. |
|
Warehouse Capped PI |
Warehouse Capped PI is calculated using the standard PI equation: PIt = Max (PIt-1 + ERt-1 - Dmdt-1 + PRt-1 - ESt-1 - COt-1, 0) Where Dmdt = Capped Demand (demand based on CRPs into the destinations) for any day t PRt = Planned Receipts (Receipt Plan) at the warehouse for any day t Both Dmdt and PRt would represent aggregate values at the SKUGroup level for all SKU-packs belonging to that SKU Group. This measure has a related filtered worksheet. See Inventory Packsize Details View for more information. |
|
Warehouse Capped PI - What-if |
Warehouse Capped PI - What-if is a read-only measure that represents the projected inventory using the demand adjusted by SKU caps at the store. If any changes are made to WRP parameters and you select What-if - Unconstrained or What-if - Constrained from the What-if option on the menu bar, this measure is updated with the newly calculated Capped PI for the SKU/Warehouse. This measure has a related filtered worksheet. See Inventory Packsize Details View for more information. |
|
Warehouse Demand(Capped) Difference |
Warehouse Demand (Capped) Difference is equal to Warehouse Non-Capped Demand at SKUG/Destination /Day - Warehouse Demand SKUG/Destination /Day. |
|
Warehouse Residual Qty (Stockless) |
Warehouse Residual Quantity is equal to any excess stock that was left at the end of day for which there were no locations available to receive excess stock, either because of inventory capping, because there are no ATP days, or for any other reason. After stockless processing for the day, this quantity can be calculated as follows: ResidualQty(t) = Max(PI(t) + ER(t) + CRP(t) - Dmd(t), 0) (essentially the PI calculation for day t+1) This measure has a related filtered worksheet. See Inventory Packsize Details View for more information. |
|
Warehouse Residual Excess Quantity - What-if |
Warehouse Residual Excess Quantity - What-if is the resulting value after the What-if calculations have run on the Warehouse Residual Excess Quantity. |
|
Supplier Compliance Safety Stock Uplift (Read only) |
Supplier Compliance Safety Stock Uplift represents the amount in units of additional that should be carried to account for poor Supplier Delivery Performance. |
This view displays a filtered view of warehouse receipt packsizes at the SKU Pack Size/Destination/Day level.
These measures are read-only.
Table 7-57 lists the read-only measures in this view.
Table 7-57 Measures: WH Receipt Packsize Details
| Measure Label | Description |
|---|---|
|
Expected Receipts |
Expected Receipts uses historical expected receipts if prior to today; otherwise, the value represents on orders plus in transits plus placement. Value changes based on user input for Warehouse Stop Receiving Date in the workbook. |
|
Receipt Plan |
The Receipt Plan represents the Final Constrained Receipt Plan calculated in the most recent batch run. The receipts include any impacts due to scaling to Supplier Minimums and Container Minimums. |
|
Receipt Plan – Pre-Scaling |
The Receipt Plan – Pre-Scaling contains the Constrained Receipt Plan, calculated in the most recent batch run, prior to applying Supplier Minimums and Container Constraints. |
|
Receipt Plan – What-if |
This Receipt Plan – What-if measure initially displays the Pre-scaling Constrained Receipt Plan calculated in the most recent AIP Batch run. If any changes are made to WRP parameters and you select What-if – Unconstrained or What-if – Constrained from the What-if option on the menu bar, this measure is updated with the newly calculated CRP for the SKU/Warehouse. |
|
Original Total Planned Receipts |
The Original Total Planned Receipts represents the original un-reconciled total planned receipts calculated in the most recent batch run. |
|
Original Total Planned Receipts – What-if |
This Original Total Planned Receipts – What-if measure initially displays the un-reconciled total planned receipts calculated in the most recent AIP Batch run. If any changes are made to WRP parameters and you select What-if – Unconstrained or What-if – Constrained from the What-if option on the menu bar, this measure is updated with the newly calculated URP for the SKU/Warehouse. |