| Oracle® Retail Process Orchestration and Monitoring Guide 3.0 E98616-01 |
|

 Previous |
The Process Orchestration and Monitoring application is a user interface for scheduling, tracking and managing, both nightly as well as intraday batch jobs.
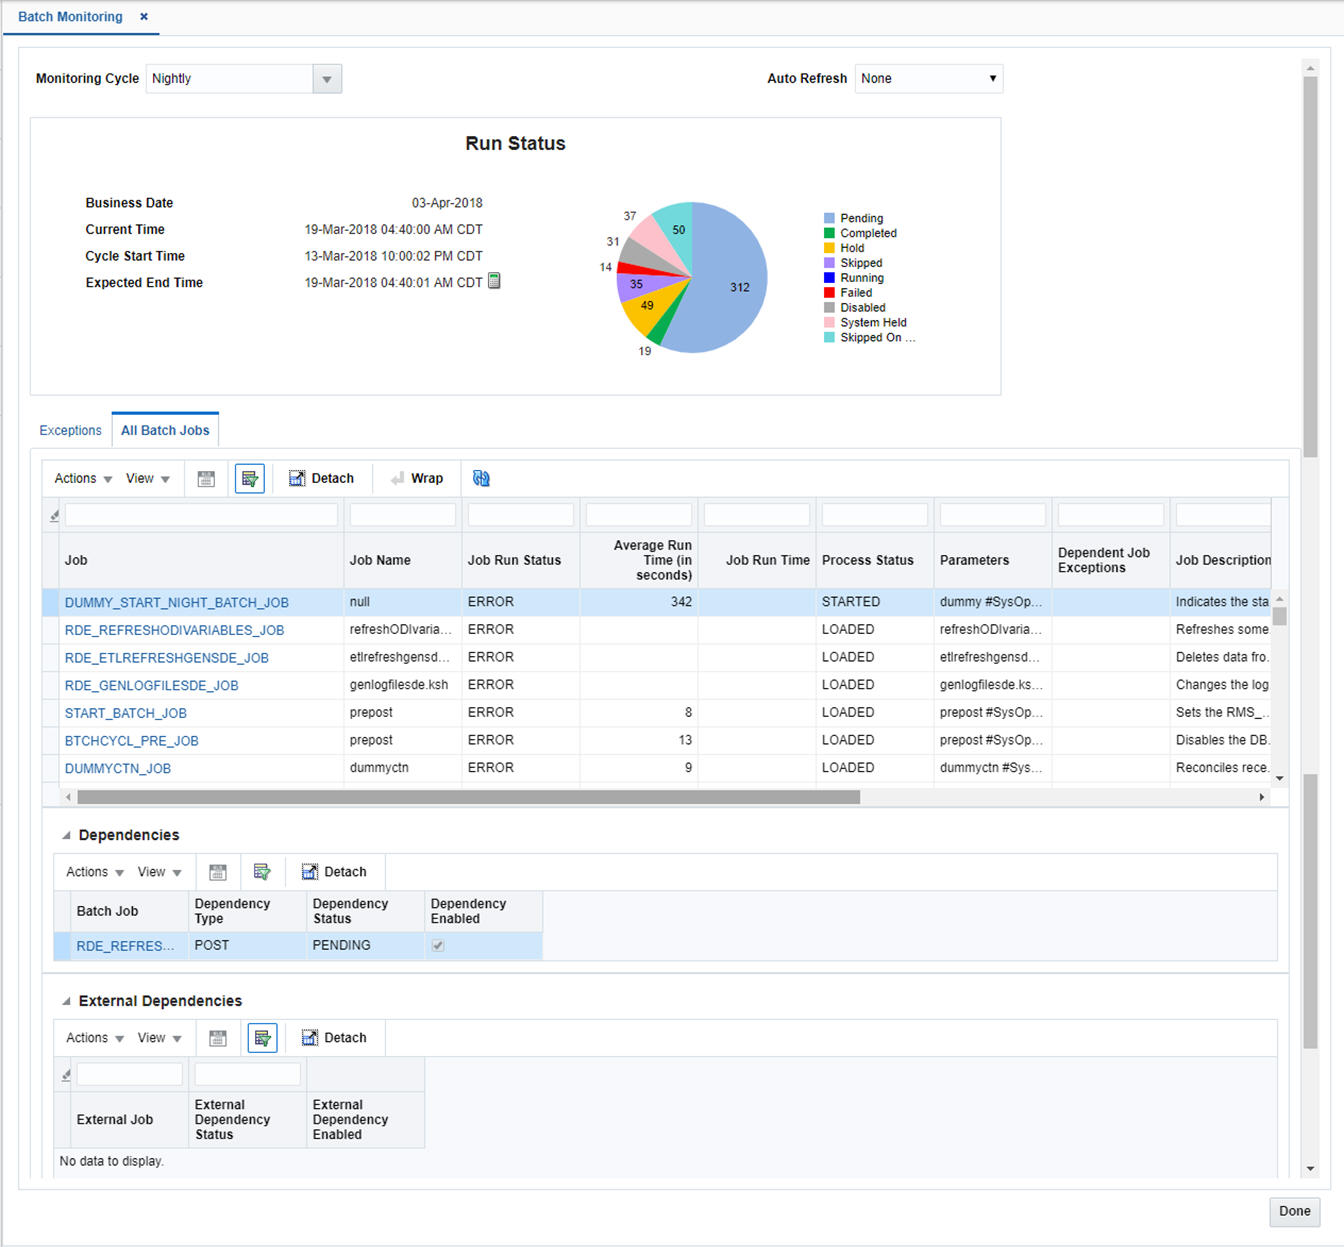
The Batch Monitoring window provides a runtime view of the statuses and dependencies with regard to the different batch cycles running on the current business day.
To access the Batch Monitoring window from the Tasks menu, select Batch Monitoring. The Batch Monitoring window appears.
The Batch Monitoring window contains the following sections.
In the Header section select the monitoring cycle you want to view. The Monitoring Cycle field lists all batch cycles configured for a business day, including the Nightly batch cycle and the Adhoc cycle. When you choose a monitoring cycle the window shows the results specific to the selected cycle. When you open the window, the monitoring cycle defaults to the current or last run cycle for the current business day.
The screen can be set to auto refresh periodically by selecting the pre-defined interval from the Auto Refresh list. By default, this value is set to None on page load which means the Auto Refresh is turned off.
The Header section also contains a Run Status area, displaying the current business date, the current time, the start time of the selected cycle and the expected end time of the selected cycle, if the cycle has not yet been completed, or the actual end time, if the cycle has already been completed. Use the Calculate icon to calculate the expected end time.
In addition, the Run Status area shows a chart summary of the status of the different batches that are included in the selected cycle. The possible statuses are listed below:
Pending
Completed
Hold
Skipped
Running
Failed
Disabled
System Held
Skipped on Error
The chart also shows the actual number of batch jobs in each of the status bins listed above.
The Exceptions section lists all jobs that have failed, are on hold, long running or have been forced to be completed in the current day's run.
The table displays the following columns by default:
Job
Job Name
Run Status
Average Run Time - Average run time for the batch job for the last month
Job Start Time
Error Time
Held Time
Parameters
Dependent Batch Exceptions
Additionally, the following optional columns are available and can be managed in the View Menu by selecting Columns > Manage Columns.
Batch Description
Job Wrapper Name
Run Time (Last Run)
Process
Process Flow Status
Operational Notes
Application
Use the Actions Menu and icons to apply actions to the table. You can perform the actions listed below.
Table 2-1 Exceptions - Actions Menu/Icons and Description
| Actions Menu/Icons | Description |
|---|---|
|
Export to Excel and Export to Excel icon |
You can export the records in the table to a Microsoft Excel spreadsheet by selecting Actions > Export to Excel or by using the Export to Excel icon |
|
View Cycle History |
Opens the View Cycle History window. This option is only enabled for intraday cycles to view execution logs for the job across the different enabled intraday cycles. Click OK to close the View Cycle History window. Not available in the Dependencies and External Dependencies section. |
|
Refresh icon |
Use the Refresh icon Not available in the Dependencies and External Dependencies section. |
|
Wrap icon |
You can wrap the values in the table column by first clicking the column on which you would like the text to wrap and then using the Wrap icon Not available in the Dependencies and External Dependencies section. |
You can customize the view of the table by using the options in the View Menu.
Table 2-2 Exceptions - View Menu/Icons and Description
| View Menu/Icons | Description |
|---|---|
|
Columns |
You can manage which of the columns will be shown in the table by clicking the Show All and Manage Columns options. |
|
Detach and Detach icon |
You can view the tables in the application in a separate window by clicking Detach or by using the Detach icon |
|
Sort |
You can sort columns by the following options:
|
|
Reorder Columns |
You can reorder columns by clicking the Reorder Columns option. |
|
Query by Example and Query by Example icon |
You can filter the items by one or multiple column values by clicking the Query by Example option or by using the Query by Example icon |
The All Batch Jobs section lists all the batch jobs and their statuses. The table displays the following information:
Job
Job Name
Run Status
Possible run statuses are:
Pending
Completed
Hold
Skipped
Running
Failed
Disabled
System Held
Skipped on Error
Average Run Time - Average run time for the batch job for the last month
Job Start Time
Job End Time
Job Run Time
Parameters
Dependent Batch Exceptions
The Dependent Batch Exceptions column indicates whether or not a dependent batch exists. This field displays the parent job in exception status, such as ERROR or HOLD.
Additionally, the following optional columns are available and can be managed in the View Menu by selecting Columns > Manage Columns.
Batch Description
Job Wrapper Name
Run Time (Last Run)
Process
Process Flow Status
Operational Notes
Application
Use the Actions Menu and icons to apply actions to the table, see Table 2-1, "Exceptions - Actions Menu/Icons and Description" for more information.
You can customize the view of the table by using the options in the View Menu, see Table 2-2, "Exceptions - View Menu/Icons and Description" for more information.
The Dependencies section contains post and pre –dependencies for any row selected in the Exceptions or All Batch Jobs section. The dependencies are displayed at a batch job level. The table displays the name of the batch job, the dependency type and the status of the batch job for the current day's run, as well as the Dependency Enabled checkbox.
The Dependency Enabled checkbox indicates whether the dependency was respected or bypassed in the current day's run.
Use the Actions Menu and icons to apply actions to the table, see Table 2-1, "Exceptions - Actions Menu/Icons and Description" for more information.
You can customize the view of the table by using the options in the View Menu, see Table 2-2, "Exceptions - View Menu/Icons and Description" for more information.
If your system is configured to support external dependencies, the External Dependencies section is displayed.
The External Dependencies section lists external batch job dependencies. The table displays the external job, the external dependency status, as well as the External Dependency Enabled checkbox.
Use the Actions Menu and icons to apply actions to the table, see Table 2-1, "Exceptions - Actions Menu/Icons and Description" for more information.
You can customize the view of the table by using the options in the View Menu, see Table 2-2, "Exceptions - View Menu/Icons and Description" for more information.