| Oracle® Retail Process Orchestration and Monitoring Classic User Guide Release 19.1 F33296-01 |
|

 Previous |
| Oracle® Retail Process Orchestration and Monitoring Classic User Guide Release 19.1 F33296-01 |
|
Previous |
The Process Orchestration and Monitoring application is a user interface for scheduling, tracking and managing, both nightly as well as intraday batch jobs.
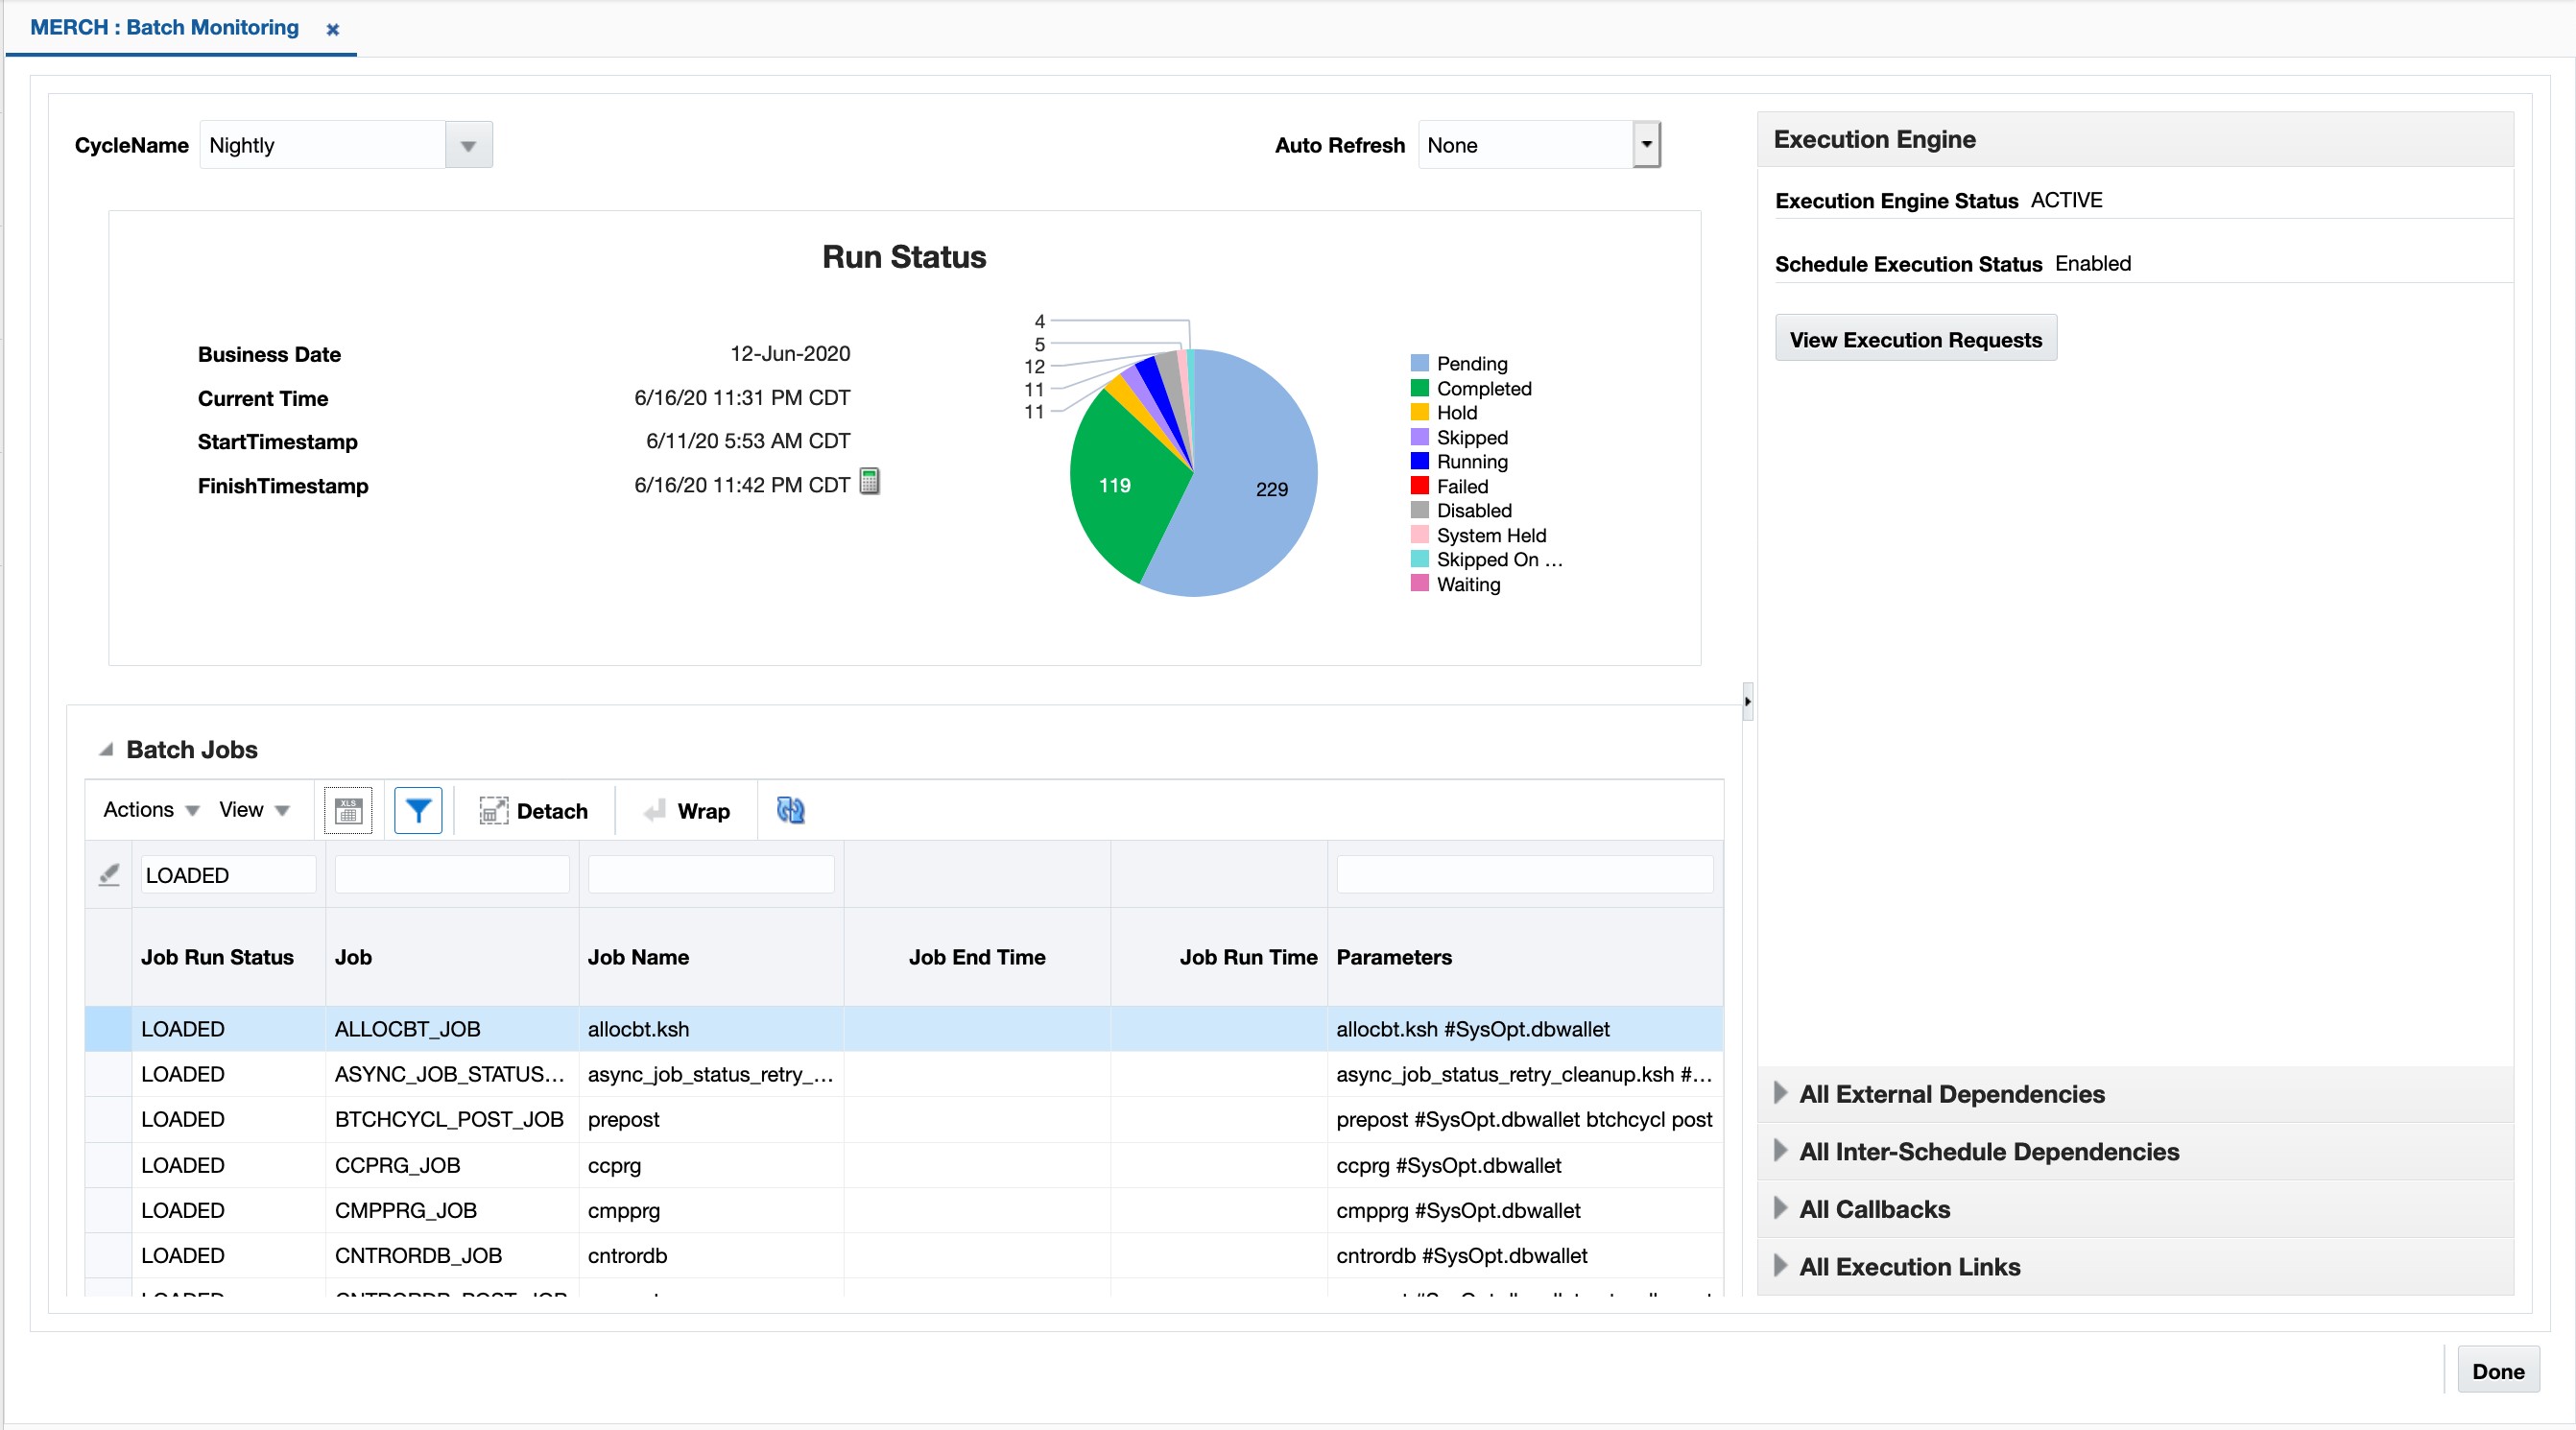
The Batch Monitoring window provides a runtime view of the statuses and dependencies with regard to the different batch cycles running on the current business day.
To access the Batch Monitoring window from the Tasks menu, select Batch Monitoring. The Batch Monitoring window appears.
The Batch Monitoring window contains the following sections.
In the Header section select the monitoring cycle you want to view. The Monitoring Cycle field lists all batch cycles configured for a business day, including the Nightly batch cycle and the Adhoc cycle. When you choose a monitoring cycle the window shows the results specific to the selected cycle. When you open the window, the monitoring cycle defaults to the current or last run cycle for the current business day.
The screen can be set to auto refresh periodically by selecting the pre-defined interval from the Auto Refresh list. By default, this value is set to None on page load which means the Auto Refresh is turned off.
The Header section also contains a Run Status area, displaying the current business date, the current time, the start time of the selected cycle and the expected end time of the selected cycle, if the cycle has not yet been completed, or the actual end time, if the cycle has already been completed. Use the Calculate icon to calculate the expected end time. The StartTimestamp and FinishTimestamp of the cycle will be displayed only on after selecting the Calculate icon.
In addition, the Run Status area shows a chart summary of the status of the different batches that are included in the selected cycle. The possible statuses are listed below:
Pending
Completed
Hold
Skipped
Running
Failed
Disabled
System Held
Skipped on Error
Waiting - Jobs that are waiting for completion of pre-dependencies (Hourly Cycle, Nightly Cycle, External Dependency and Inter-Schedule Predecessor Jobs).
The chart also shows the actual number of batch jobs in each of the status bins listed above.
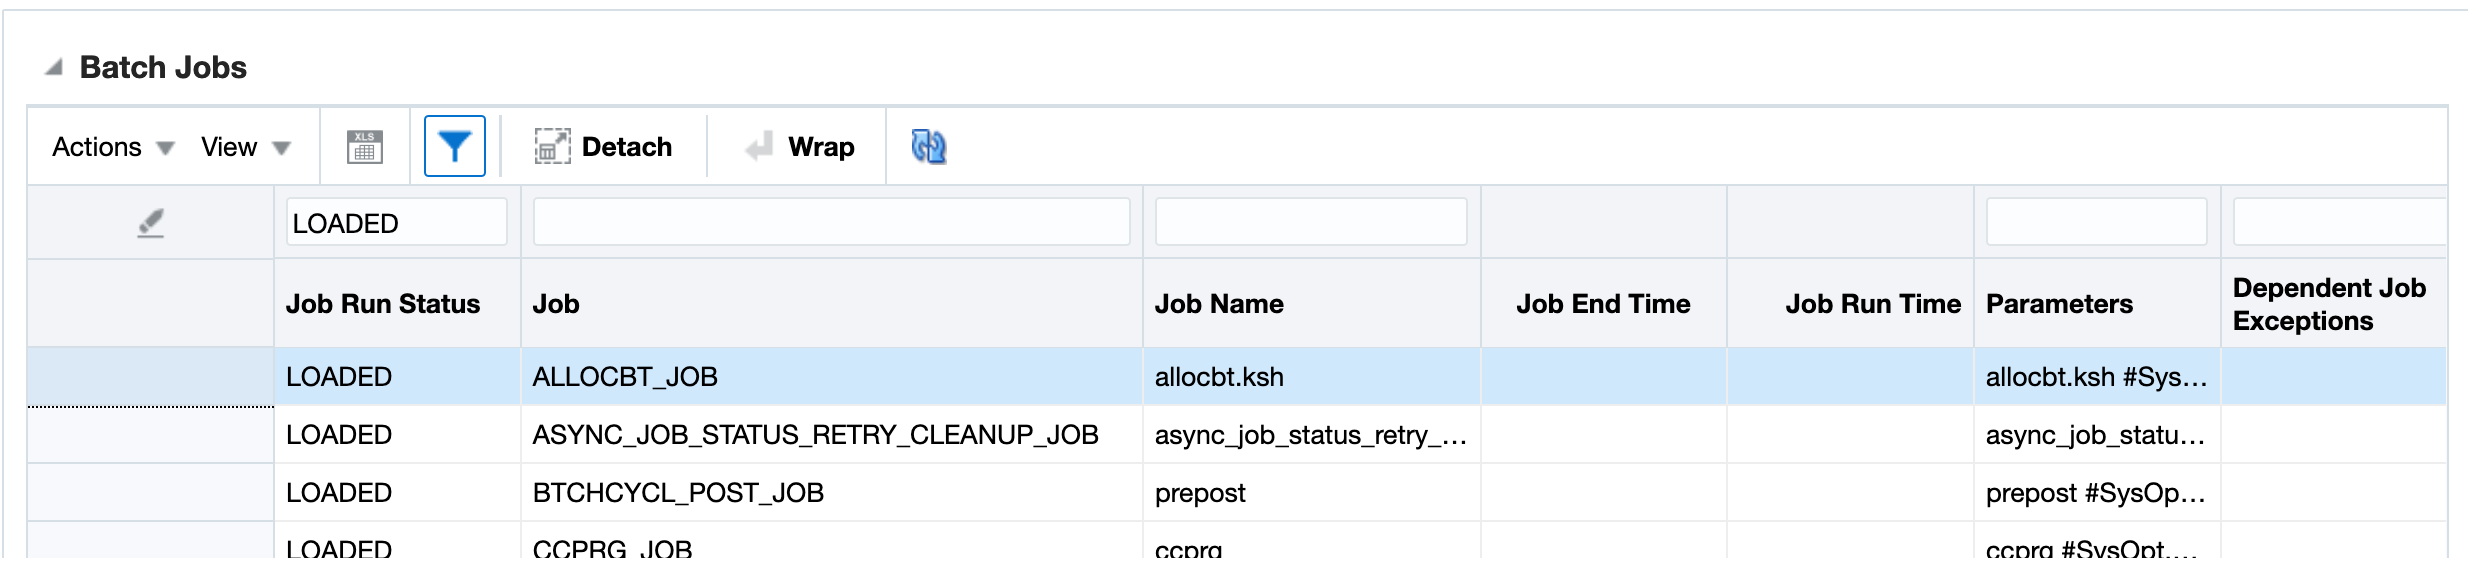
The All Batch Jobs section lists all the batch jobs and their statuses. The table displays the following information:
Job
Job Name
Job Run Status
Possible run statuses are:
Pending
Completed
Hold
Skipped
Running
Failed
Disabled
System Held
Skipped on Error
Job Run Time
Job End Time
Parameters
Dependent Job Exceptions
The Dependent Batch Exceptions column indicates whether or not a dependent batch exists. This field displays the parent job in exception status, such as ERROR or HOLD.
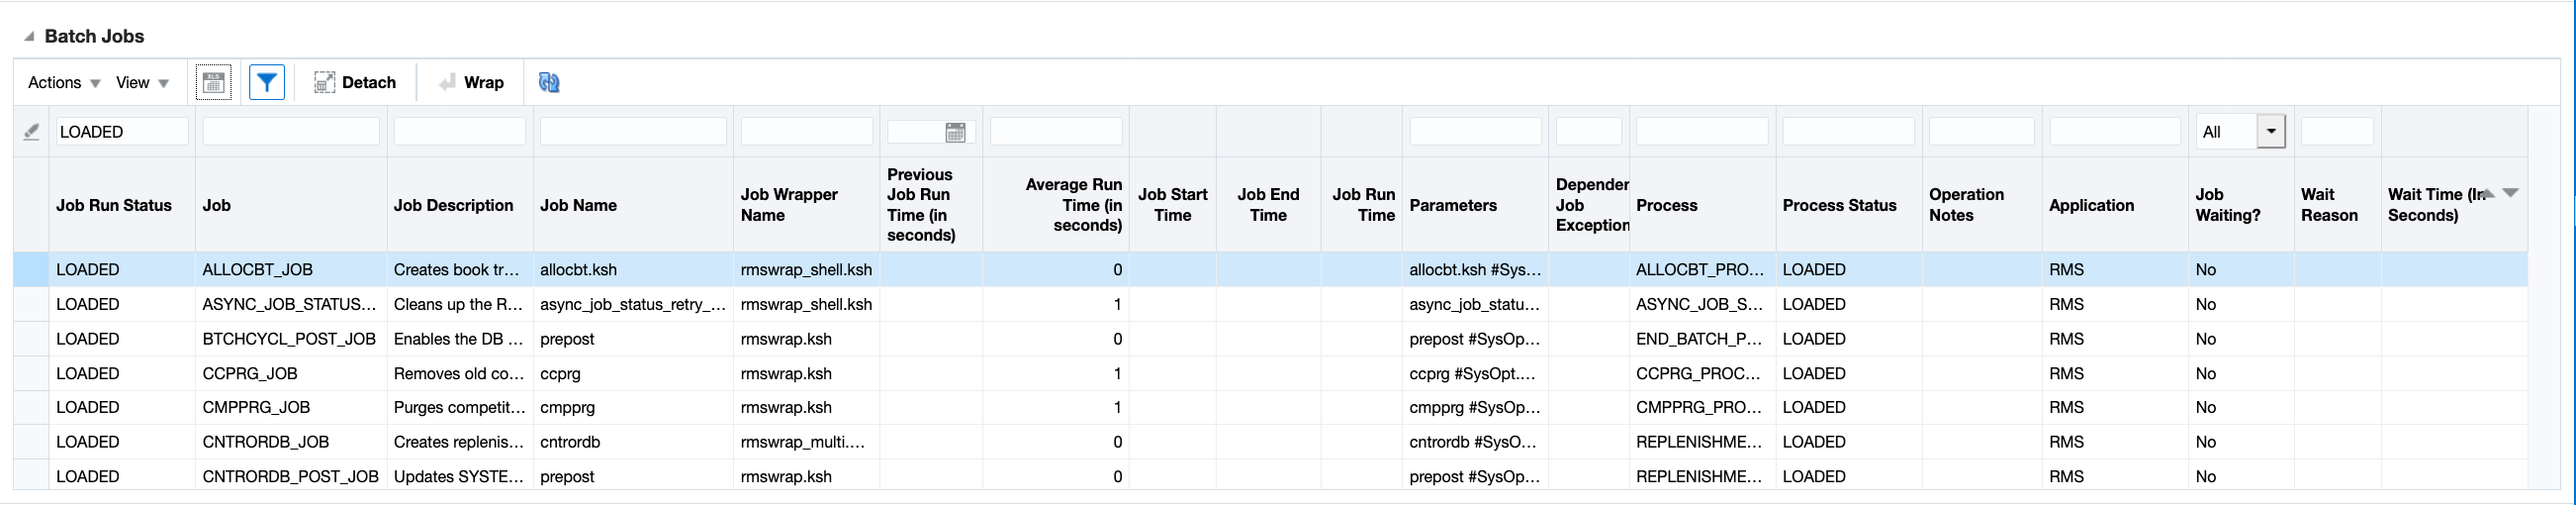
Additionally, the following optional columns are available and can be managed in the View Menu by selecting Columns > Manage Columns.
Job Description
Job Wrapper Name
Previous Job Run Time (in seconds)
Average Run Time (in seconds) - Average run time for the batch job for the last month
Job Start Time
Process
Process Status
Operational Notes
Application
Job Waiting? - Waiting indicator
Wait Reason
Wait Time (In Seconds)
Use the Actions Menu and icons to apply actions to the table. You can perform the actions listed below.
Table 2-1 Batch Jobs - Actions Menu/Icons and Description
| Actions Menu/Icons | Description |
|---|---|
|
Export to Excel and Export to Excel icon |
You can export the records in the table to a Microsoft Excel spreadsheet by selecting Actions > Export to Excel or by using the Export to Excel icon |
|
View Audit Trail |
Opens the View Audit Trail window. This option is to see the applications logs. Any user added comments, actions taken, communications between JOS, POM, and so on will be viewed here. Click OK to close the View Audit Trail window. Not available in the Dependencies and External Associations sections. |
|
View Cycle History |
Opens the View Cycle History window. This option is only enabled for intraday cycles to view execution logs for the job across the different enabled intraday cycles. Click OK to close the View Cycle History window. Not available in the Dependencies and External Associations sections. |
|
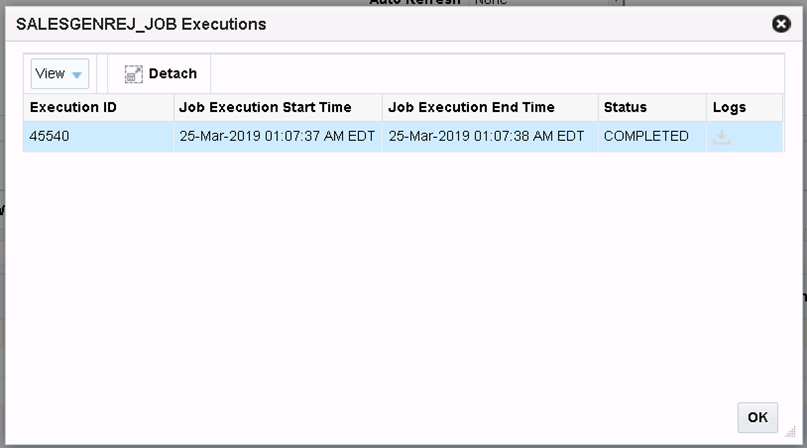
View Job Executions |
Opens the <JOB_NAME> Executions window. This option is to view all the executions of a Job for the current Scheduler Day. Click OK to close the <JOB_NAME> Executions window. Not available in the Dependencies and External Associations sections. |
|
Refresh icon |
Use the Refresh icon Not available in the Dependencies and External Associations section. |
|
Wrap icon |
You can wrap the values in the table column by first clicking the column on which you would like the text to wrap and then using the Wrap icon Not available in the Dependencies and External Associations section. |
You can customize the view of the table by using the options in the View Menu.
Table 2-2 Batch Jobs - View Menu/Icons and Description
| View Menu/Icons | Description |
|---|---|
|
Columns |
You can manage which of the columns will be shown in the table by clicking the Show All and Manage Columns options. |
|
Detach and Detach icon |
You can view the tables in the application in a separate window by clicking Detach or by using the Detach icon |
|
Sort |
You can sort columns by the following options:
|
|
Reorder Columns |
You can reorder columns by clicking the Reorder Columns option. |
|
Query by Example and Query by Example icon |
You can filter the items by one or multiple column values by clicking the Query by Example option or by using the Query by Example icon |
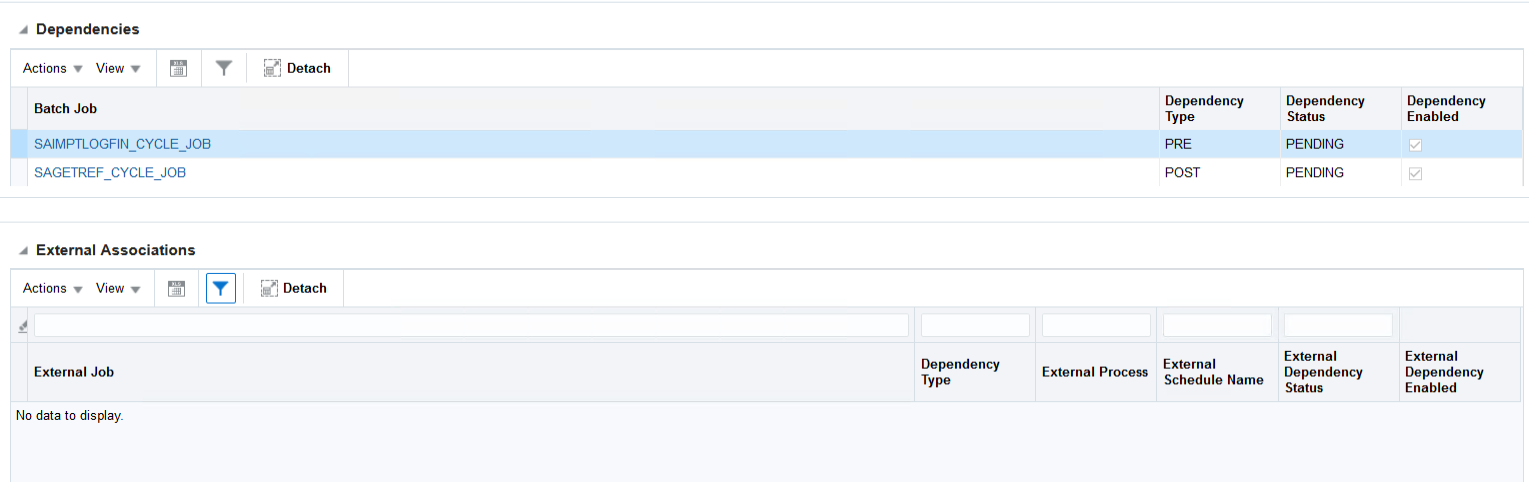
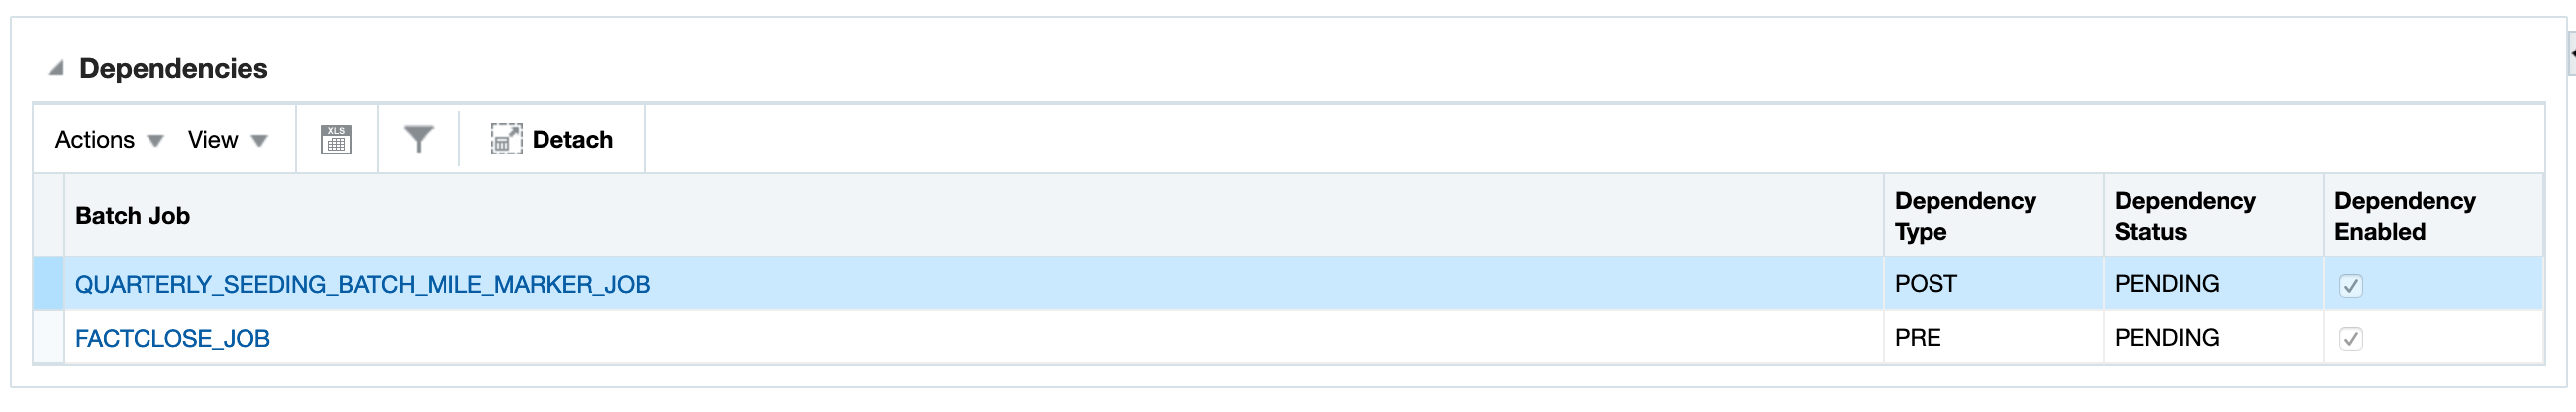
The Dependencies section contains post and pre-dependencies for any row selected in the Batch Jobs section. The dependencies are displayed at a batch job level. The table displays the name of the batch job, the dependency type and the status of the batch job for the current day's run, as well as the Dependency Enabled checkbox.
The Dependency Enabled checkbox indicates whether the dependency was respected or bypassed in the current day's run.
Use the Actions Menu and icons to apply actions to the table, see Table 2-1, "Batch Jobs - Actions Menu/Icons and Description" for more information.
You can customize the view of the table by using the options in the View Menu, see Table 2-2, "Batch Jobs - View Menu/Icons and Description" for more information.
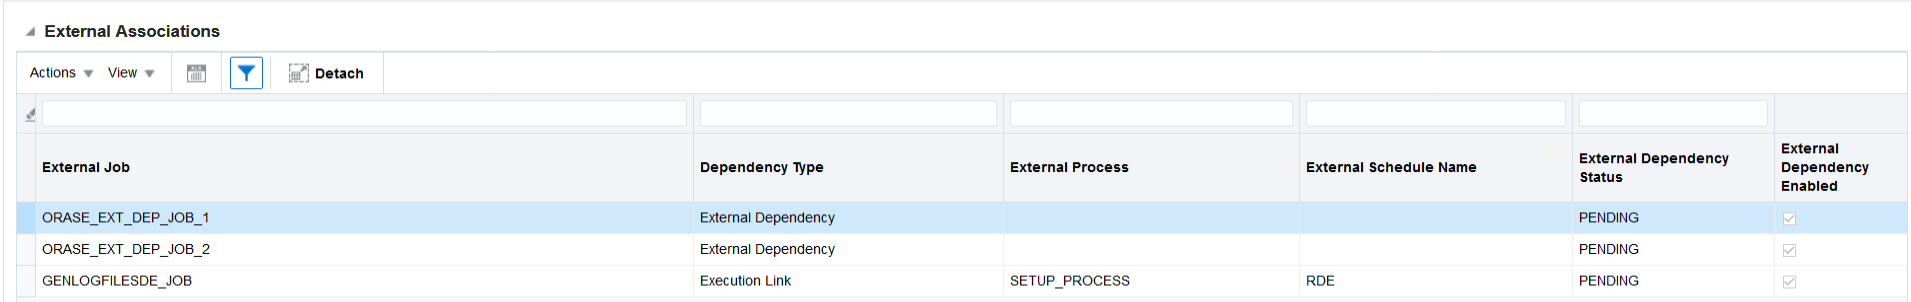
The External Associations section lists external batch job dependencies and inter-schedule dependencies. External Dependencies are identified by the Dependency Type External Dependency.
The External Associations section also lists the Jobs from one Schedule that are dependent on Jobs from another Schedule stored in the same POM instance. Inter-Schedule Dependencies are identified by the Dependency Type Inter-Schedule Dependency.
The External Associations section also lists the Jobs of one Schedule that are linked to the external source Schedules and that need to be triggered subsequently after the completion of the Process/Job from the source Schedule. These are identified by the Dependency Type Execution Link.
The External Associations table displays the external job, Dependency Type, External Process, External Schedule Name, the external dependency status, as well as the External Dependency Enabled checkbox.
Use the Actions Menu and icons to apply actions to the table, see Table 2-1, "Batch Jobs - Actions Menu/Icons and Description" for more information.
You can customize the view of the table by using the options in the View Menu, see Table 2-2, "Batch Jobs - View Menu/Icons and Description" for more information.
Execution Engine is a component in POM that orchestrates the batch job run instead of the JOS Process Flow component through JOS Job Admin. Job Admin communicates with POM using the Execution Engine services.
Any batch run in POM will be an execution request to the execution engine which handles that request appropriately and display the progress / status update till its completion using Execution Engine services.
Execution engine provides a feature called Scheduled Execution to pause/ suspend the execution of a particular schedule if required. When a schedule is suspended, execution engine will not run any new jobs until execution is re-enabled.
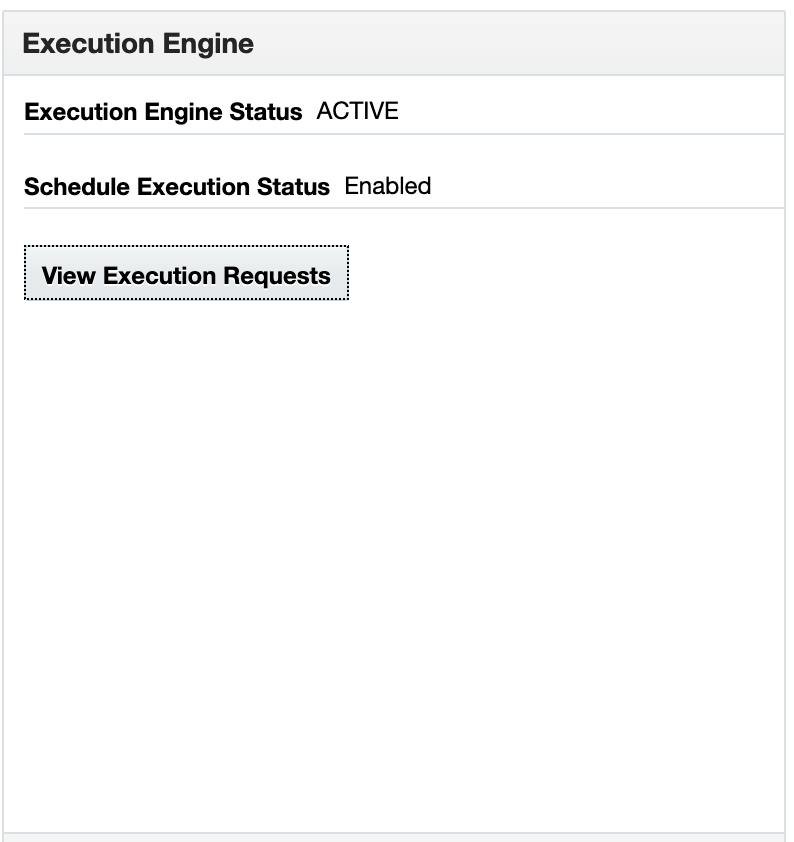
The Execution Engine section is always displayed to display the status of Execution Engine & Schedule Execution.
The Execution engine status could be one of the below -
ACTIVE: When the engine is active and is processing execution requests
INACTIVE: When the engine is idle and doesn't have any more execution requests pending.
SHUTDOWN: When the engine is not running.
|
Note: The Execution engine instance is not specific to any one schedule, it's a shared service that manages the runs of all schedules installed on this POM instance. |
The Schedule Execution status is specific to the displayed schedule on the monitor screen.
The possible statuses are below -
Enabled: It denotes the job executions could happen for this schedule via execution requests.
Suspended: It denotes the job execution is temporarily suspended for this schedule.
There is also an action button - View Execution Requests which displays the list of execution requests along with corresponding details in a popup like below.
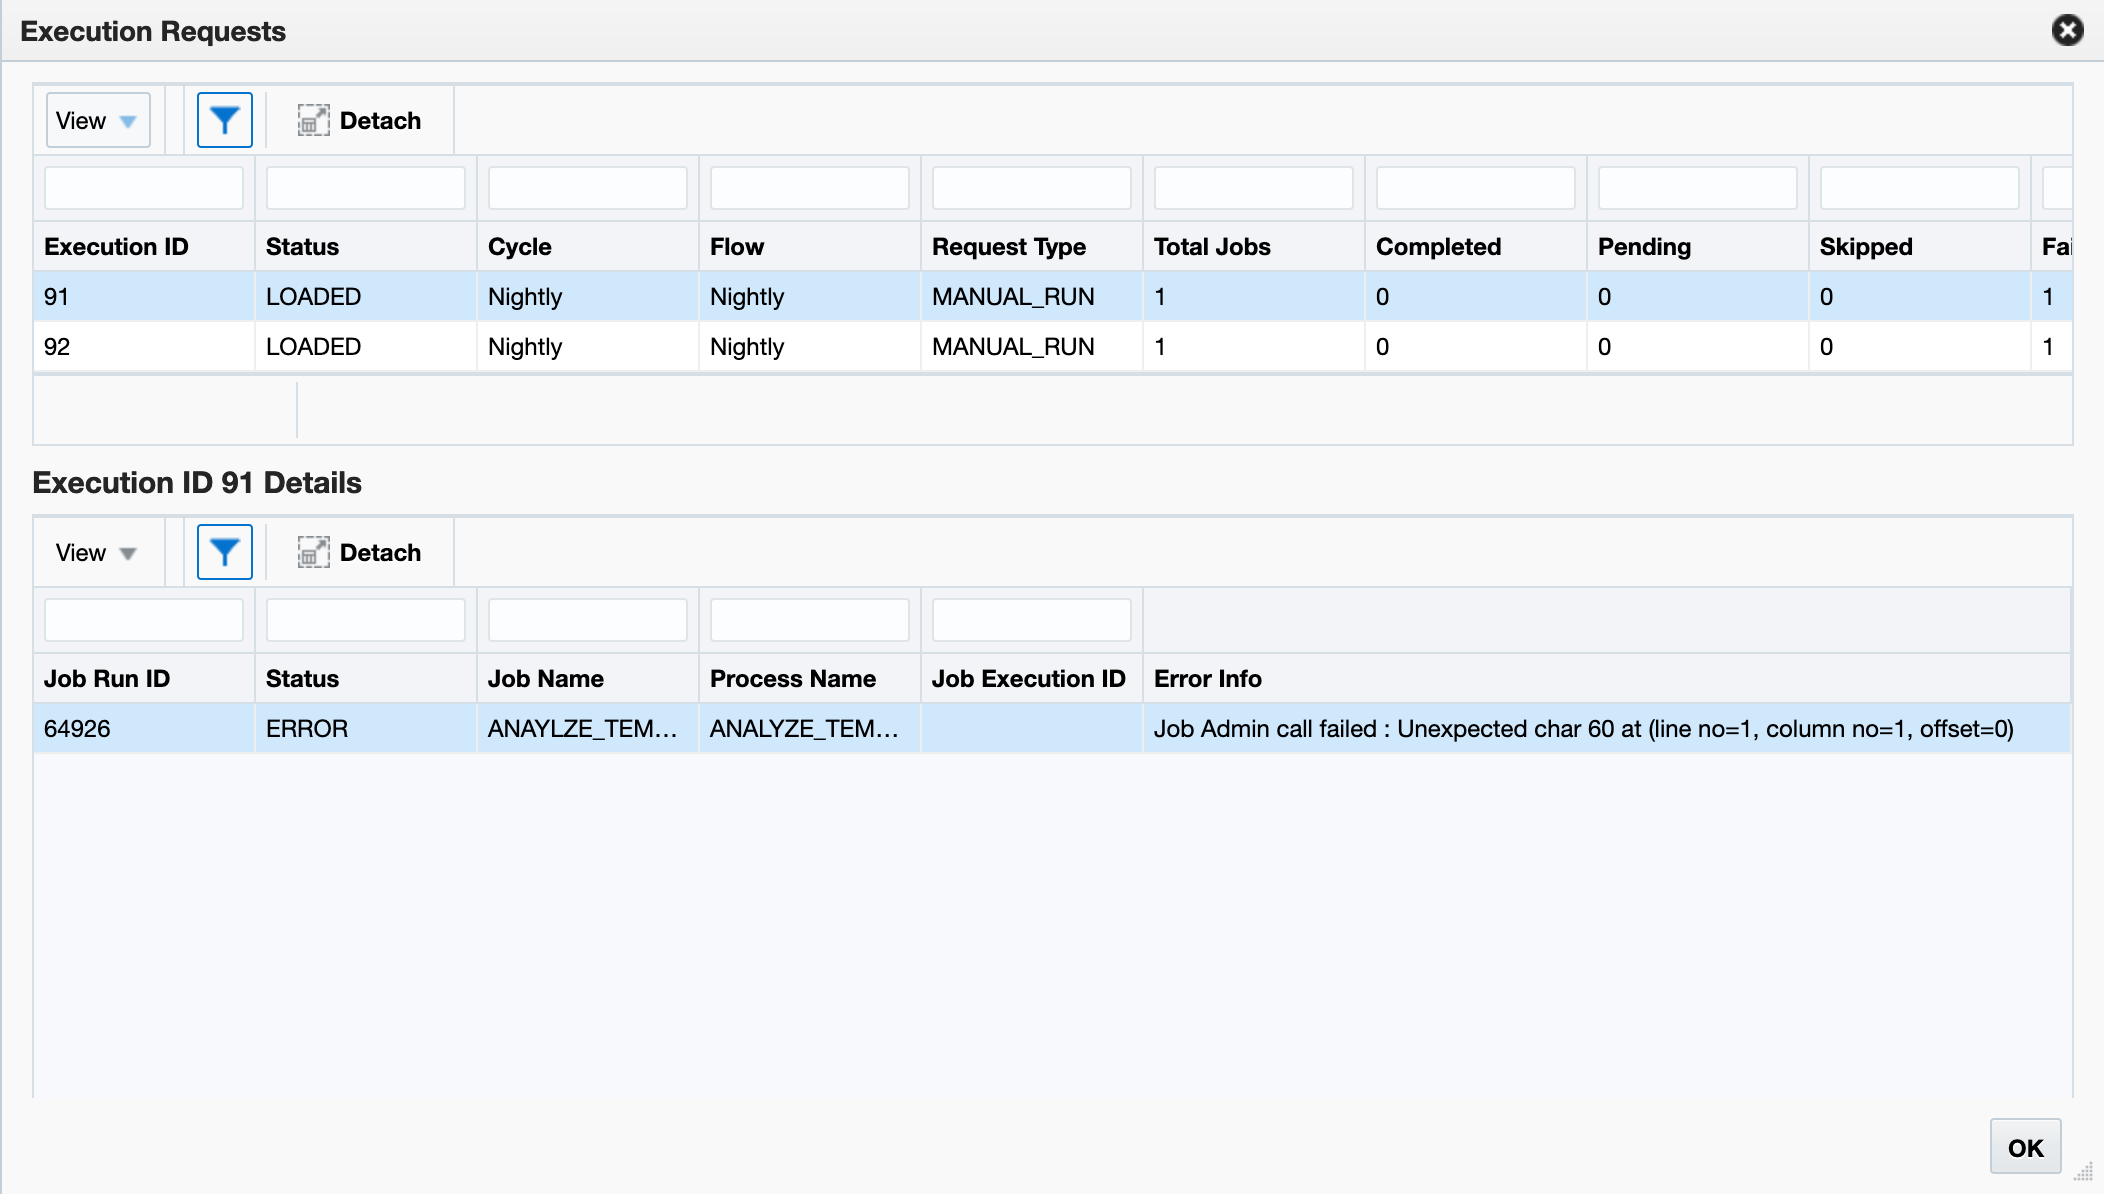
In this popup, we will see a master-detail table view where the master table shows the list of Execution requests made so far in the current schedule along with the stats related to that request.
The below detail table shows the Execution request detail like how many jobs are involved as part of the above selected execution request along with other stats related to the job like we see in the image above.
If there is no execution requests created for the current scheduler day yet then we will get an informative popup like below.

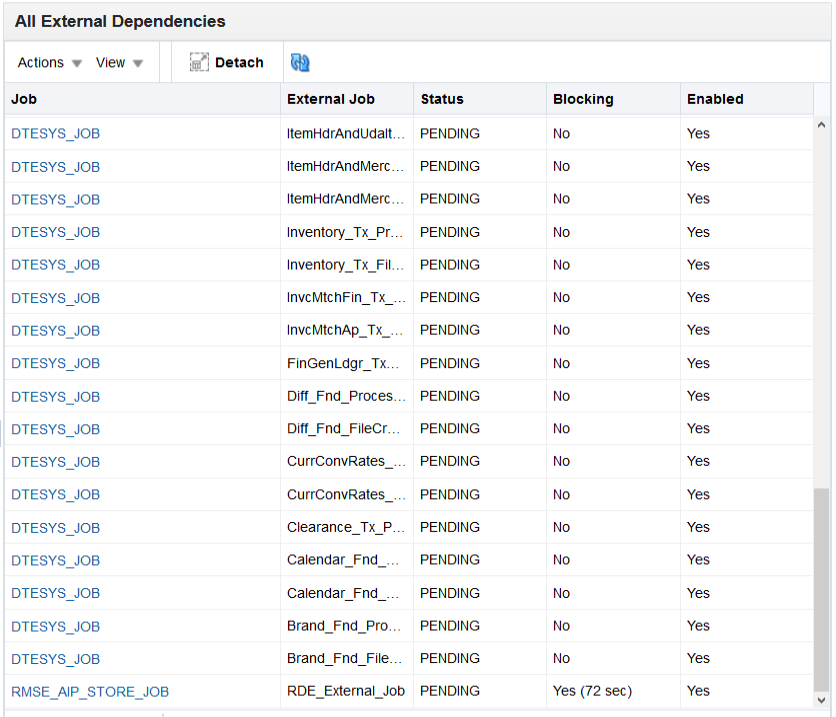
The All External Dependencies section is always displayed because External Dependencies are at the schedule level.
The All External Dependencies section lists all the external batch job dependencies for the entire current Schedule provided the system level external dependencies indicator is turned on.
The All External Dependencies table displays the Job, External Job, Status, Blocking and Enabled fields.
Clicking on the Job hyperlink will highlight the corresponding row in the Batch Jobs table.
The Blocking field indicates the time (in seconds) the Job started waiting for the external dependency to complete.
You can customize the view of the table by using the options in the View Menu, see Table 2-2, "Batch Jobs - View Menu/Icons and Description" for more information.
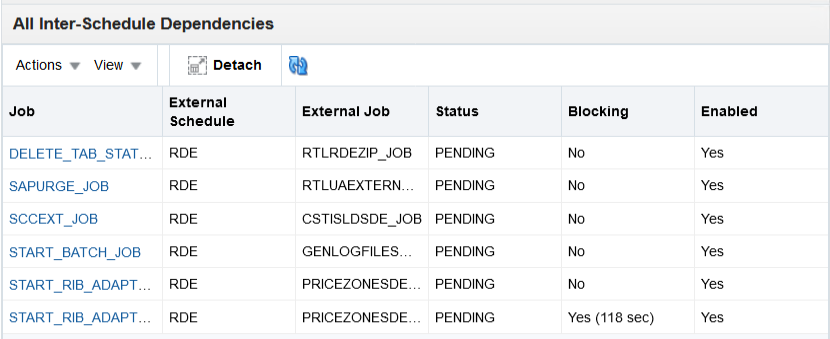
The All Inter-Schedule Dependencies section is always displayed since the Inter-Schedule Dependencies are at schedule level.
The All Inter-Schedule Dependencies section lists all the inter-schedule batch job dependencies for the entire current Schedule provided the system level inter-schedule dependencies indicator is turned on.
The All Inter-Schedule Dependencies table displays the Job, External Schedule, External Job, External Process, Status, Blocking and Enabled fields.
Clicking on the Job hyperlink will highlight the corresponding row in the Batch Jobs table.
The Blocking field indicates the time (in seconds) the Job started waiting for the inter-schedule dependency to complete.
You can customize the view of the table by using the options in the View Menu, see Table 2-2, "Batch Jobs - View Menu/Icons and Description" for more information.
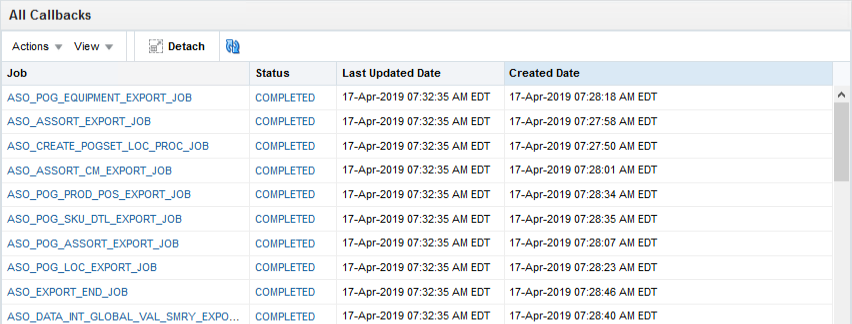
The All Callbacks section is always displayed since callbacks are displayed at the schedule level.
The All Callbacks section lists all the external status update request and response callbacks based on the External Status Update mode set in the External System Configuration screen.
The All Callbacks table displays the Job, Status, Last Updated Date and Created Date fields.
Clicking on the Job hyperlink will highlight the corresponding row in the Batch Jobs table.
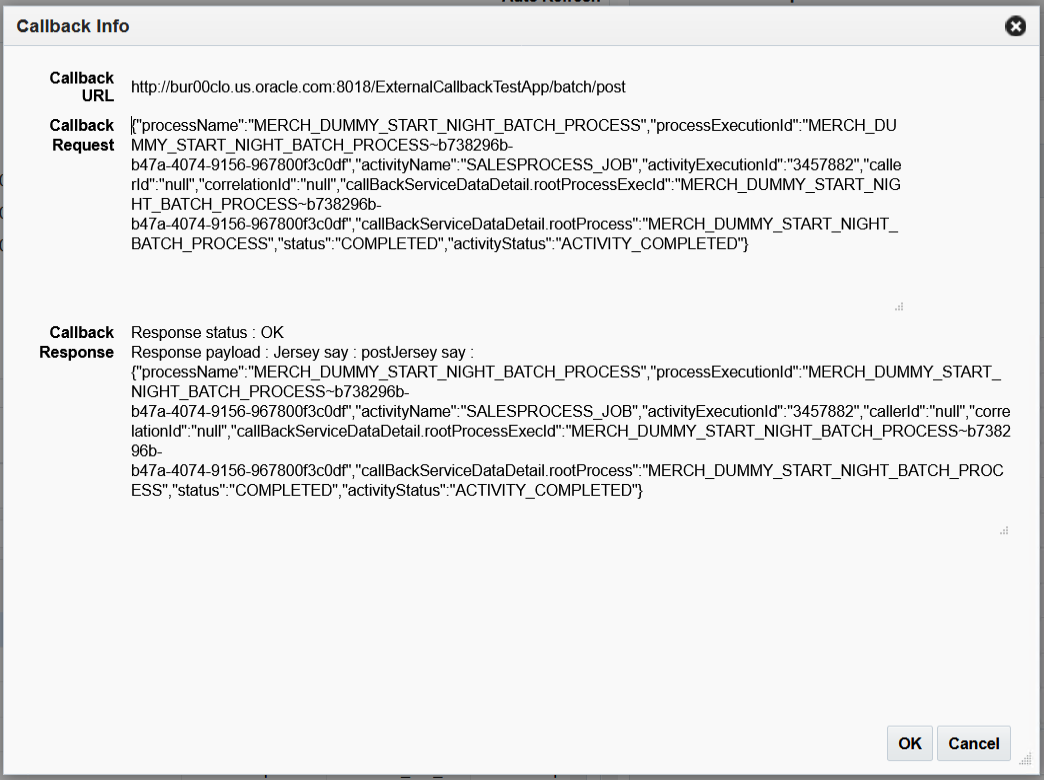
Clicking on the Status hyperlink [COMPLETED or FAILED] will open the "Callback Info" popup that shows the Callback URL configured in External System Configuration screen, Request Payload and Response Payload.
You can customize the view of the table by using the options in the View Menu, see Table 2-2, "Batch Jobs - View Menu/Icons and Description" for more information.
The toolbar contains the following icons and buttons.
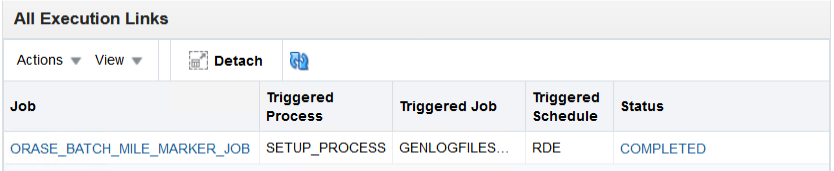
All Execution Links section is always displayed since links are displayed at the schedule level.
All Execution Links section lists the Jobs of one Schedule that are linked to the external source Schedules and that need to be triggered subsequently after the completion of the Process/Job from the source Schedule.
All Execution Links table displays the Job, Triggered Process, Triggered Job, Triggered Schedule and Status.
Clicking on the Job hyperlink will highlight the corresponding row in the Batch Jobs table.
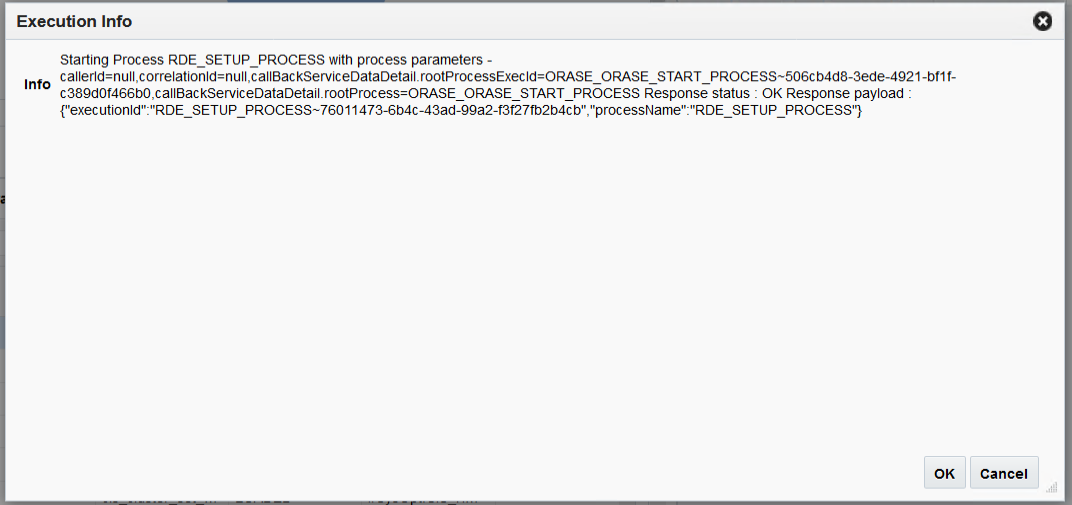
Clicking on the Status hyperlink will open the ”Execution Info” popup that shows the Process parameters and the response payload of the triggered Process in case of status 'Completed' or 'Failed'.
Whereas for the status - 'Skipped', the popup shows the reason for being skipped.
You can customize the view of the table by using the options in the View Menu, see Table 2-2, "Batch Jobs - View Menu/Icons and Description" for more information.
To access the External System Configuration window from the Tasks menu, select <Schedule> -> Administration -> External System Configuration.
The External System Configuration screen allows the users to modify the following properties of the External System:
External Status URL
External Status Update Mode
External System Credentials
To access the External System Configuration window from the Tasks menu, select Administration -> External System Configuration. The External System Configuration appears.

Open External System Configuration screen from sidebar
Specify External Status Update URL to configure the ReST service URL where status updates should be sent. Updates will be sent using HTTP POST method.
Specify system wide External Status Update mode to NONE/FAILED/ALL. This will be compared against Job level modes to decide whether to send a status update for a job or not.
Click on Save to save the changes or click on Save and Close to save the changes and close the screen.
A basic authentication is enabled for the External Status Update Rest Service End point where status updates are sent to the external system from POM. The credentials are configured in Enterprise Manager Console of WebLogic domain where POM is deployed. Below are the details of credentials
Map name: External.oracle.retail.apps.poam.app.external
Alias name: {SCHEDULENAME}.externalstatusupdatealias
For example, RDE.externalstatusupdatealias, or MERCH.externalstatusupdatealias
Credential type: password
Open the External System Configuration screen from the sidebar.
If the External System Credential has not previously been created, click on plus (+) icon to create it. Otherwise click the edit icon to modify it.
Enter User Name and Password of the External System in the Create External System Credentials popup window.

Click OK to create or modify the credentials in the WebLogic instance.

POM leverages the Retail Platform Notification facility and e-mail capabilities to issue alerts to users regarding specific instances during batch operations. Mail notifications are sent when a Job fails and when the nightly cycle completes based on the configured mail addresses.

The Nightly Cycle Summary report shows the snapshot of the entire Nightly Cycle run. It includes metrics for averages and total execution times, POM idle time, cycle start and end time, and so on. The report also includes the number of Jobs completed, failed, skipped, and skipped on error.

The Error report shows the Job name that failed along with the corresponding Job Execution ID, Job Description, and the time the Job failed/skipped on error.

POM send an error notification email if a technical issue in POM causes a job to fail before it is submitted to Job Admin.
|
Note: Some job failures may be caused by a technical issue such as a communication failure. |
It is possible that POM automatically recovers from these types of failures. While checking the status back in POM, if the Job is not in an ERROR state, the status was reconciled by POM automatically, and no further action is required. If the Job is still in an ERROR state, it requires manual intervention to fix the technical issues.