| Oracle® Retail Process Orchestration and Monitoring JET UI User Guide Release 19.1 F32240-02 |
|

 Previous |
 Next |
| Oracle® Retail Process Orchestration and Monitoring JET UI User Guide Release 19.1 F32240-02 |
|
Previous |
Next |
The Process Orchestration and Monitoring (POM) application is a user interface for scheduling, tracking and managing batch jobs.
Process Orchestration and Monitoring has the following tabs:
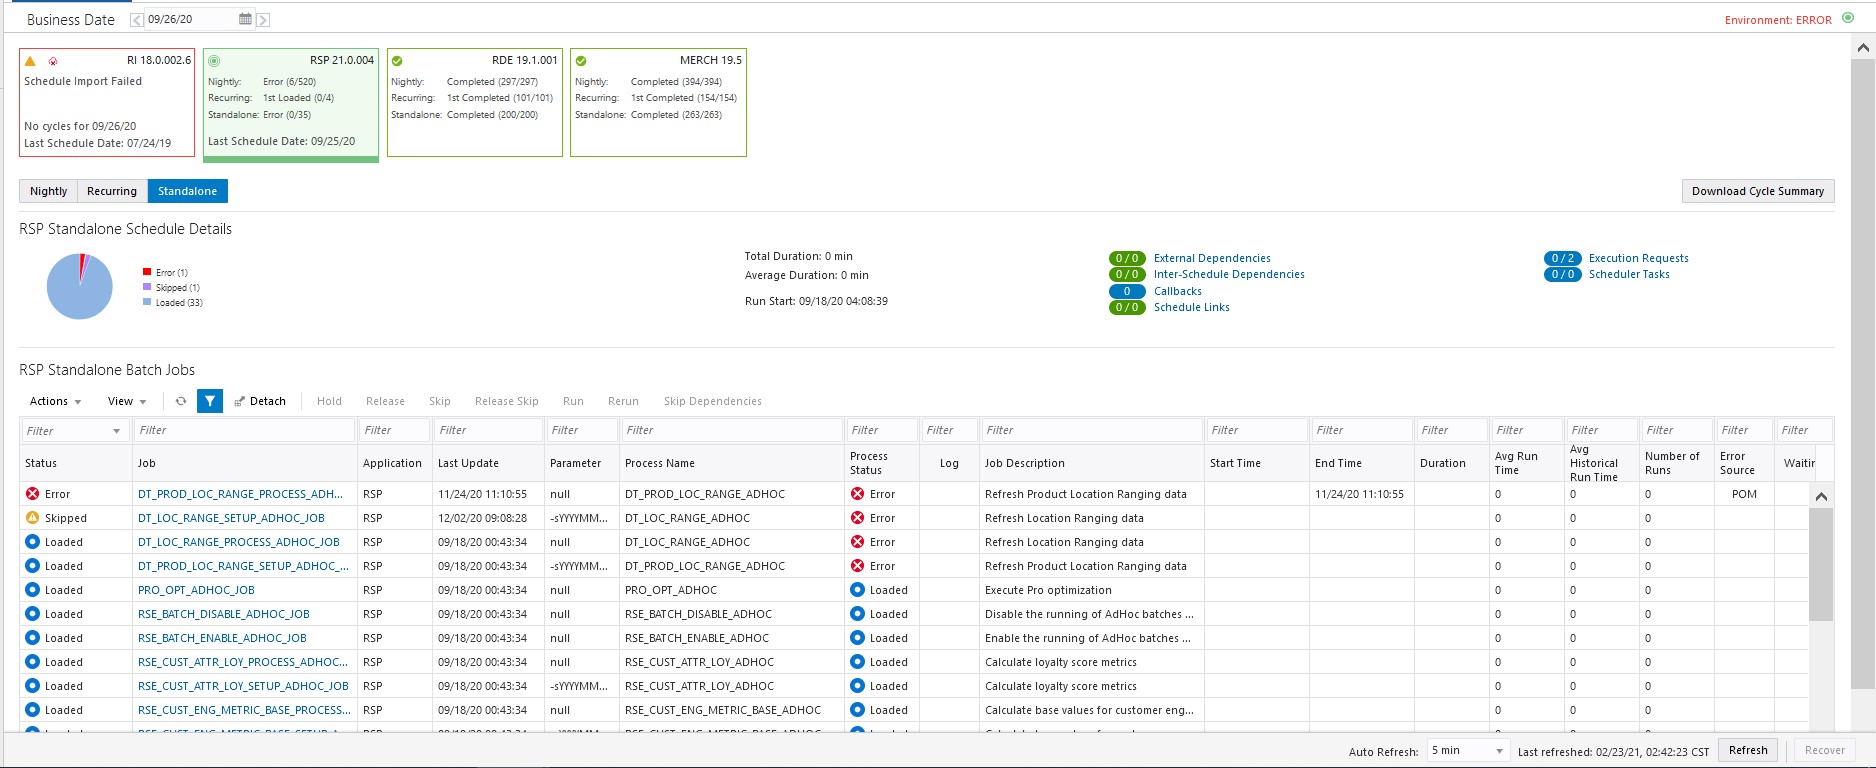
The Batch Monitoring tab provides a runtime view of the statuses and dependencies with regard to the different batch cycles for the selected business day.
Select Batch Monitoring in the Navigation Area to open the Batch Monitoring tab.
The application will by default open for a business date where at least one schedule is active. If none found, it will open for the most recent business date where at least one schedule is active.
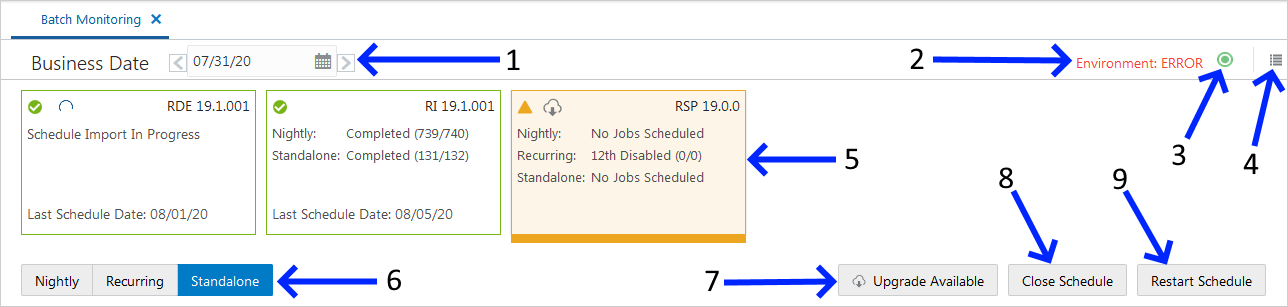
The header displays information about the batches displayed in the Batch Monitoring tab. You can also use the header selection to choose which schedule batches to display.
Business Date - Displays the business date for the oldest schedules displayed in Batch Monitoring.
Use this field to select the oldest schedule displayed in Batch Monitoring.
Environment Status - If there is an error in an environment, this field will show an ERROR status. Click this link to expand the right hand Status panel
|
Note: An error in this field does not necessarily mean that the system is not working. For example, it will show an error if a schedule has an error, or if a batch is not working. |
Environment Status Icon - Also displays the status of the environment.
Click this icon to show the status of the Scheduler, Execution Engine and the environments, or to manage the information displayed. See "Status" for more information.
Activity Feed - Click this icon to display a panel at the right side of the screen containing activities performed by the system and by the user.
Environments - Displays information about each environment integrated with Process Orchestration and Monitoring.
Select one of these panels to display information about that environment's batch processes.
Monitoring Cycle - Displays the monitoring cycle of the batches displayed.
Select a monitoring cycle to see the batches scheduled for that cycle. The following monitoring cycles are available:
Nightly
Recurring
Standalone
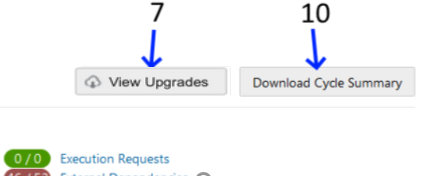
Upgrade Available - Use this button to navigate to the Schedule Maintenance screen for the option to upgrade the batch schedule to a new version. This button only appears when there is a new version of the schedule available and there is no upgrade in progress or in error. When an upgrade is in progress or in error, the button caption changes to View Upgrades which also navigates the user to the Schedule Maintenance screen.
Close Schedule - Use this button to close the schedule. This button only appears for Active schedules.
Restart Schedule - Use this button to restart the schedule. This button only appears for Active schedules.
Download Cycle Summary - Use this button to download a summary for the currently selected business day for the selected schedule. Once clicked, the Download Cycle Summary dialog provides the user options to select the cycle and format. This button only appears for Completed schedules.
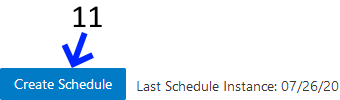
Create Schedule - Use this button to create a new Scheduler Day. This button only appears when a schedule tile is selected for which there is no open Scheduler Day. Click this button to create a new Scheduler Day for the selected schedule for the business date following the last schedule instance.
Each schedule tile displays information for a batch schedule that POM is responsible for running.
Select a tile to display the list of batch processes for that schedule.
Each panel displays the following information:
|
Note:
|
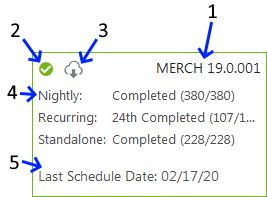
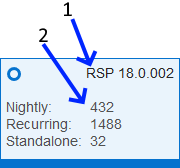
Schedule name and Version - Displays the abbreviation of the application or application group and the software version.
Run Status - Displays the status of the batch processes.
Completed
Active
Error
Schedule Upgrade - A grey cloud indicates that a newer version of the batch schedule is available.
A red cloud indicates that schedule upgrade has failed. Navigate to the Schedule Maintenance screen to address the failure.
A blue spinner indicates that a schedule upgrade is in progress.
Monitoring Cycles and Statuses - Displays the number of completed and total processes for each monitoring cycle.
Last Schedule Date - Indicates the last date on which the batch processes were configured.
The batch jobs header displays the following information:
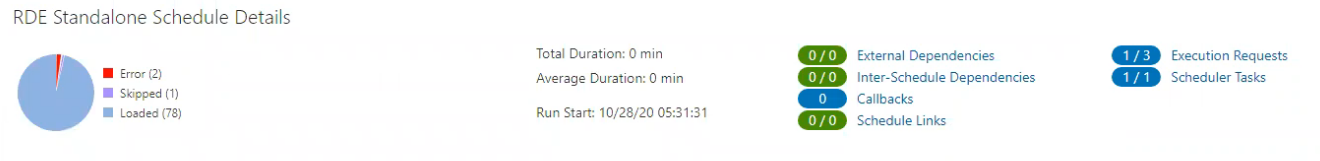
The run status chart shows a chart summary of the status of the different batches (including the number of batch jobs with that status) that are included in the selected cycle for the selected schedule. The possible statuses are:
Loaded - Jobs are in loaded state when the scheduler day is first created.
Pending - Job is waiting to run.
Completed - Job ran successfully on the system.
Error - A failure occurred due to an issue in the environment or the job's application.
Held - An administrator placed the job on hold.
Skipped - An administrator has skipped the running of the job so the remaining jobs in the cycle can proceed.
Running - Job is currently running on the system.
Long Running - The job's run time has exceeded a threshold. This threshold is calculated by multiplying the job's average run time and the Long Run Average Time Multiplier defined on the schedule Settings section of the System Configuration screen.
Disabled - Job was disabled by an administrator on the Batch Administration screen.
System Held - Job was placed on hold by the system due to a lack of resources to run it.
Skipped on Error - Job was preconfigured to be skipped on a failure.
Waiting - Job is waiting for completion of pre-dependencies (Hourly Cycle, Nightly Cycle, External Dependency and Inter-Schedule Predecessor Jobs).
For completed batch jobs, the batch job header shows the following information:
Run Start
Run End
Total Duration
Average Duration
|
Note: Active Batch Job Statistics are not yet implemented. They will be implemented in a future version of POM. |
For active batch jobs, the batch job header shows the following information:
Estimated Completion Time
Estimated Time Remaining
Total Duration
Average Duration
Run Start
The batch information area displays the following information about the batch process results:
Execution Requests - Displays the number of completed executions and the total number of execution requests. Click to open the Execution Requests Window.
Scheduler Tasks - Displays all tasks scheduled to run during the current scheduler day. Click to open the Scheduler Tasks window.
External Dependencies - Displays the number of successful and total number of external dependencies. Click to open the Batch Cycle Details Screen.
Inter-Schedule Dependencies - Displays the number of successful and total number of inter-schedule dependencies. Click to open the Batch Cycle Details Screen.
Callbacks - Displays the number of successful and total number of callbacks. Click to open the Batch Cycle Details Screen.
Schedule Links - Displays the number of successful and total number of schedule links. Click to open the Batch Cycle Details Screen.
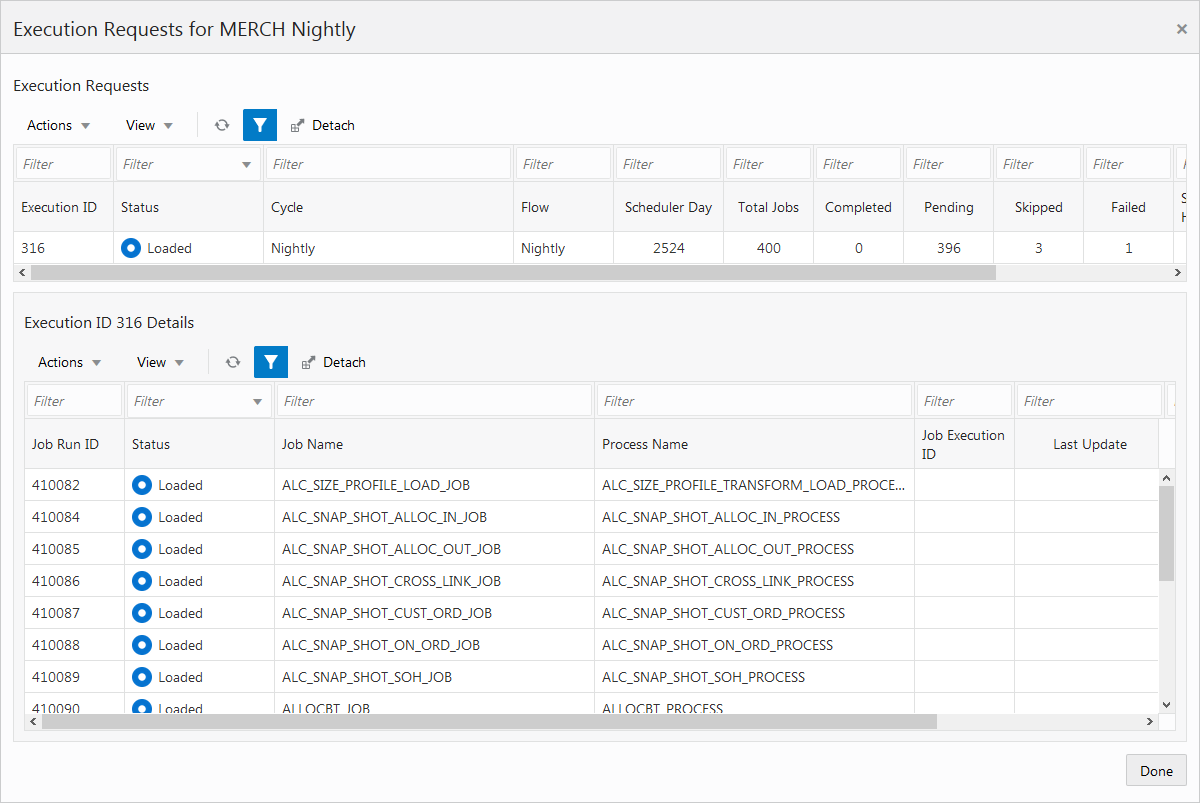
The Execution Requests window displays information about execution requests for a batch.
Click Done or the close window icon  to close the window.
This section displays the following information about each execution request in the batch process:
Execution ID
Status
Cycle
Flow
Scheduler Day
Total Jobs
Completed
Pending
Skipped
Failed
System Held
Submitted
See Table Menu Options in the "Common User Interface Controls" for information about the options available for this section.
This section displays the following information about each job run by the execution request:
Job Run ID
Status
Job Name
Process Name
Job Execution ID
Last Update
First Job
Error Info
See Table Menu Options in the "Common User Interface Controls" for information about the options available in this section.
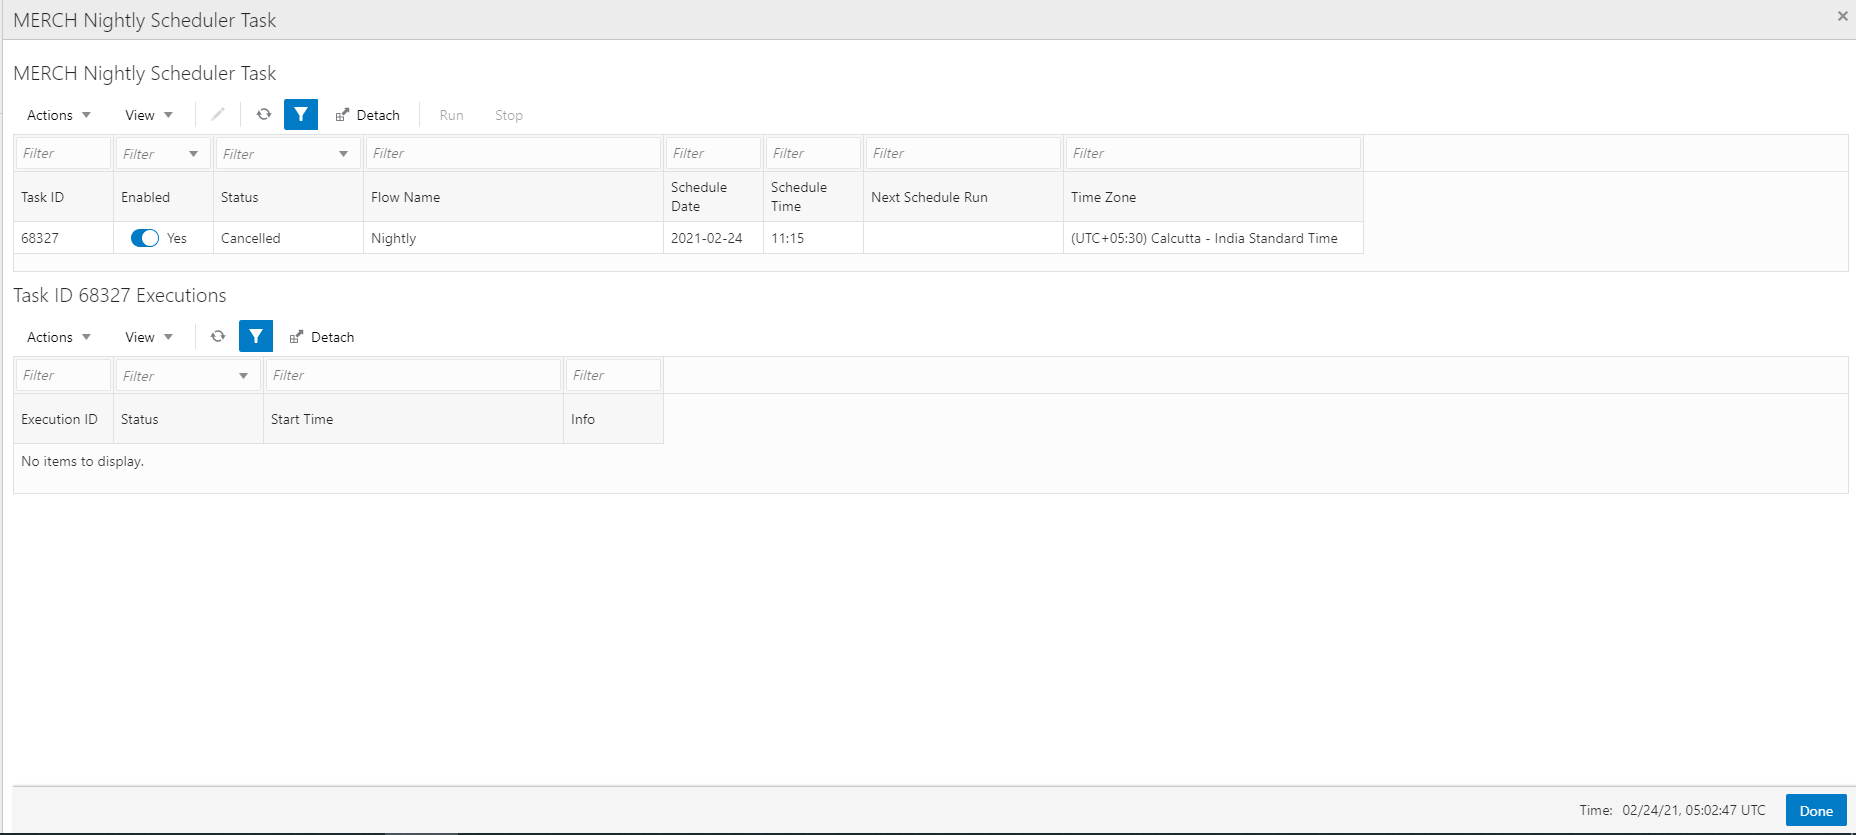
The Scheduler Tasks window displays information about tasks that are scheduled to run during the current scheduler day. See the Scheduler Administration section of this chapter.
When the new scheduler day is created every day (at the end of the Nightly batch run), it creates the scheduler tasks according to the way they are set up in the Scheduler Administration screen.
Click Done or the close window icon ( ) to close the window.
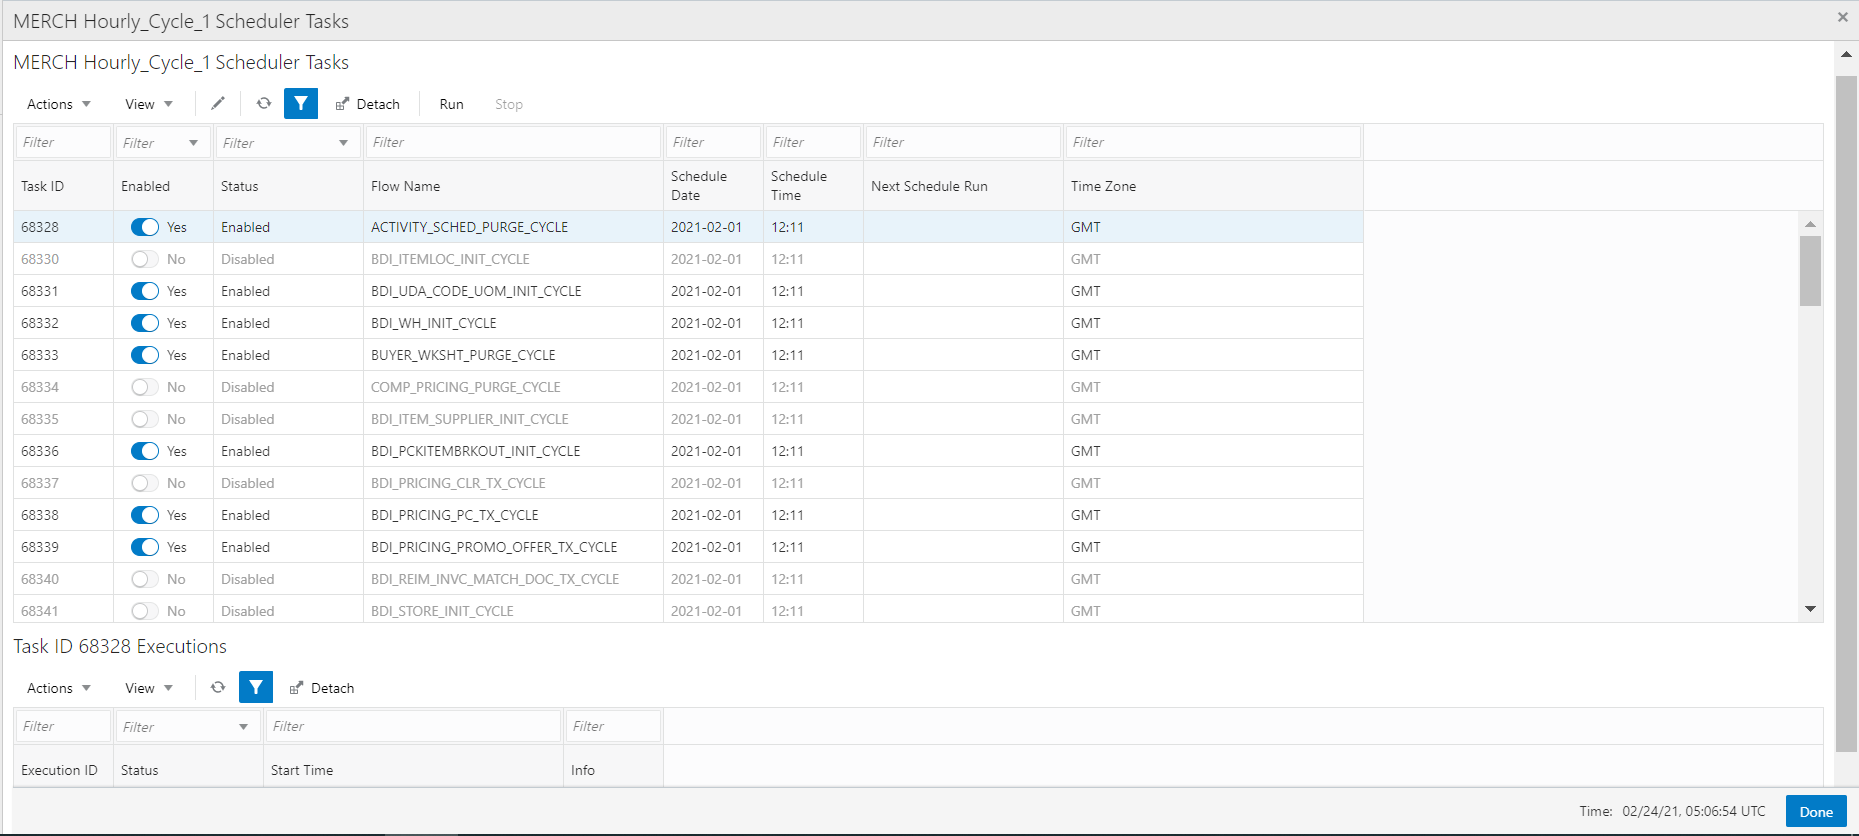
The Scheduler Tasks window for the Nightly and Recurring cycles display the same task attributes listed below. The difference is that there is only one Nightly task for a scheduler day whereas there could be multiple Recurring flows running throughout the day.
This section displays the following information about each Nightly/Recurring Scheduler task:
Task ID
Enabled - Switch to enable or disable the execution of the task
Status - Possible values are: Enabled, Disabled, Completed, Skipped On Delay, Scheduled, Error, or Cancelled
Flow Name - Nightly or recurring flow name
Schedule Date
Schedule Time
Time Zone
|
Note: When the New Scheduler Day is created, if the start time for a certain task has elapsed, the task will be scheduled for the next day. The Next Schedule Run column will show the next time the task will execute. |
See "Table Menu Options" in "Common User Interface Controls" for information about the options available for this section.
This section displays the following information about each task executions:
Status - Possible values are: Completed, Error
Start Time
Info - If the Status is Error, this field changes to a link which, when clicked, will open a dialog showing error details.
See "Table Menu Options" in "Common User Interface Controls" for information about the options available in this section.
The user can edit the Nightly or Recurring tasks to change the time they run for the day. Permanent changes need to be entered in the Scheduler Administration screen.
|
Note: If the user makes a change to the time, he or she needs to click the Run action to schedule the task.Also, for the task to be editable, it must be in a state other than Scheduled. If it is in a Scheduled state, the user can click the stop action, which puts the task in a Cancelled state and it is therefore editable.  |
Click Done or the close window icon ( ) to close the window.
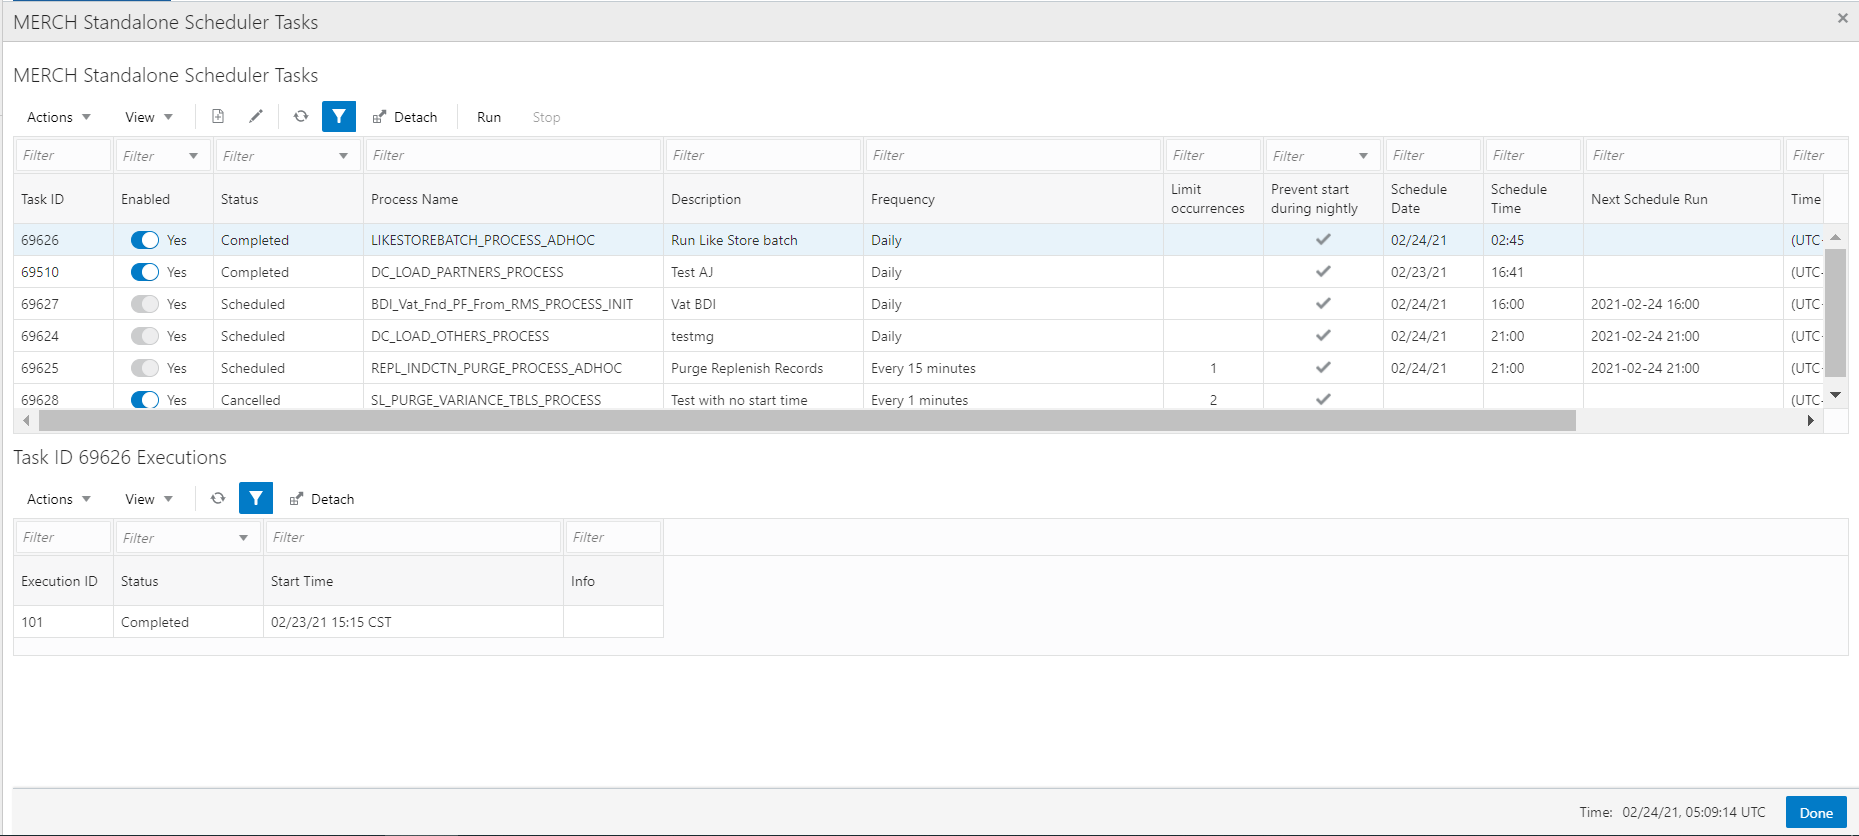
This section displays the following information about each Standalone Scheduler task:
Task ID
Enabled - Switch to enable or disable the execution of the task.
Status - Possible values are: Enabled, Disabled, Completed, Skipped On Delay, Scheduled, Error, Cancelled.
Process Name
Frequency - Daily or Every x minutes.
Limit Occurrences -If this field has a value, the process will run every x minutes for y occurrences.
Prevent Start During Nightly - Indicates that the process should not start running when Nightly is in progress. If the process starts running before Nightly start, it will continue running even if the run extends into the Nightly run.
Schedule Date
Schedule Time
Next Scheduled Run - Displays the date and time the next run will occur.
Time Zone
See "Table Menu Options" in "Common User Interface Controls" for information about the options available in this section.
The user can edit a Standalone task to change any of the fields in the window below. Edits are effective just for the day's run. Permanent changes must be entered in the Scheduler Administration screen.
|
Note: If the time is left blank for a standalone task, it will execute immediately upon clicking Ok.When the New Scheduler Day is created, if the start time for a certain task has elapsed, the task will be scheduled for the next day. The Next Schedule Run column will show the next time the task will execute. |
This section displays the following information about each task execution:
Execution ID
Status - Possible values are: Completed, Error
Start Time
Info - If the Status is Error, this field changes to a link which, when clicked, will open a dialog showing the error details.
See "Table Menu Options" in "Common User Interface Controls" for information about the options available in this section.
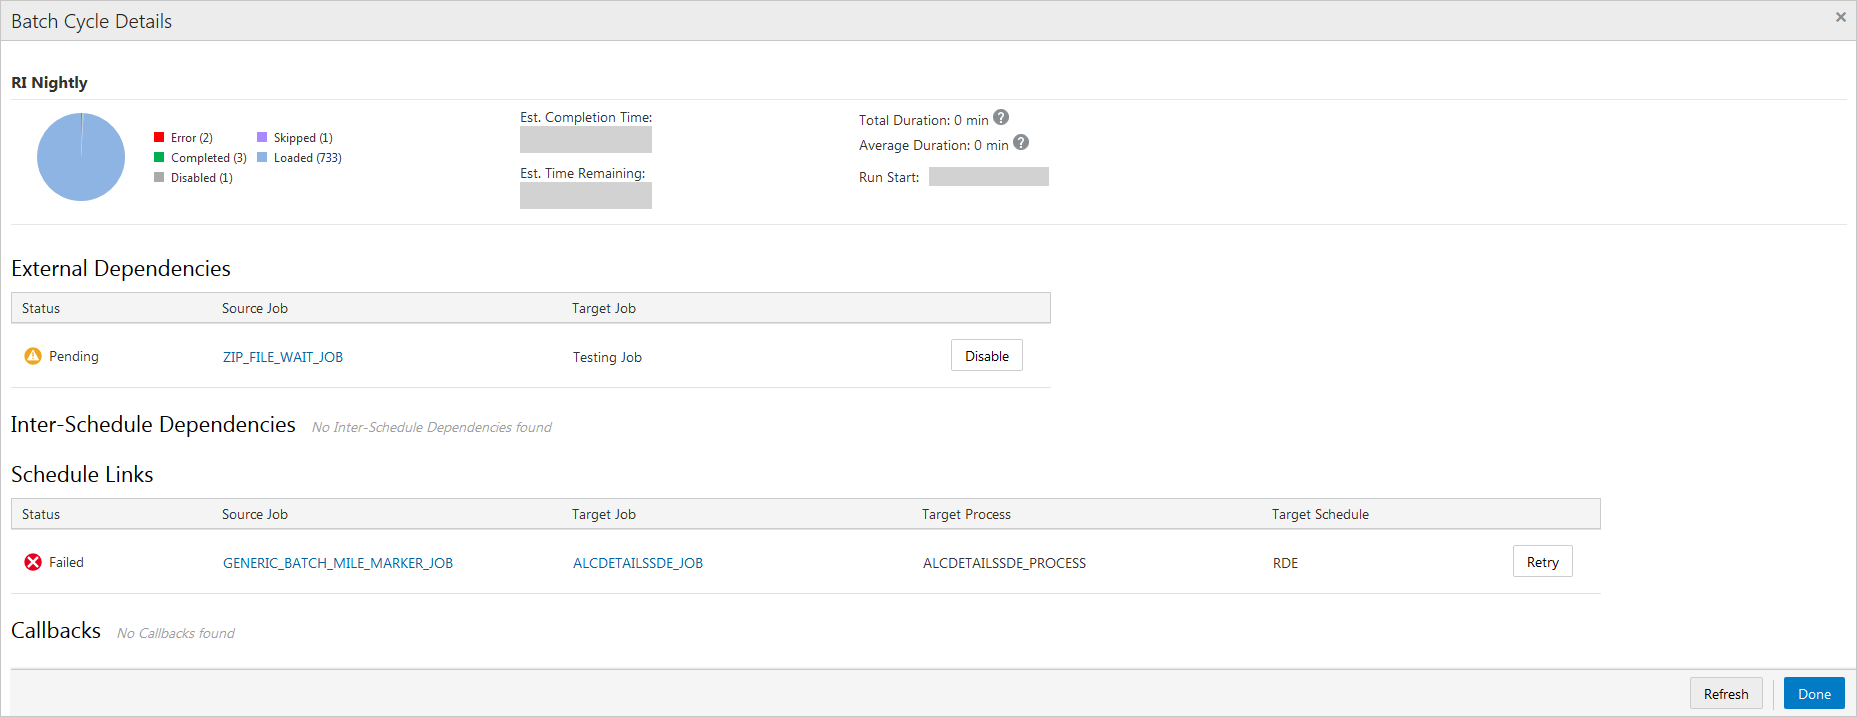
The Batch Cycle Details screen displays the following sections:
The header displays the following information about the batch cycle:
For completed batch jobs, the batch job header shows the following information:
Run Start
Run End
Total Duration
Average Duration
For active batch jobs, the batch job header shows the following information:
|
Note: Active Batch Job Statistics are not yet implemented. They will be implemented in a future version of POM. |
Estimated Completion Time
Estimated Time Remaining
Total Duration
Average Duration
Run Start
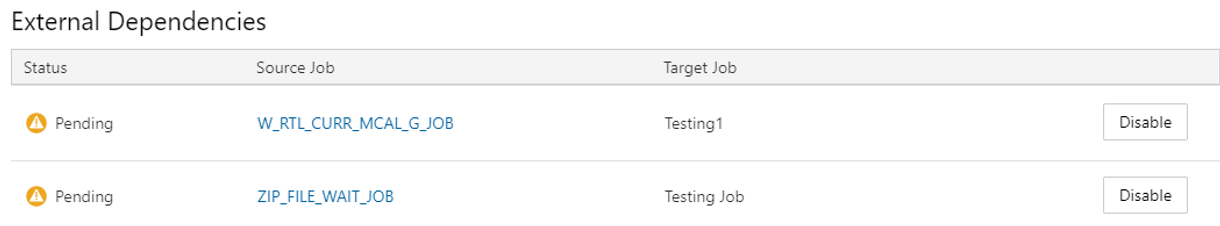
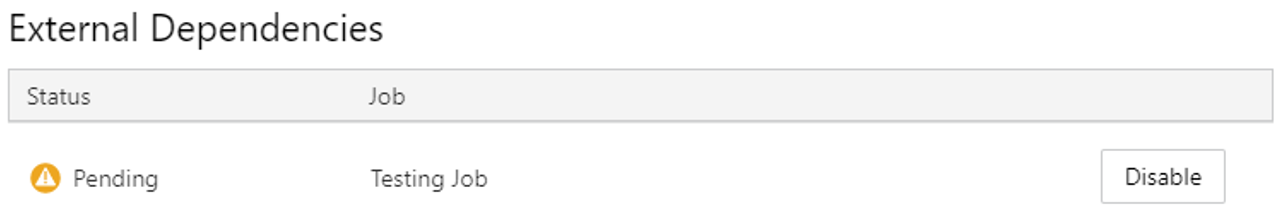
The External Dependencies section lists all the external batch job dependencies for the entire current Schedule. These dependencies are only shown if the system level external dependencies indicator is turned on. An external dependency is usually a dependency on a customer's internal process. This dependency is released once the customer calls an endpoint into POM for a specific POM job.
The following information is displayed for each external dependency:
Status
Source Job - Click to open the job in the Batch Job Details screen. The source job is a job in the current schedule which is dependent on the external (target) job.
Target Job - The job that, when complete, will release the dependency which the source job is waiting on.
A Disable/Enable button to disable or enable the dependency.

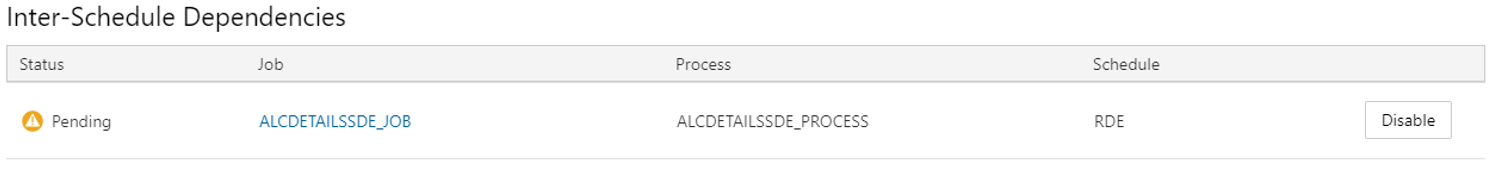
The Inter-Schedule Dependencies section lists all the inter-schedule batch job dependencies for the entire current Schedule. These dependencies are only show if the system level inter-schedule dependencies indicator is turned on. An inter-schedule dependency links the current schedule and a target schedule where a job in the target schedule is dependent on the completion of a job in the current schedule.
The following information is displayed for each inter-schedule dependency:
Status
Source Job - Click to open the job in the Batch Job Details screen.
Target Job - Click to open the job in the Batch Job Details screen. Target job is dependent on the source job.
Target Process - Process containing the target job.
Target Schedule - Schedule containing the target process/job.
A Disable/Enable button to disable or enable the dependency.

A schedule link links the current schedule and a target schedule where the current schedule does not start until the completion of a job in the target schedule.
The following information is displayed for each schedule link:
Status
Source Job - Click to open the job in the Batch Job Details screen. The job in the current schedule which starts the current batch when the Target Job completes.
Target Job - Click to open the job in the Batch Job Details screen. The job in the Target Schedule which when completes fulfills the dependency for the Source Job in the current schedule.
Target Process - The process which the Target job belongs to. - The schedule whose job is a dependency for the job in the current schedule.
Info - Shows information regarding error if failed or skipped.
Target Schedule
If it was not successful, a Retry button to retry the schedule link.
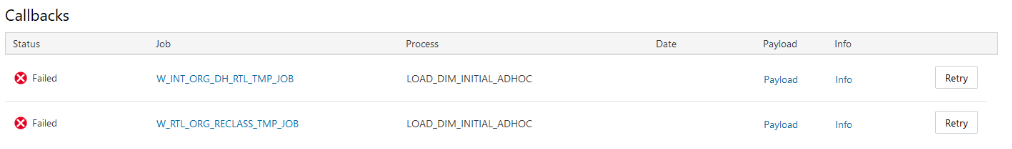
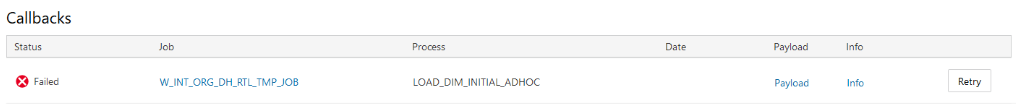
The Callbacks section lists all the external status update request and response callbacks based on the External Status Update mode set in the External System Configuration screen.
The following information is displayed for each callback:
Status
Job - Click to open the job in the Batch Job Details screen.
Process - Process containing the job.
Date of callback
A Payload link to display the Payload Window for the callback.
An Info link to display the Info Window describing the callback response.
If the callback was not successful, a Retry button to retry the callback.
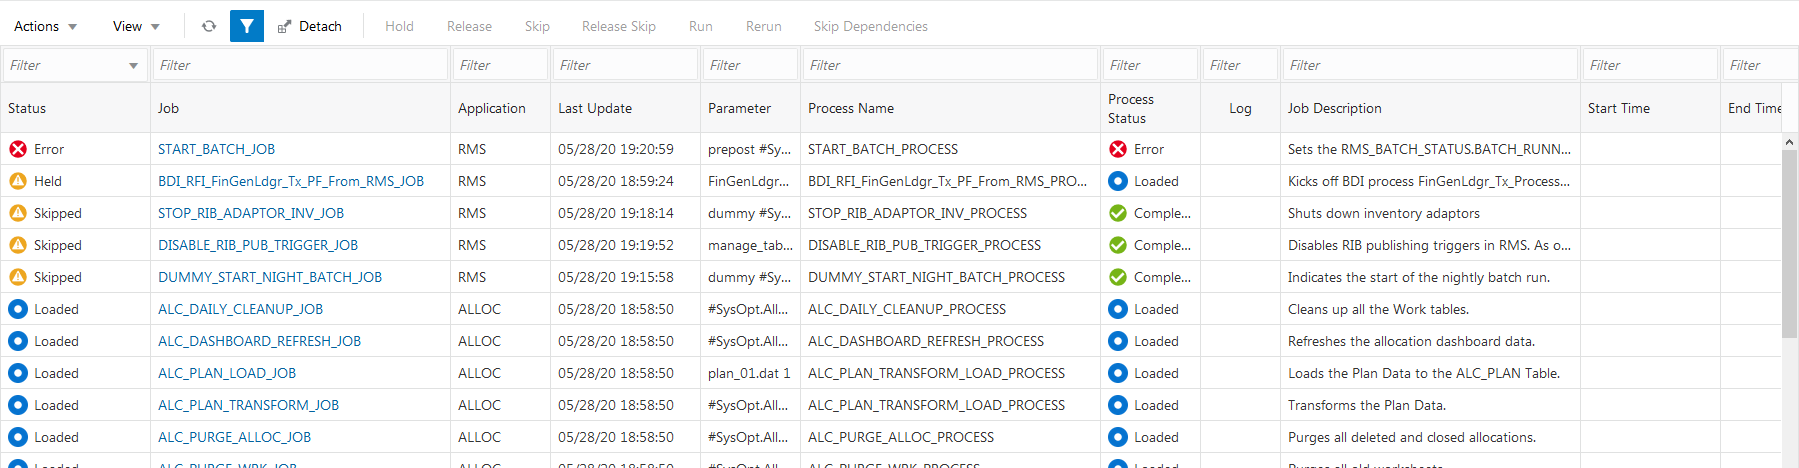
The Batch Jobs section lists all the batch jobs for the selected schedule and the selected cycle. The table displays the following information:
Status
Loaded - Jobs are in loaded state when the scheduler day is first created.
Pending - Job is waiting to run.
Completed - Job ran successfully on the system.
Error - A failure occurred due to an issue in the environment or the job's application.
Held - An administrator placed the job on hold.
Skipped - An administrator has skipped the running of the job so the remaining jobs in the cycle can proceed.
Running - Job is currently running on the system.
Long Running - The job's run time has exceeded a threshold. This threshold is calculated by multiplying the job's average run time and the Long Run Average Time Multiplier defined on the schedule Settings section of the System Configuration screen.
Disabled - Job was disabled by an administrator on the Batch Administration screen.
System Held - Job was placed on hold by the system due to a lack of resources to run it.
Skipped on Error - Job was preconfigured to be skipped on a failure.
Waiting - Job is waiting for completion of pre-dependencies (Hourly Cycle, Nightly Cycle, External Dependency and Inter-Schedule Predecessor Jobs).
Job - Click to open the job in the Batch Job Details screen.
Application
Last Update
Parameter
Process Name
Process Status
Log
Job Description
Start Time
End Time
Duration
Average Run Time
Average Historical Run Time
Number of Runs
Error Source
Waiting
Waiting Reasons
See "Action Menu and Icons" for common actions that can be performed through the Action menu and the icons. You can also perform the following actions:
Table 2-1 Batch Jobs - Actions Menu/Icons and Description
| Actions Menu/Icons | Description |
|---|---|
|
Hold |
Use the Actions > Hold or the Hold button to put the process on hold. |
|
Skip |
Use the Actions > Skip or the Skip button to skip the process. |
|
Run |
Use the Actions > Run or the Run button to run the process immediately. |
|
Rerun |
Use the Actions > Rerun or the Rerun button to run the job again. |
|
Edit Parameters |
Use the Actions > Edit Parameters or the Edit Parameters button to edit the parameters for the job. The new parameters are only effective for the current day's batch run. |
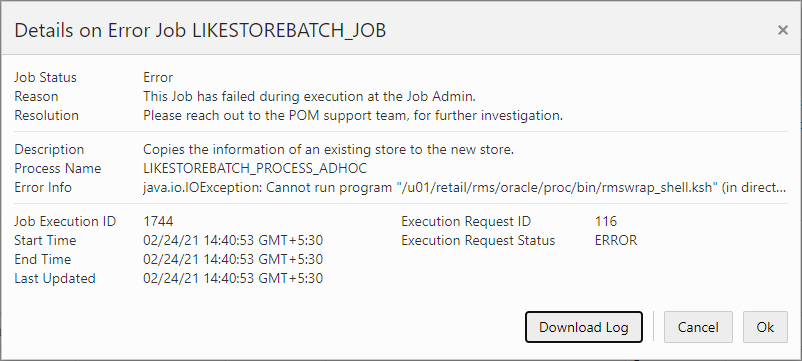
Certain status values on the Batch Jobs section such as 'Error' or 'Long Running' act as a link. When clicked a popup is displayed containing more details about why the job is in the given status and helpful suggestions for resolving the issue. An example is shown below for a job in error.
The screen can be set to auto refresh periodically by selecting the pre-defined interval from the Auto Refresh list. By default, this value is set to five minutes on page load.
Use the Refresh button to refresh the screen immediately.
Use the Recover button to automatically attempt fixing system failures and resume the schedule. This is useful if there is a system or communications failure that interrupts the execution of a schedule.
Last refreshed shows the time and date of the last refresh of the interface.
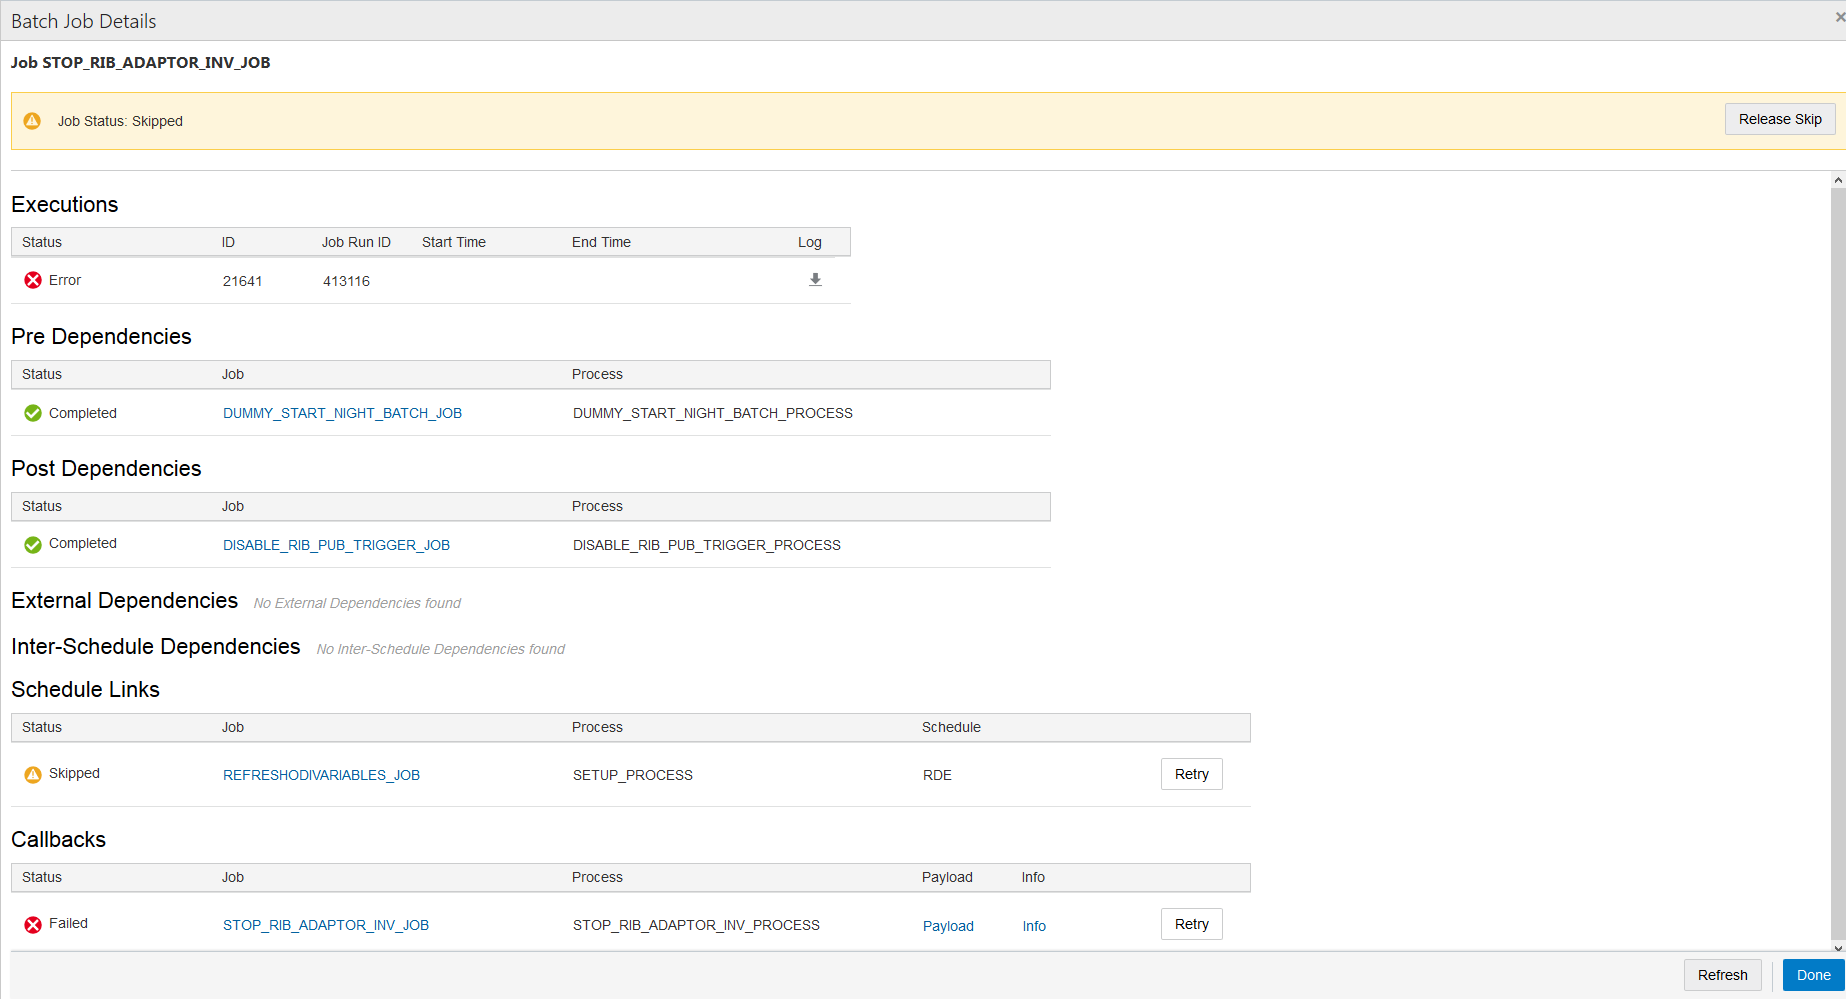
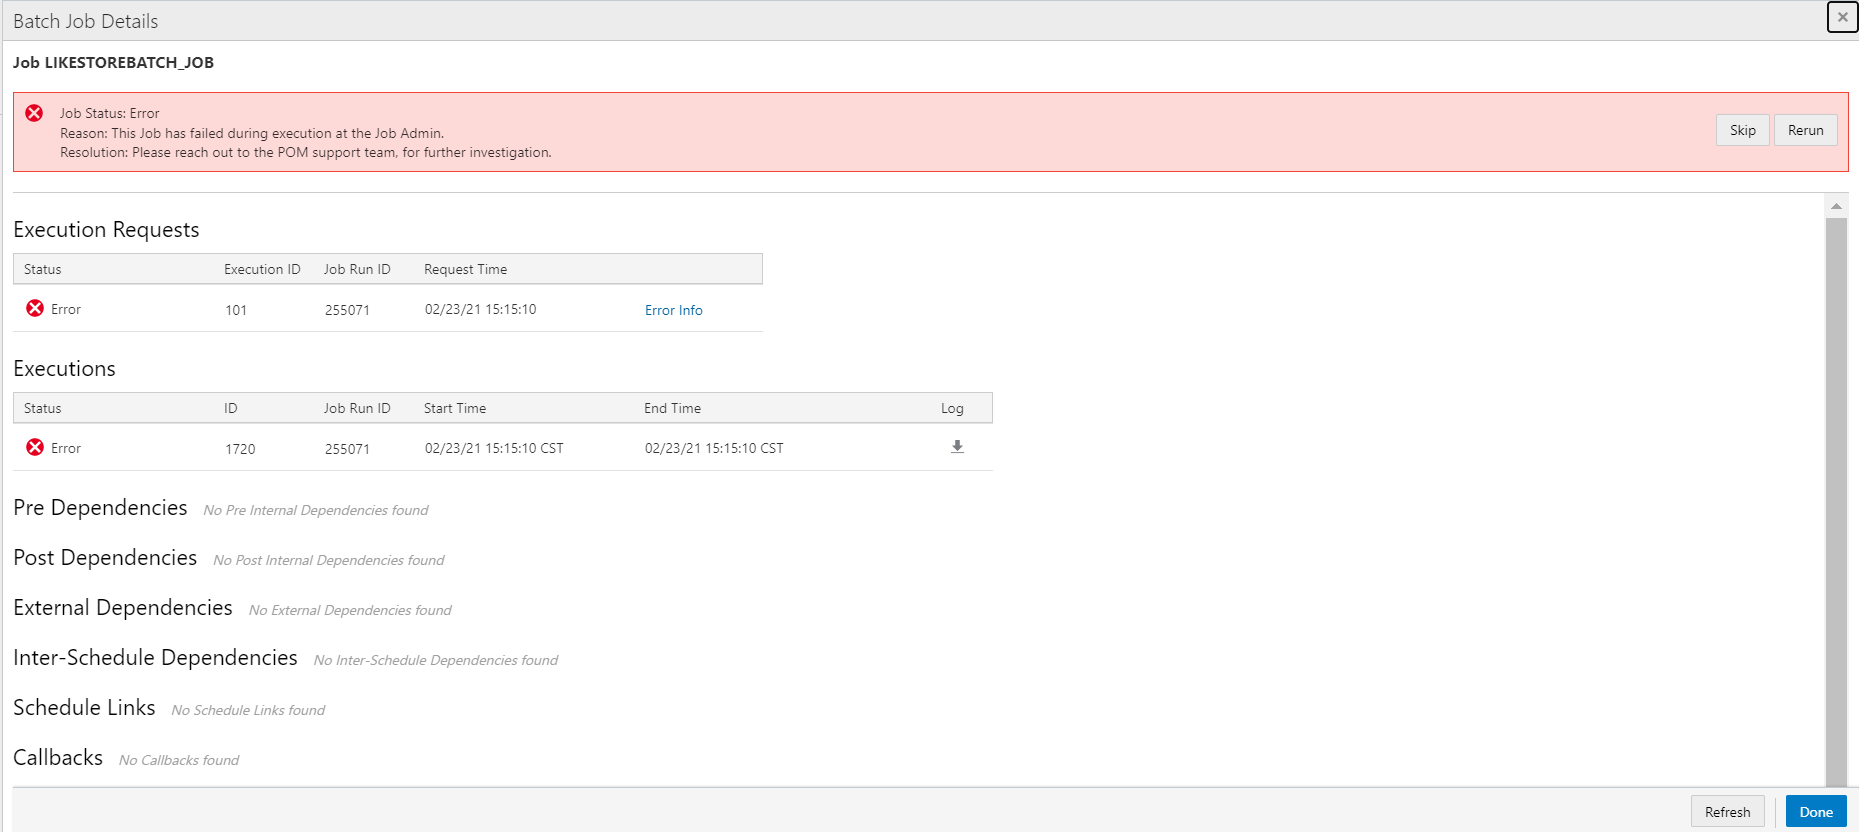
The Batch Job Details screen provides detailed information about a batch job.
Depending upon the status of the job, one or more of the following buttons will be available at the top of the screen:
Hold
Run - This is available only for Standalone jobs.
Release
Release Skip
Rerun
Skip
If the job was executed, this section displays the following information about the job execution:
Status
Execution ID
Request Time
Error Info - This will only show in case of an error status.
If the job was executed, this section displays the following information about the job execution:
Status
ID
Job Run ID
Start Time
End Time
Log - Provides a link to download the execution log.
This section displays the following information about job pre-dependencies:
Status
Job - Click to open the job in the Batch Job Details screen.
Process
A Disable/Enable button is available for jobs that have not yet completed.
This section displays the following information about job post-dependencies:
Status
Job - Click to open the job in the Batch Job Details screen.
Process
A Disable/Enable button is available for jobs that have not yet completed.
An external dependency is usually a dependency on a customer's internal process. This dependency is released once the customer calls an endpoint into POM for a specific POM job. This section displays the following information about job external dependencies:
Status
Job - Click to open the job in the Batch Job Details screen. The job that, when complete, will release the dependency which the currently displayed job is waiting on.
A Disable/Enable button is available for jobs that have not yet completed.
An inter-schedule dependency links the current schedule and a target schedule where a job in the target schedule is dependent on the completion of the currently displayed job in the current schedule. This section displays the following information about job inter-schedule dependencies:
Status
Job - Click to open the job in the Batch Job Details screen. Job which is dependent on the source job.
Process - Process containing the job.
Schedule - Schedule containing the process/job.
A Disable/Enable button is available for jobs that have not yet completed.

This section displays the following information about schedule links for a job:
Status
Job - Click to open the job in the Batch Job Details screen. The job in the Target Schedule that., when completed, will fulfill the dependency for the currently displayed schedule.
Process - The process the job belongs to.
Schedule - The schedule whose job is a dependency for the job in the current schedule.
Info - Shows information regarding error if failed or skipped.
A Disable/Enable button is available for jobs that have not yet completed.
A Retry button is available for schedule links with a Skipped or Failed status.
This section displays the external status update request and response callbacks based on the External Status Update mode set in the External System Configuration screen. This section displays the following information about job callbacks:
Status
Job - Click to open the job in the Batch Job Details screen.
Process
A Payload link to display the Payload Window for the callback.
An Info link to display the Info Window describing the callback response.
A Retry button is available for callbacks with a Skipped or Failed status.
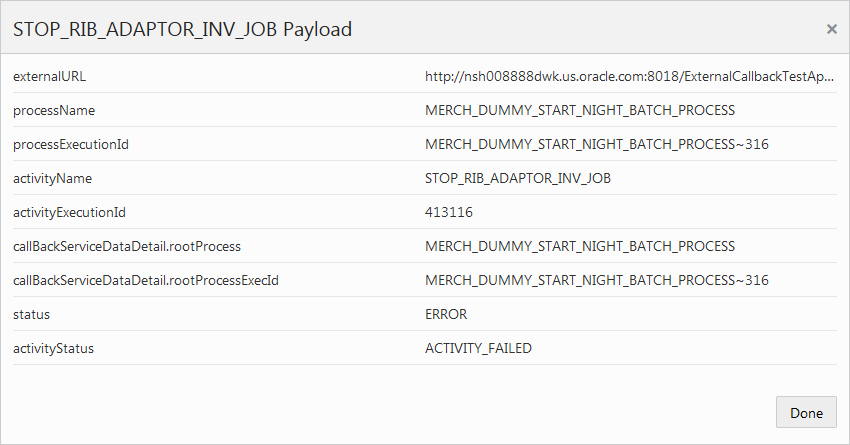
The callback payload window shows the field name and value for each field in the payload.
Select Done to close the window.
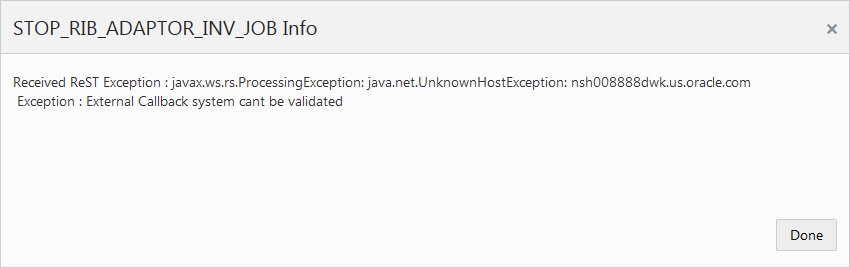
The callback info window shows information about a request and response.
Select Done to close the window.
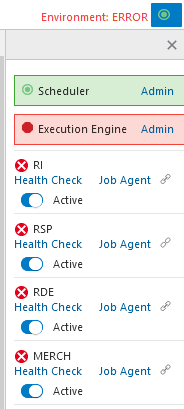
The Status sidebar displays information about the execution engine and the environments that Process Orchestration and Monitoring communicates with to execute batches.
Displays the status of the Scheduler, and an Admin link to enable or disable the scheduler for a particular batch schedule in the Scheduler Administration window.
Displays the status of the execution engine, and an Admin link to configure the execution engine in Execution Engine Administration.
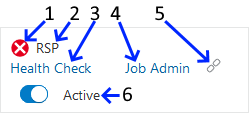
Displays the following for each environment:
Status - Icon indicating the current status of the integration with the environment. This will be either success  or error
  .
.
Environment - Abbreviation of the environment name.
Health Check - Opens the Health Check for the environment.
Job Admin - Opens the Job Admin for the environment.
Link - An icon which indicates if Inter-Schedule Dependencies are enabled or disabled.
Active/Inactive Switch - Turning the switch deactivates the job administration for the environment.
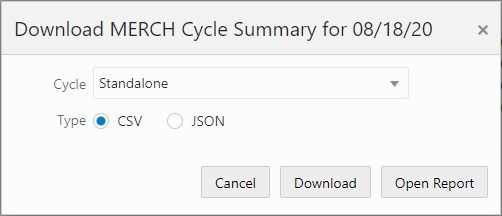
Use the Download Cycle Summary window to download information about a completed batch cycle:
Click Download Cycle Summary in the Batch Jobs Header.
The Batch Cycle Summary window opens.
Use the Cycle menu to select the cycle for which to download the summary.
Select the Type of data to download: CSV (comma-separated values) or JSON.
Click Download to download the summary file, or click Cancel to close the window without downloading.
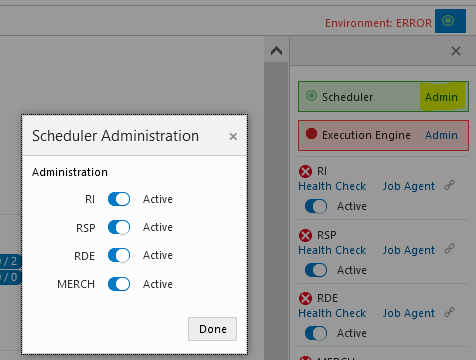
The Scheduler Administration window allows you to enable or disable batch schedules.
When the Scheduler is disabled for a particular schedule, tasks will still be scheduled and will still trigger at the specified time but will immediately move to the Canceled state.
Select the Done button to close the window.
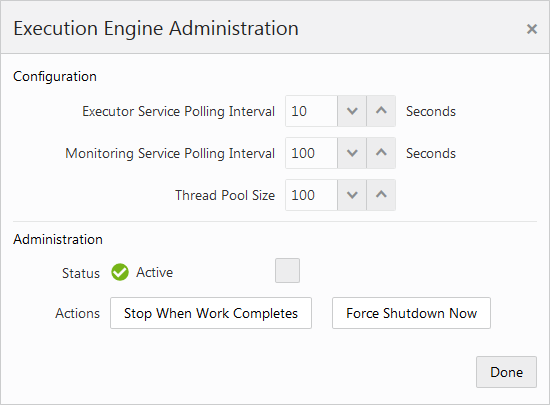
The Execution Engine Administration window allows you to configure the communication between the user interface and the execution engine.
Select the Done button to close the window.
This window has the following configurations:
Executor Service Polling Interval - Determines the number of seconds between each polling interval for the batch execution process on Process Orchestration and Monitoring.
Monitoring Service Polling Interval - Determines the number of seconds between each polling interval for the monitoring process on Process Orchestration and Monitoring.
Thread Pool Size - Maximum number of concurrent threads permitted for use by the Execution Engine.
Status - The status of the communication with the Execution Engine for Process Orchestration and Monitoring.
Refresh - This button refreshes the information in the user interface.
Stop When Work Complete - This button shuts down batch processing when the currently running batch processes have stopped.
Force Shutdown Now - This button shuts down batch processing immediately, including all batch processing currently running.
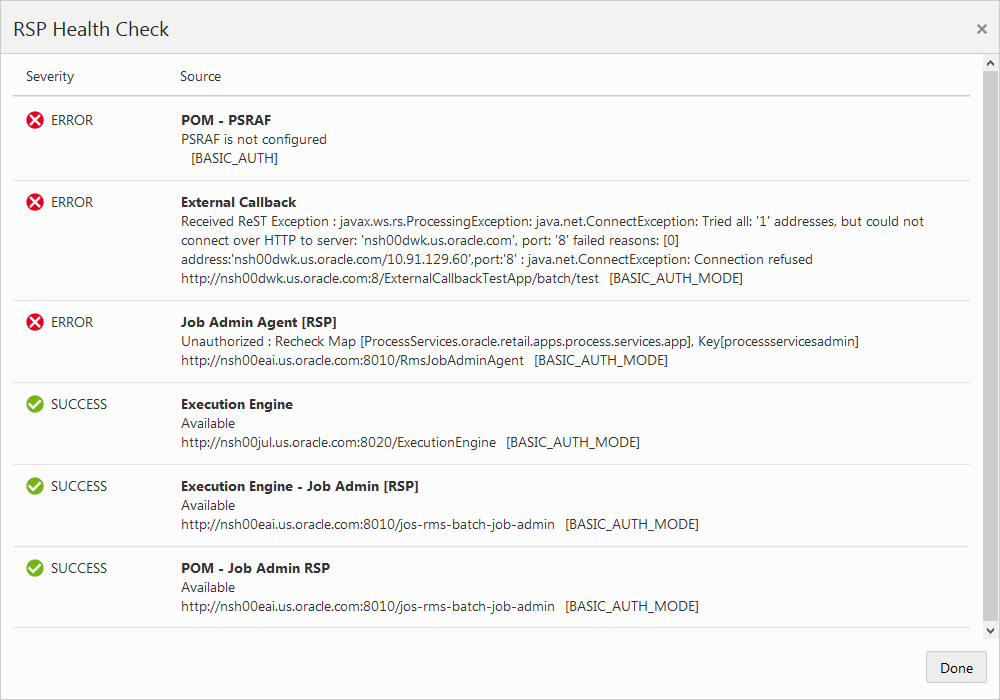
The Health Check window displays the status of the processes communicating with the environment.
This window displays the following for each communication process:
Severity - The severity of any errors in communication:
SUCCESS - The process communicates successfully.
ERROR - The process is not communicating with the environment.
Source - The name of the process and the response received by the process.
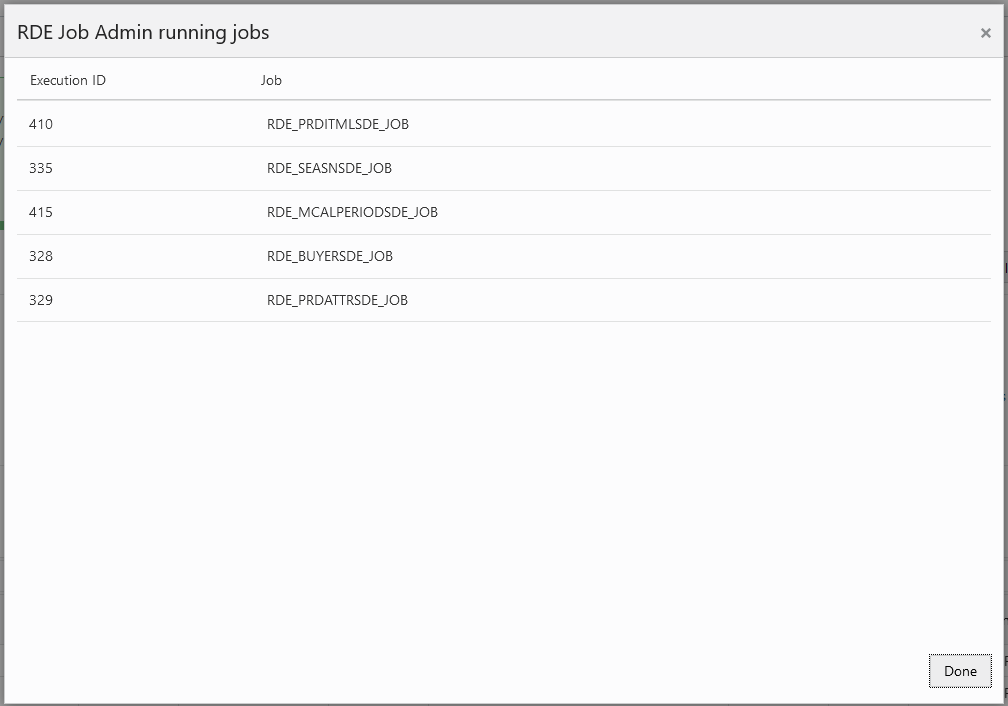
The Job Admin Running Jobs window displays the batch jobs currently running on an integrated environment.
Select the Done button to close the window.
This window displays the following information for each process.
Execution ID
Job
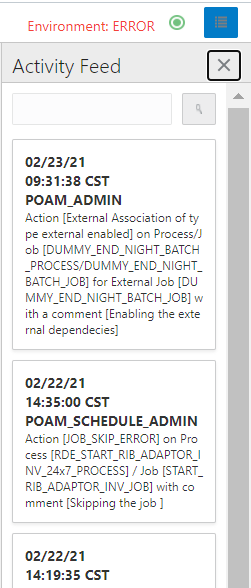
The Batch Monitoring screen includes an Activity Feed icon at the top right corner.
When the icon is clicked, the Activity Feed panel opens on the right side of the screen. The panel displays up to seven days' worth of activities performed both by the system and by users through the user interface.
Click the close window icon ( ) to close the window.
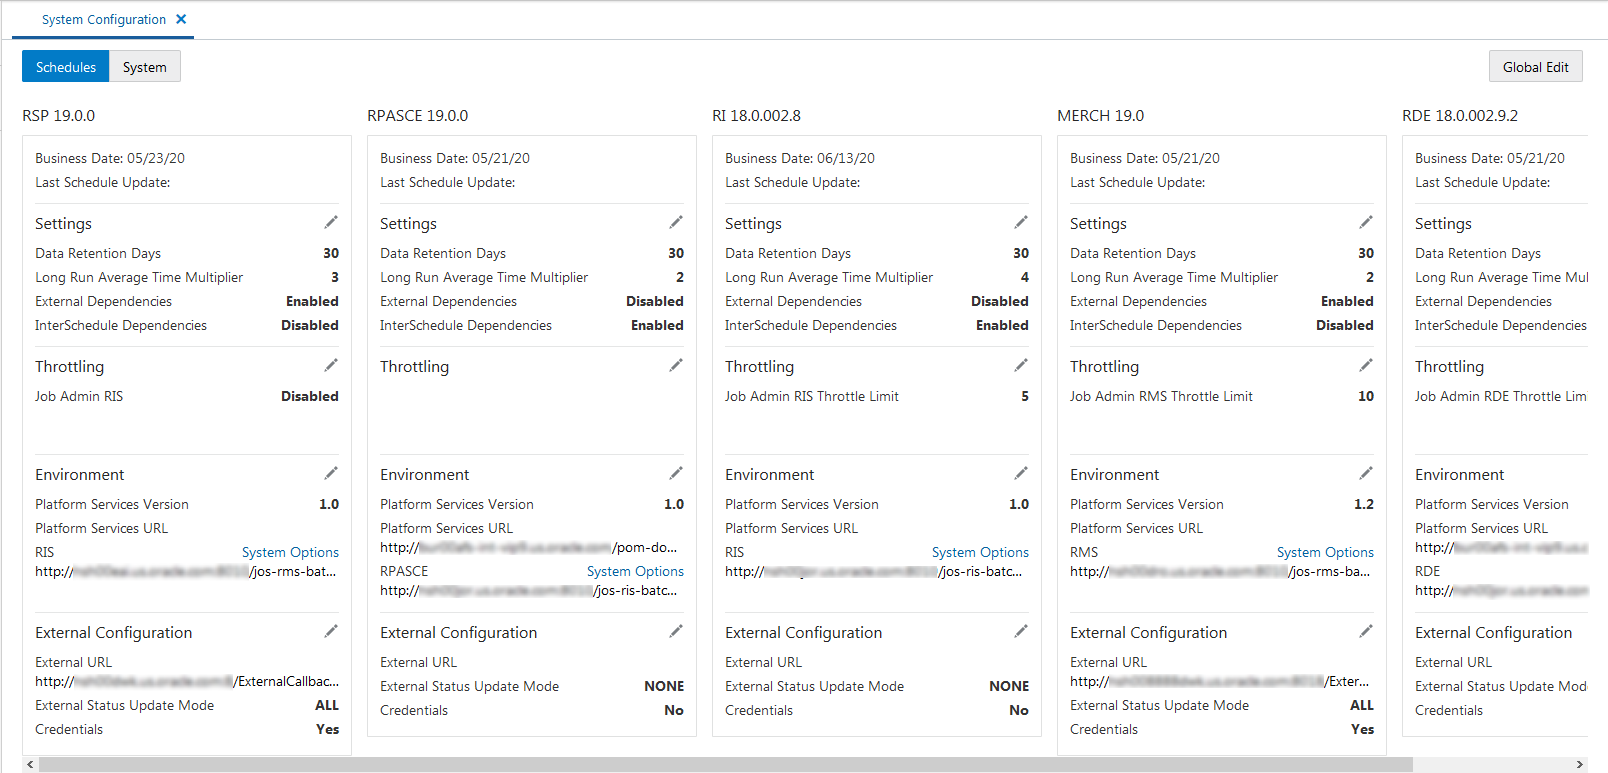
The System Configuration screen allows an administrator to modify parameters and connection properties for the environments integrated with Process Orchestration and Monitoring. It also allows an administrator to maintain POM application level configurations.
Select System Configuration in the Navigation Area to open the System Configuration tab.
Select the Schedules tab on the System Configuration screen to configure the settings and connections for an environment.
The following information is shown for each environment:
Schedule name abbreviation.
Schedule version number.

Business Date - Date for which the specific schedule's batches will run next.
Last Schedule Update - Last date on which the schedule was updated.

Settings - See Edit Settings for details.
Data Retention Days
Long Run Average Time Multiplier
External Dependencies
InterSchedule Dependencies
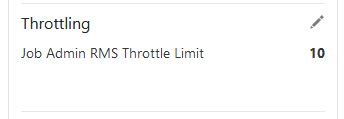
Throttling - See Edit Throttling for details.
Job Admin Throttle Limit
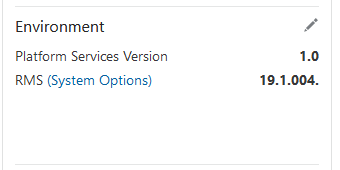
Environment - See Edit Environment for details.
Platform Services Version
Job Admin version
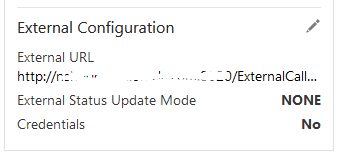
External Configuration - See Edit External Configuration for details.
External URL
External Status Update Mode
Credentials
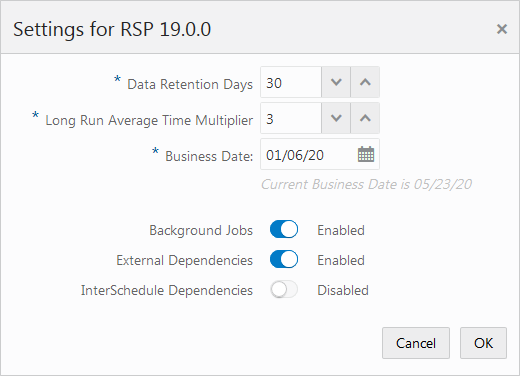
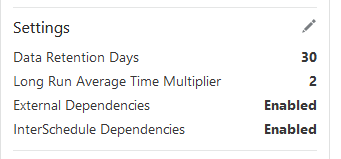
To edit the settings for an environment, click the edit icon ![]() in the Settings section to open the Settings window.
in the Settings section to open the Settings window.
The following settings are available in this window:
Data Retention Days - Number of days for which data is to be retained
Long Run Average Time Multiplier - Used to calculate when a job is considered long running.
A job is long running when its current run time is longer than this number times than the average run time of that job. For example, if a job's average run time is 3 minutes, and the Long Run Average Time Multiplier is 3, then the job is considered long running if it has been running for at least 9 minutes. A notification is sent when a job is deemed long running.
Business Date - The earliest business date for which to run batch schedules. See "Business Date Explained" for an explanation of how POM uses this setting.
Background Jobs - Enable or disable background jobs.
External Dependencies - A switch for enabling or disabling external dependencies.
InterSchedule Dependencies - A switch for enabling or disabling InterSchedule dependencies.
Select OK to save the changes, or select Cancel to exit the window without saving changes.
When the business date is initially set, it's supposed to be set as the First Run Business Date. It's meant for the POM application to compare to the Current Business Date (shown below the Business Date on the screen). If the (First Run) Business Date is earlier than the Current Business Date, POM will run the next batch schedule for the day after the Current Business Date. If the (First Run) Business Date is later than the Current Business Date, POM will run the next batch schedule for that date rather than the day after the Current Business Date.
|
Note: the Current Business Date advances automatically every time batch completes for the day |
The reason the (First Run) Business Date is updatable on this screen, is to give the ability to start the next schedule run at that date, skipping some run days. Here are a couple example scenarios:
Scenario 1: Common Scenario
System Configuration screen's Business Date: 11/28/2019
System Configuration screen's Current Business Date: 08/12/2019
The next batch schedule run will be for business date 08/13/2019.
When that batch run starts, the Current Business Date advances to 08/13/2019 and the screen is updated accordingly.
Scenario 2: Skip a Few Days
System Configuration screen's Business Date: 11/28/2019
System Configuration screen's Current Business Date: 08/12/2019
User changes the Business Date on the Config UI to 08/18/2019
The next schedule run will be for business date 08/18/2019.
When that batch run starts, the Current Business Date moves to 08/18/2019 (since the (First Run) Business Date is greater than Current Business Date) and the screen will be updated accordingly. The (First Run) Business date will remain at 08/18/2019 until changed by an administrator on this screen.
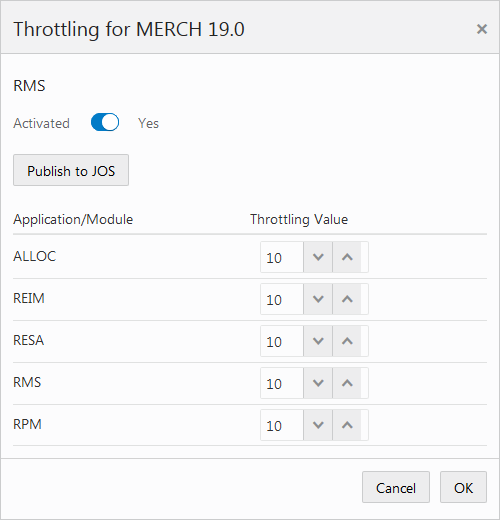
The throttling settings can be changed by selecting the edit icon ![]() in the Throttling section to open the Throttling window.
in the Throttling section to open the Throttling window.
The following settings are available in this window:
Activated - When set to Yes, the Job Admin will throttle the running of jobs according to the setting defined here.
Publish to JOS - Pushes the throttle values from this screen to the JOS Job Admin.
Application/Module - This section allows for update of the throttling value for each application or module in the environment.
Select OK to save the changes, or select Cancel to exit the window without saving changes.
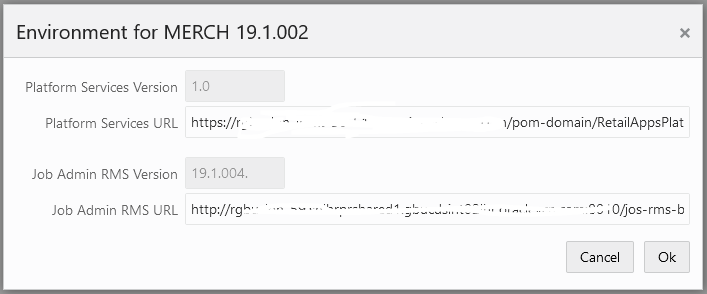
The environment settings can be changed by selecting the edit icon ![]() in the Environment section to open the Environment window.
in the Environment section to open the Environment window.
The following settings are available in this window:
Platform Services Version - Version of the currently deployed Platform Services
Platform Services URL
Job Admin Version - Version of the currently deployed Job Admin
Job Admin URL
Select OK to save the changes, or select Cancel to exit the window without saving changes.
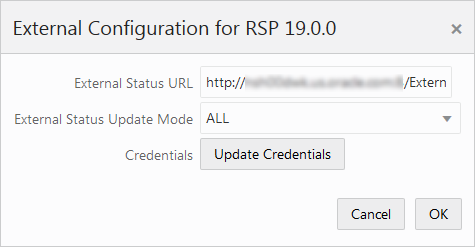
The external configuration settings can be changed by selecting the edit icon ![]() in the External Configuration section to open the External Configuration window.
in the External Configuration section to open the External Configuration window.
The following settings are available in this window:
External Status URL - Customer system's URL that is called when POM is to notify the customer's system. Note that this calling feature is also referred to as Callback.
External Status Update Mode - Job status for which POM is to call the customer's URL. This menu has the following options:
ALL - POM will make a call for each job's execution regardless of success or failure.
FAILED - POM will make a call only for failed jobs.
NONE - POM will never make a call.
Update Credentials - When clicked, User Name and Password fields are shown. Setting these values will update the credentials POM uses to call the customer's URL.
Select OK to save the changes, or select Cancel to exit the window without saving changes.
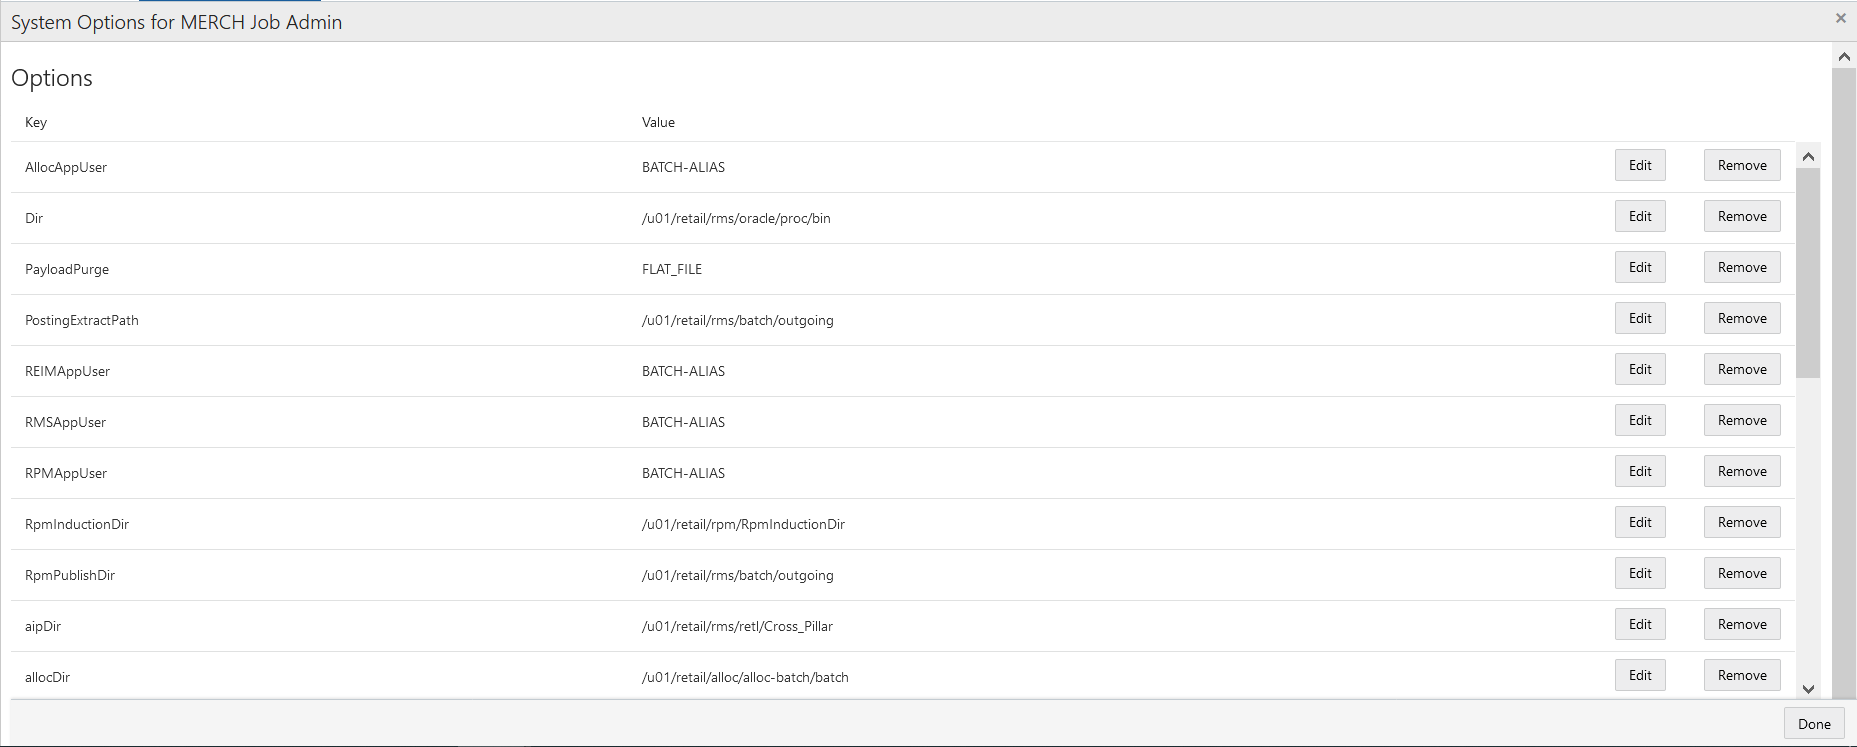
Each Schedule is associated with a number of system options specific to its environment and settings. Those can be edited by clicking on the System Options link located next to the Job Admin in the Environment section.
The system options are a set of key-value pair of attributes and values specific to the given schedule.
The user can edit the values, remove or add options.
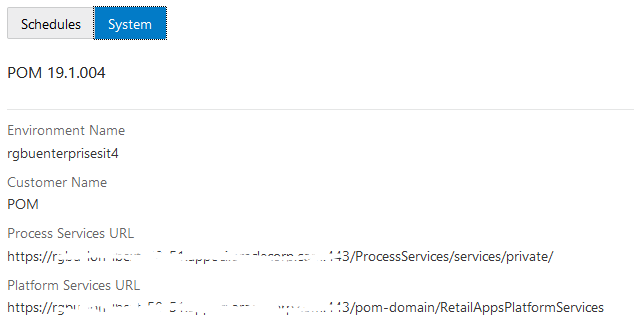
Select the System button in the System Configuration tab to view the system configuration for Process Orchestration and Monitoring.
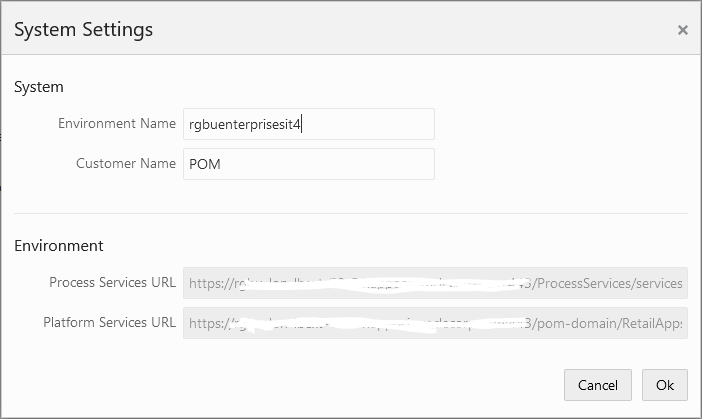
Select the edit icon ![]() in the System Information screen to open the System Settings window.
in the System Information screen to open the System Settings window.
The following settings are available in this window:
Environment Name - This is the physical environments name such as '<customer name> stage 1'.
Customer Name
Process Services URL - This setting cannot be changed. It shows the value of POM's services URL.
Platform Services URL - This setting cannot be changed. It shows the value of the Platform Services URL.
Select OK to save the changes, or select Cancel to exit the window without saving changes.
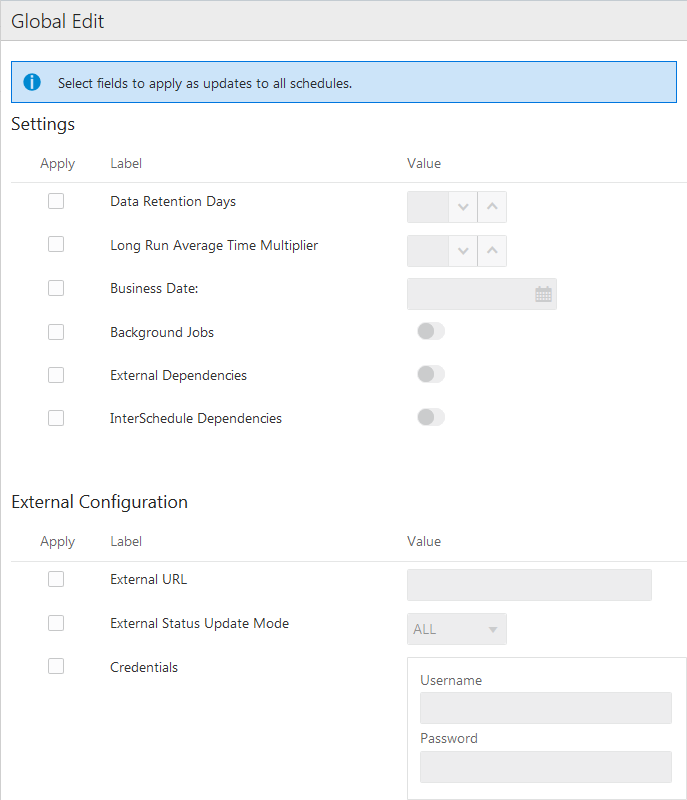
Select the Global Edit button to open the Global Edit screen. This screen sets configurations for all the schedules. Refer to the sections above for explanation of the different configurations.
Use the Apply check boxes to activate the fields for the settings to be applied to all schedules. The following settings can be applied to all schedules:
Data Retention Days
Long Run Average Time Multiplier
Business Date
Background Jobs
External Dependencies
InterSchedule Dependencies
External URL
External Status Update Mode
Credentials:
Username
Password
The batch administration screen provides the ability to maintain information specific to the batch schedule.
Select Batch Administration in the Navigation Area to open the Batch Administration tab.
The Batch Administration header includes the following options:
Batch Tiles - There is a batch tile for each software environment Process Orchestration and Management connects to. Select a tile to show the batch processes for that environment. See "Batch Tiles" for more information about these tiles.
Cycle Tabs - Displays the cycles for which batch information is to be maintained.
Select a cycle tab to see the batch details for that cycle. The following cycles are available:
Nightly
Recurring
Standalone
Export Config - Use this button to export configurations for the selected schedule and cycle. These configurations include Scheduler tasks, throttle values, data retention values and (most importantly) which jobs are enabled or disabled.
When clicked, the user is presented with a dialog for selecting the type of file to export (JSON or Excel)
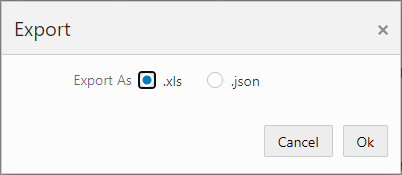
Depending on the user's browser setting, the file is either saved in the default local file system directory or a file save/open dialog is presented first.
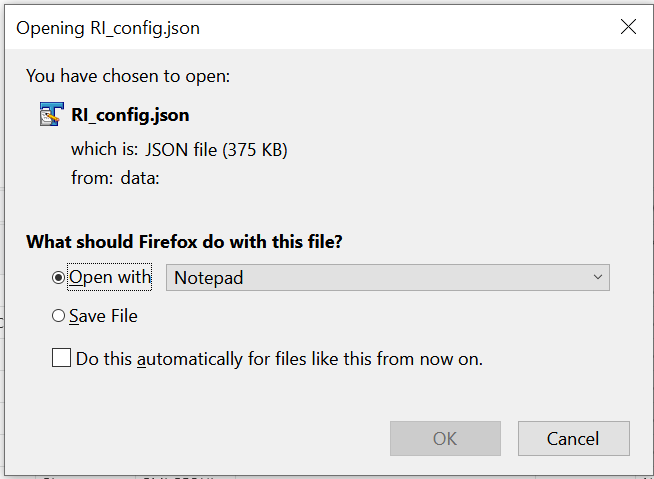
If the export is done for the purpose of applying the same configurations on another environment (Lift & Shift), the user is recommended to export to a JSON file. This file is then used in the Import Config function (explained below) to import the configurations into another environment.
The user has the option to manipulate the exported file before importing back into the same environment or a different one. In that case an export to an Excel file is more suitable for ease of manipulation. Caution needs to be taken when manipulating the content of the exported file, especially for maintaining proper data format.
Refer to the Process Orchestration and Monitoring Implementation Guide for details on applying changes to the exported spreadsheet before importing it back in.
Import Config - Use this button to import new batch configurations for the selected schedule and cycle. When clicked, the user is presented with a dialog to select the desired type of import.
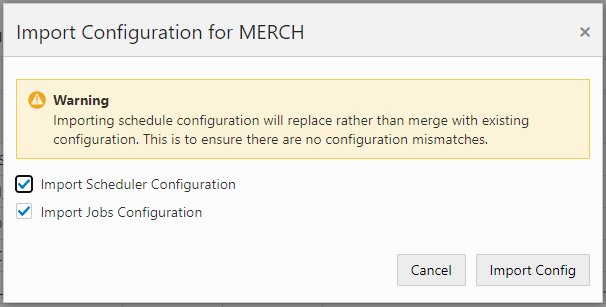
The user can select to import Scheduler tasks configuration or Jobs configuration or both. The jobs configuration includes such settings as throttle values, data retention values, enabled/disabled setting.
Once the import type is selected and the Import Config button is clicked, the user is presented with a file selector dialog (not shown). User can then choose to import a JSON or an Excel file.
When a schedule is being upgraded using the Schedule Maintenance screen or when the schedule upgrade has failed, the user is prevented from most activities on the Batch Monitoring and on the Batch Administration screen.


Each tile displays the following information:
Schedule Name and Version - Displays the abbreviation of the application or application group and the software version.
Cycles and Statuses - Displays the number of batch processes for each cycle.
The information in the batch list depends upon the cycle chosen:
See "Action Menu and Icons" for common actions that can be performed through the Action menu and the icons. You can also perform the following actions:
Table 2-2 Batch Jobs - Actions Menu/Icons and Description
| Actions Menu/Icons | Description |
|---|---|
|
Edit and Edit icon |
Select an item in the table, then select Actions > Edit or the edit icon |
|
Enable All |
Use the Actions > Enable All or the Enable All button to put the process on hold. |
|
Disable All |
Use the Actions > Disable All or the Disable All button to skip the process. |
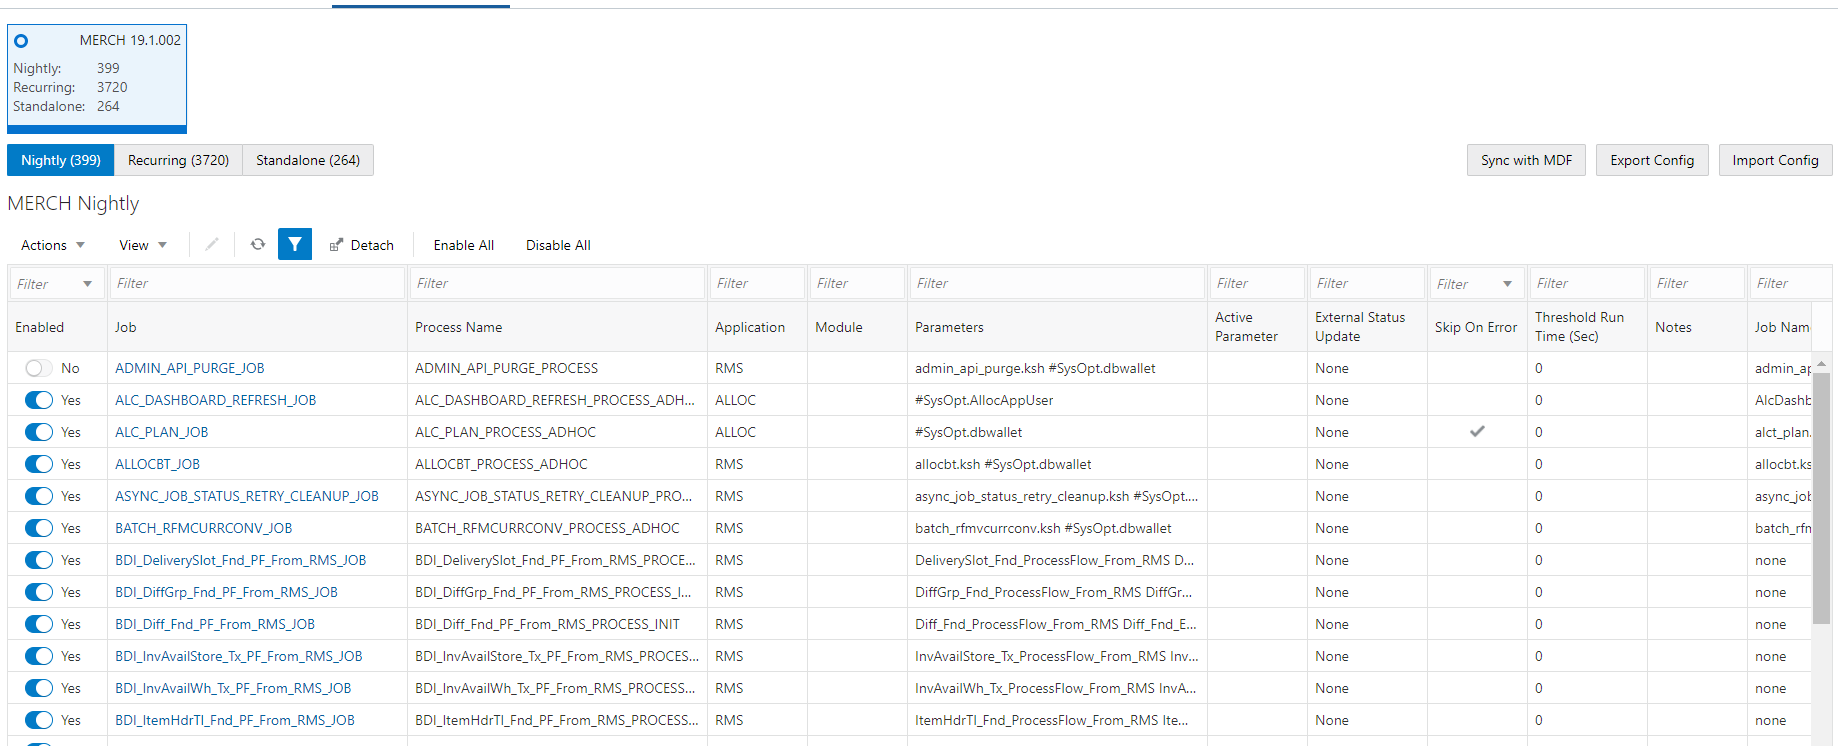
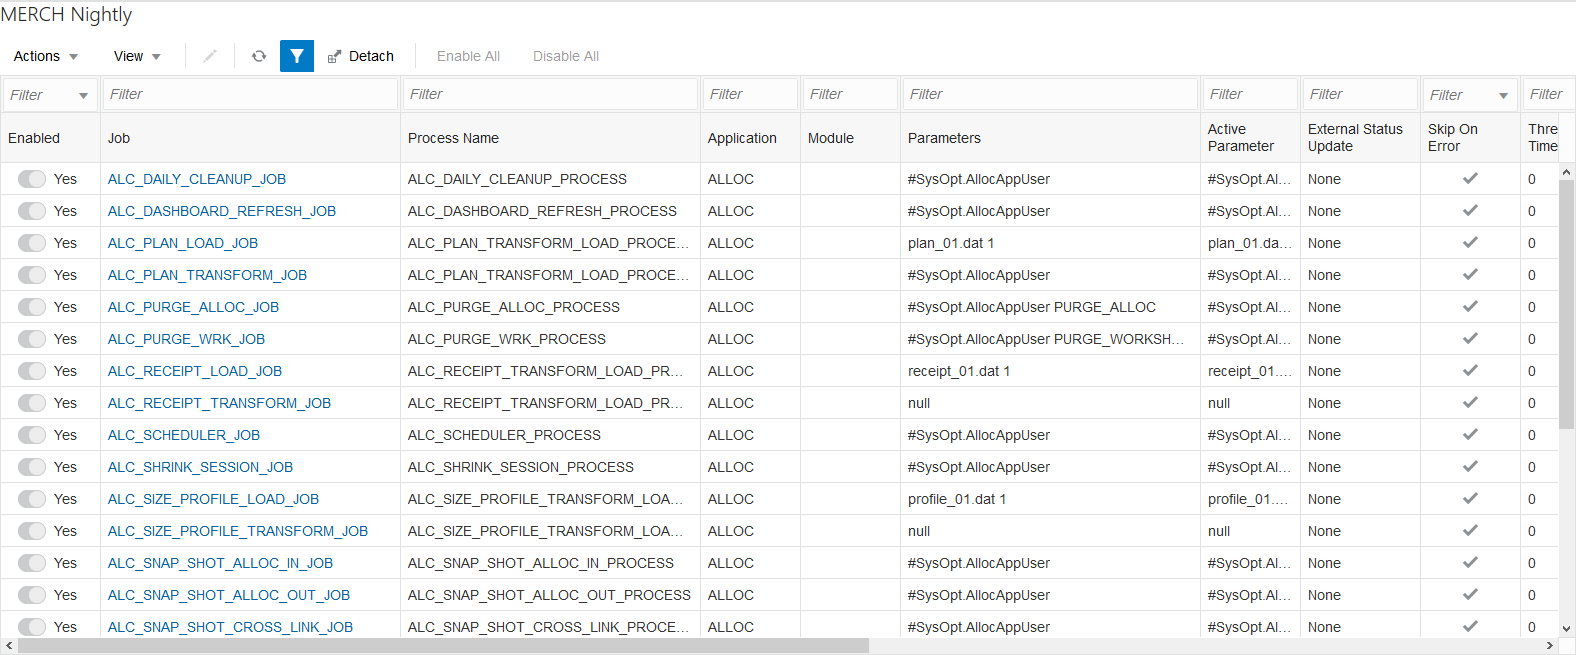
The nightly cycle displays the following information for each batch:
Enabled
Job - Click the Job to open the batch in the Batch Job Details screen.
Process Name
Application - A schedule may be made up of multiple applications. There needs to be at least one application.
Module - An application may be made up of multiple modules. Modules within an application are optional.
Parameters - A job may be run with a list of input parameters. This column always shows the original list of parameters.
Active Parameter - This column shows the customized list of parameters.
External Status Update - Job status for which POM is to call a customer's URL. The URL is defined in the External Configuration section of the System Configuration screen. This column has the following possible values:
ALL - POM will make a call for this job's execution regardless of success or failure.
FAILED - POM will make a call only for if this job fails.
NONE - POM will not make a call.
Skip On Error - Skip this job if it fails.
Threshold Run Time (Seconds) - Amount of time greater than which the job is deemed long running.
Notes
Job Name
Job Wrapper Name
Days of the Week - Days of the week for which the job is to be run.
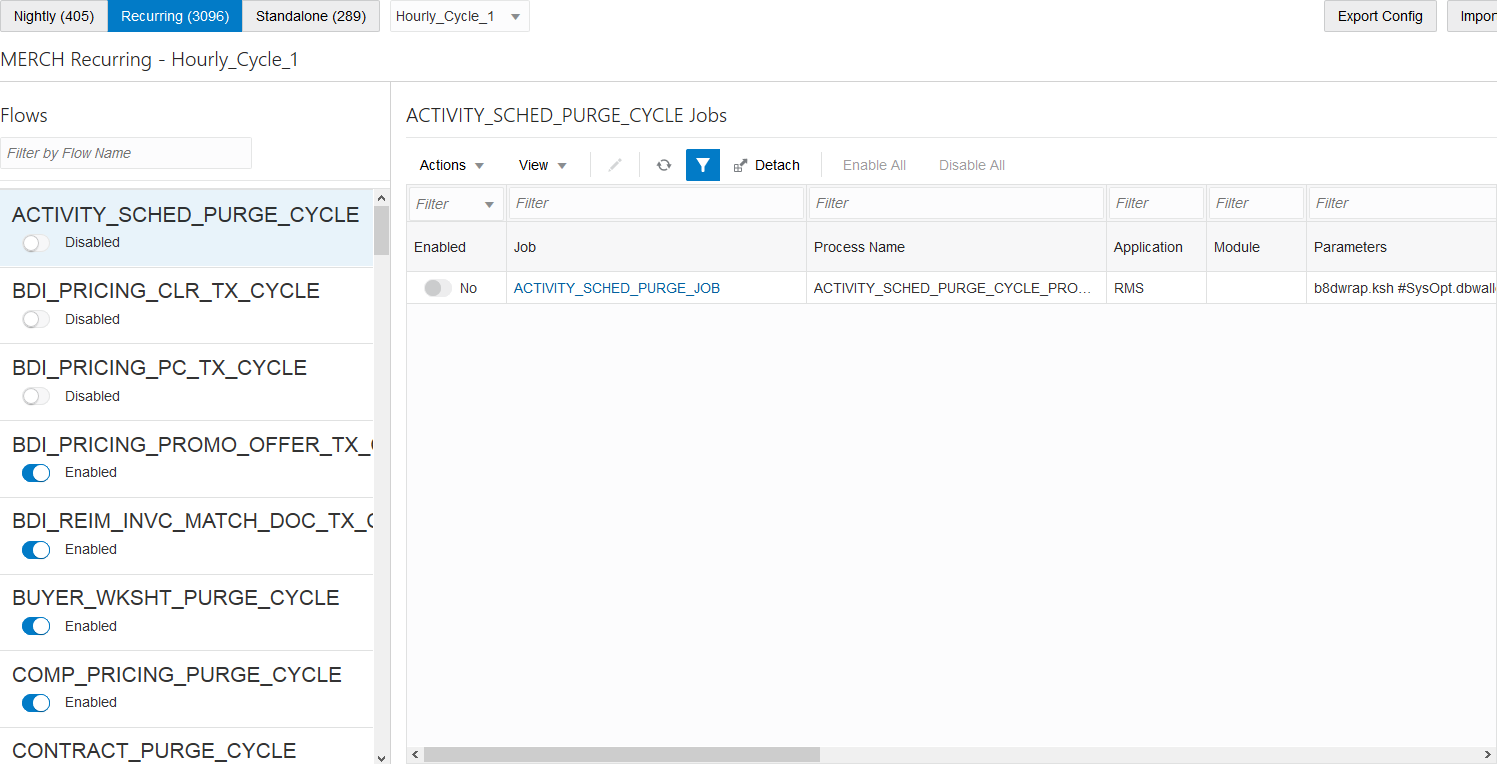
The Recurring cycle includes an Hourly Cycle menu. Select an hour in this menu to choose the hour of the day during which the displayed jobs will run.
The recurring cycle includes the following information for each batch:
Flows - Select a flow in the Flows list to view all jobs for that flow. The following information is shown for each flow:
Flow Name
Enabled or Disabled
Jobs - The Jobs list shows the following information for each job. Refer to the Nightly cycle above for an explanation of each field:
Enabled
Job - Click the Job to open the batch in the Batch Job Details screen.
Process Name
Application
Module
Parameters
Active Parameter
External Status Update
Skip On Error
Threshold Run Time (Seconds)
Notes
Job Name
Job Wrapper Name
Days of the Week
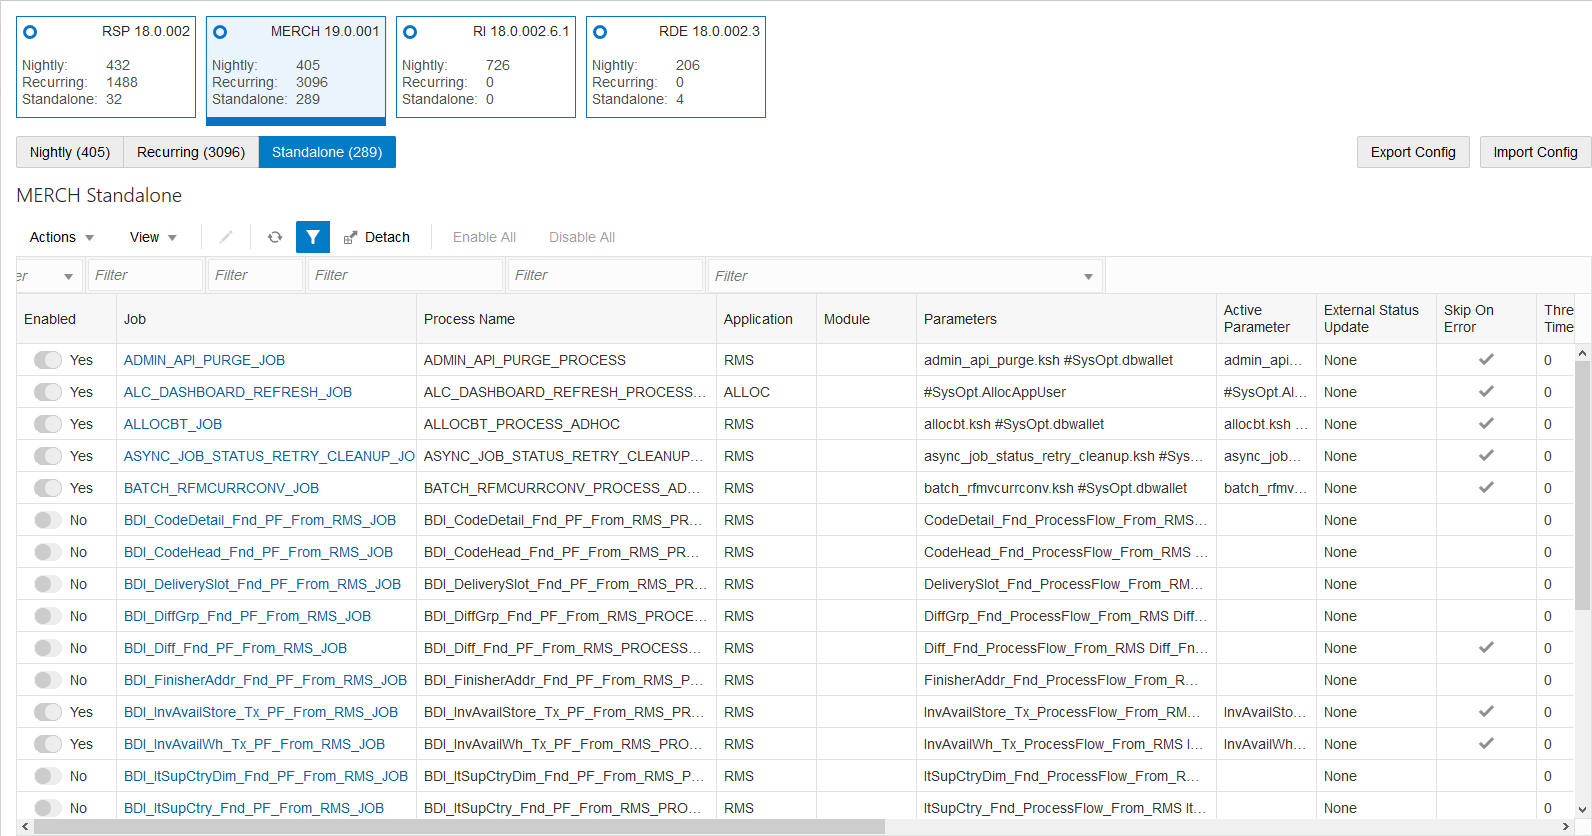
The standalone monitoring cycle includes the following information for each batch. Refer to the Nightly cycle above for an explanation of each field:
Enabled
Job - Click the Job to open the batch in the Batch Job Details screen.
Process Name
Application
Module
Parameters
Active Parameter
External Status Update
Skip On Error
Threshold Run Time (Seconds)
Notes
Job Name
Job Wrapper Name
Days of the Week
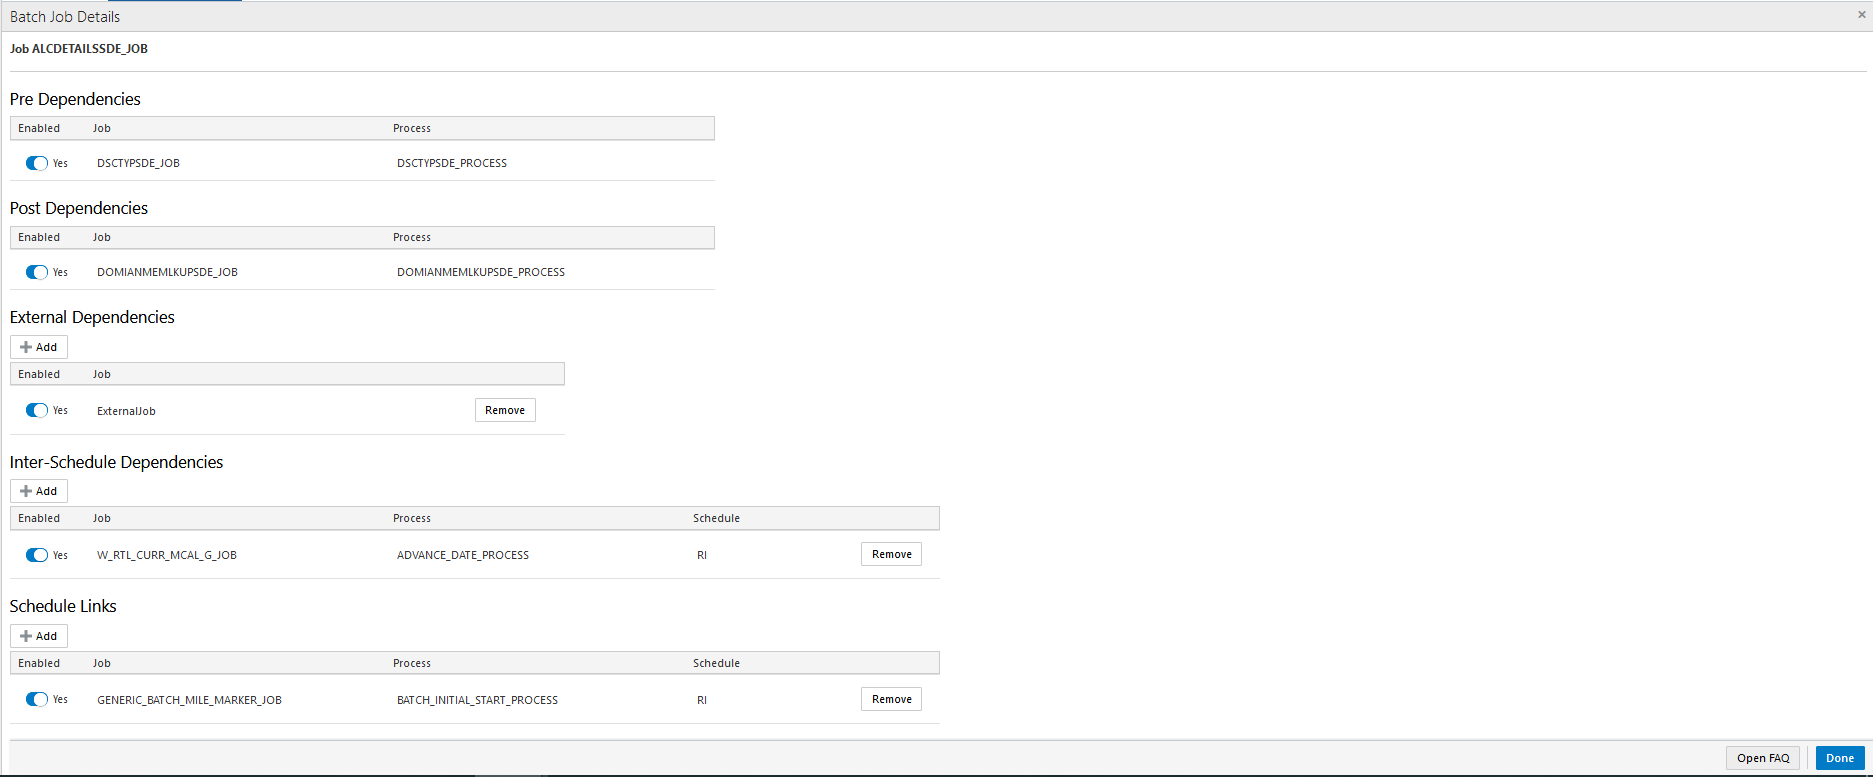
The Batch Job Details screen allows maintenance of various types of dependencies associated with a batch job.
This section displays the following information about a job's pre-dependencies:
Enabled - Switch to enable or disable the pre-dependency.
Job
Process
This section displays the following information about a job's post-dependencies:
Enabled - Switch to enable or disable the post-dependency.
Job
Process
This section allows for the maintenance of the following information about a job's external dependencies. An external dependency is normally a process internal to a customer's system.
Enabled - Switch to enable or disable the external dependency.
Job
A Remove button is available to delete the external dependency.
This section allows for the maintenance of the following information about a job's inter-schedule dependencies. An inter-schedule dependency is a dependency for the current job on a job belonging to another batch schedule. The job for which this Jobs Detail screen is shown will wait for the job entered here.
Enabled - Switch to enable or disable the inter-schedule dependency.
Job - Name of job belonging to the other schedule.
Process - Name of process containing Job.
Schedule - Name of other schedule containing the dependency.
A Remove button is available to delete the inter-schedule dependency.
This section allows for the maintenance of the following information about schedule links for a job. Schedule links are a way to link schedules together where the completion of the job in the current schedule causes the start of execution of the dependent schedule.
Enabled - Switch to enable or disable the schedule link.
Job - Name of job belonging to the dependent schedule.
Process - Name of process containing Job.
Schedule - Name of the dependent schedule.
A Remove button is available to delete the schedule link.
The Scheduler Administration screen displays information about the different cycles' Scheduler tasks and allows for their administration.
When an application's batch schedule is first created within POM, Scheduler tasks are created for each of the different cycles as follows:
One task for Nightly
One task for each of the recurring flows
One task for each of the standalone processes
The tasks are all originally created in a disabled state.
An administrator would then access the Scheduler Administration screen to configure all available tasks according to the specific customer's needs.
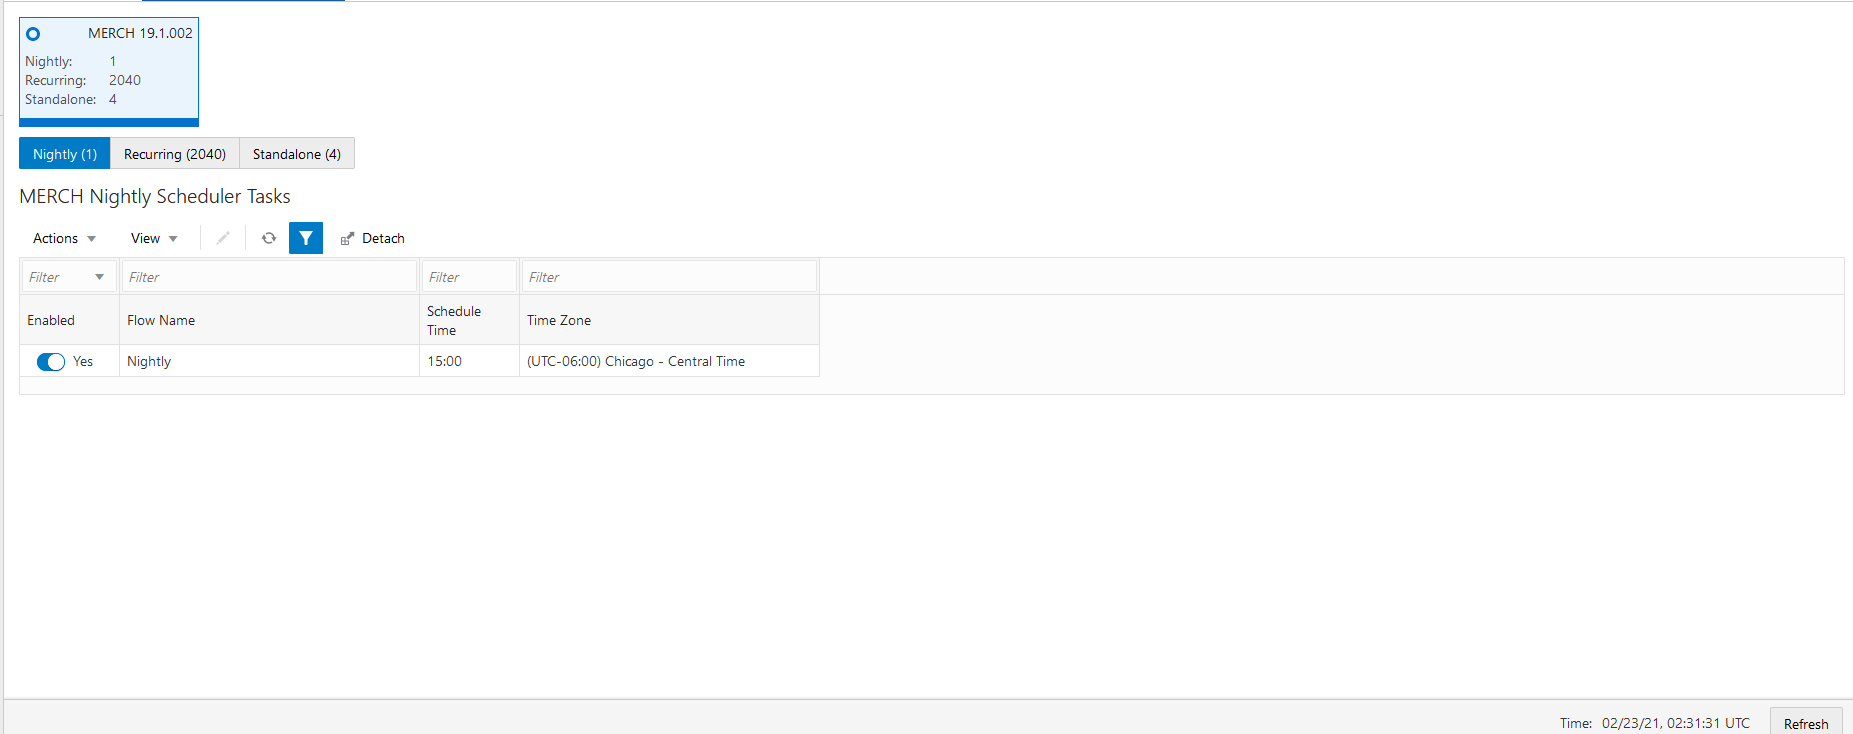
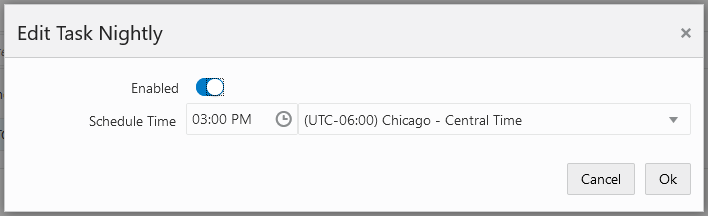
On the Scheduler Administration screen, the user selects a schedule tile at the top of the screen and the Nightly tab right below the tile. The Nightly cycle's Scheduler task is shown in the tasks table below.
|
Note: There is only one Nightly Scheduler task, as there is only one Nightly batch run. |
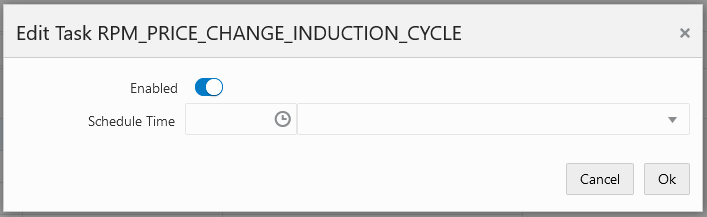
The user can either edit the schedule time in-line or select the row, click the edit icon then edit the schedule run time in the Edit Task Nightly popup.
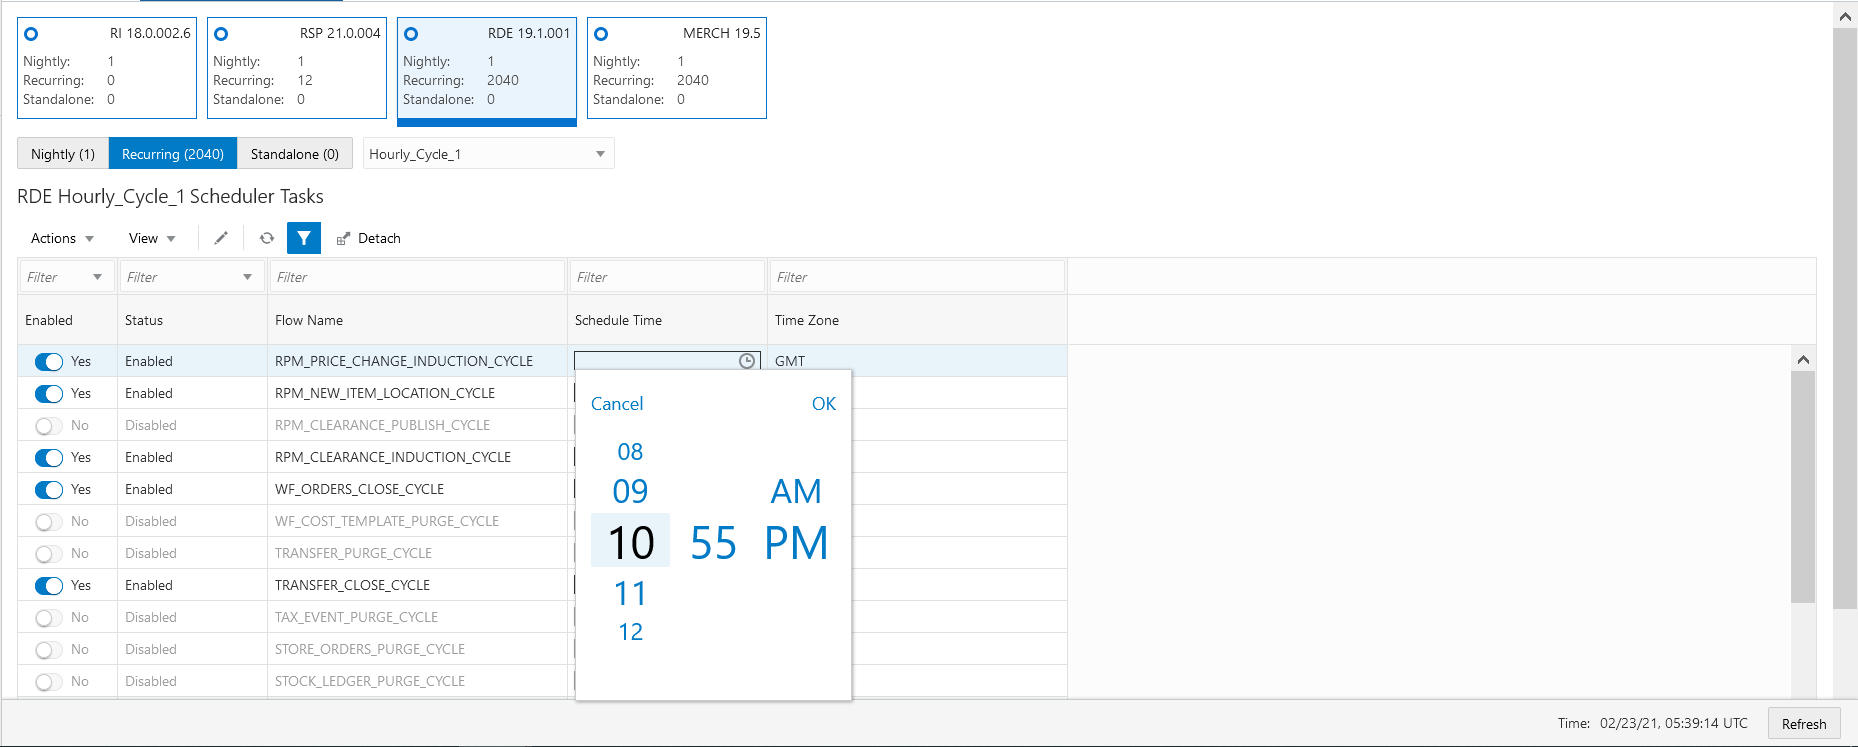
On the Scheduler Administration screen, the user selects a schedule tile at the top of the screen then the Recurring tab right below the tile then the hourly flow from the drop down to the right of the Recurring tab. The Recurring flow's Scheduler tasks are shown in the tasks table.
The user can either edit the schedule time for each task in-line or select a task, click on the edit icon then edit the schedule run time in the Edit Task popup.
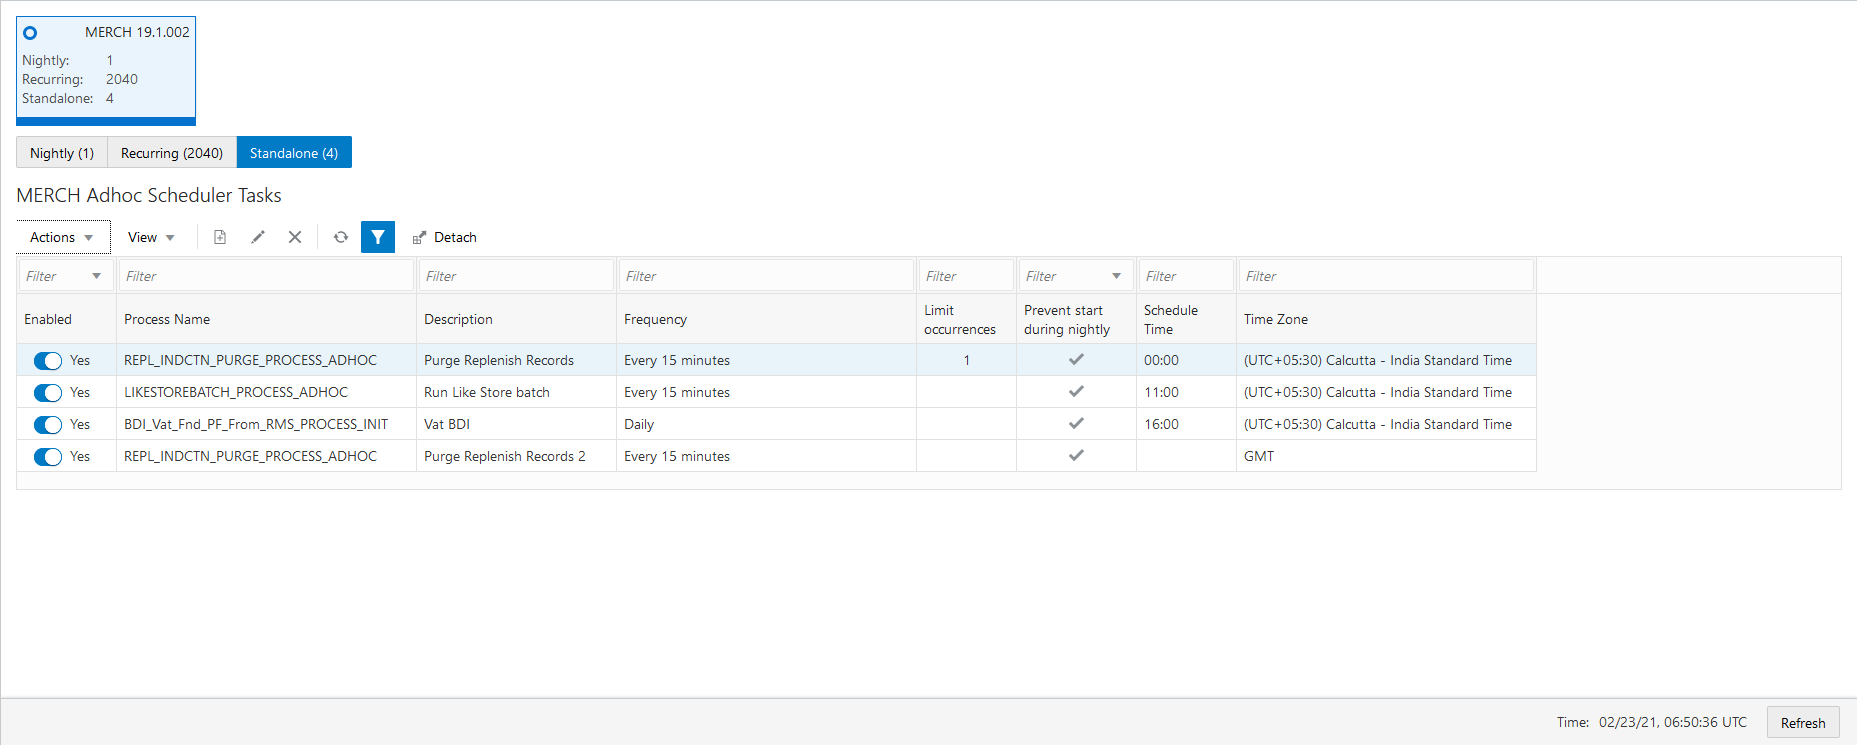
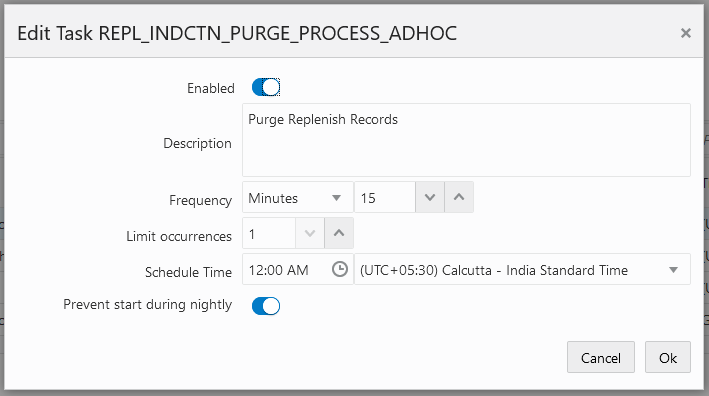
In the Scheduler Administration screen, the user selects a schedule tile at the top of the screen and the Standalone tab right below the tile. The Standalone cycle's Scheduler tasks are shown in the tasks table.
The user can either edit the schedule time for each task in-line, or select a task then click the edit icon to change any of the fields shown in the Edit popup below.
The user can also create and delete Standalone tasks.
|
Note: The user has the option to enter a blank time as long as a frequency in minutes is entered. This will cause the first occurrence to execute immediately. |
|
Note: The Prevent start during nightly switch prevents the task from running while the Nightly batch is running. However, it won't stop a run that is in progress when the Nightly process starts. |
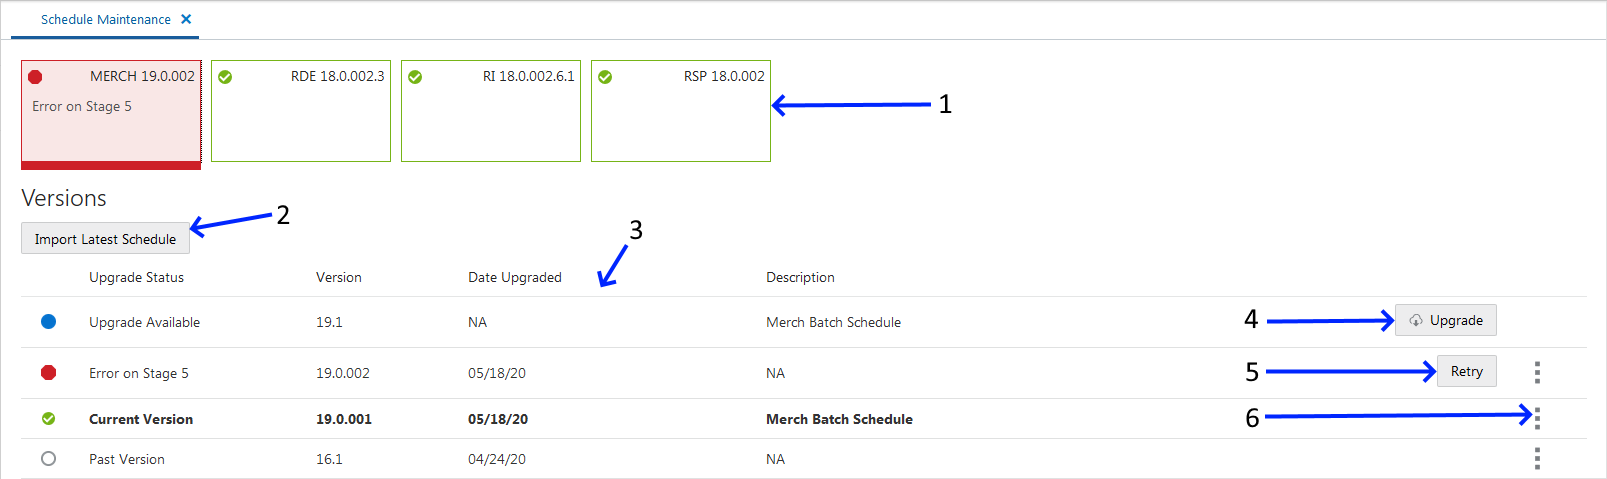
The Schedule Maintenance screen displays information about the batch schedule upgrade results. You can upgrade a batch schedule to a new version through this screen.
Batch Tiles - There is a batch tile for each schedule available in Process Orchestration and Management. Select a tile to show the history of the selected schedule's upgrades or available upgrades.
Import Latest Schedule - Use this button to upgrade the selected schedule from a spreadsheet. When clicked, a file selector dialog is displayed (not shown).
The import file is a spreadsheet.
Update History Status List - Displays information about each past or available upgrade of the batch schedule. This menu displays the following information for each batch upgrade:
Upgrade Status
Version
Date Upgraded
Description
Upgrade - Use this button to upgrade the schedule. This button only appears for schedules for which an upgrade available.
Retry - Use this button to retry a failed update. This button only appears for schedules that have not completed successfully.
Download files menu - Use this menu to download schedule files. See "Download Files" for more information.
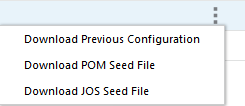
Click on the ellipses then select from the download files menu to download files for an upgrade version. This menu has the following options:
Use the Download Previous Configuration option to download a file containing the specific schedule version configurations. This file is in JSON format.
Use the Download POM Seed File to download an SQL file with POM seed data for the specific schedule version.
Use the Download JOS Seed File option to download an XML file with JOS Job Admin seed data for the specific schedule version.
The screen can be set to auto refresh periodically by selecting the pre-defined interval from the Auto Refresh list. By default, this value is set to 30 minutes on page load which means the Auto Refresh is turned off.
Use the Refresh button to refresh the screen immediately.
Last refreshed shows the time and date of the last refresh of the interface.
The AMS Utilities are functions performed only by the Oracle administrators.
Select AMS Utilities in the Navigation Area to open the AMS Utilities tab.
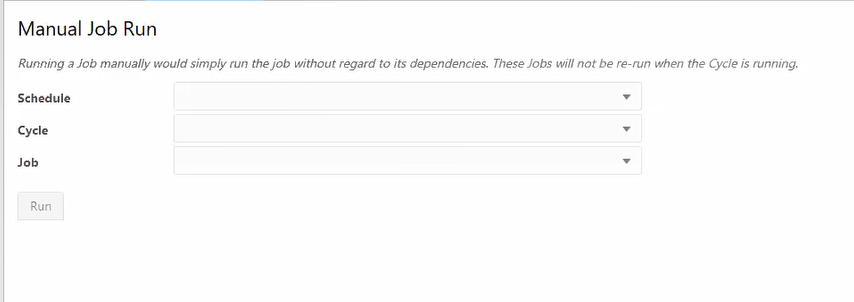
The AMS Utilities screen contains multiple utilities, the first of which is the Manual Job Run. An Oracle administrator uses this utility to run a job for a particular schedule from either the Nightly or Hourly cycle. Once the selections are made, the user clicks on Run to submit the job for execution. The user then uses the Batch Monitoring screen to monitor the execution of the job.
Note that a job that is manually run on this UI is run standalone without regard to dependencies.