| Oracle® Retail Merchandising Foundation Cloud Service Reports User Guide Release 21.0.000 F41858-01 |
|

 Previous |
 Next |
| Oracle® Retail Merchandising Foundation Cloud Service Reports User Guide Release 21.0.000 F41858-01 |
|
Previous |
Next |
Dashboard reports are role-based and can be configured to be the first screen displayed upon opening the application. They are intended to highlight actionable or frequently monitored activities. Actions taken from dashboard reports are either executed seamlessly, or launched into a solution's screen-passing parameters to facilitate further investigation.
Merchandising provides six dashboards out of the box, each with a predefined set of reports. These reports provide a point of view on the information that is relevant to that particular role in a retailer's organization. But, because you may organize your users in a different manner, there is flexibility to change which reports are displayed on which dashboards. You can also add custom reports, if desired. For more information on making these changes see the Merchandising Customization and Extensions Guide.
Users can configure dashboard reports by defining various parameters such as threshold values, default options, department level exceptions and so on. These parameters can be defined in Reports Options screen in Merchandising. See "Report Options" for more about these configurations.
|
Note: For some of the dashboard reports described in this section, the criteria for the report is based on a create date or a last updated date for an entity or transaction. For some transactions, these are updated based on the server date, which for SaaS implementations is based on the GMT time zone, rather than the Merchandising virtual date (vdate). |
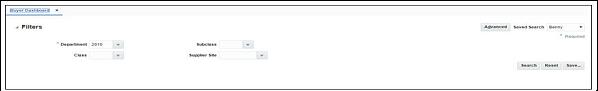
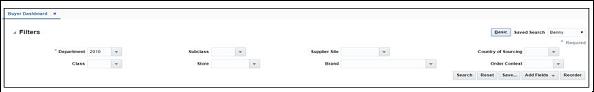
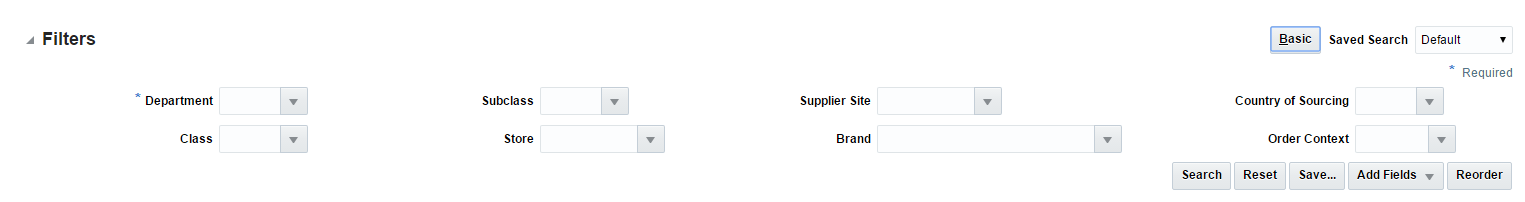
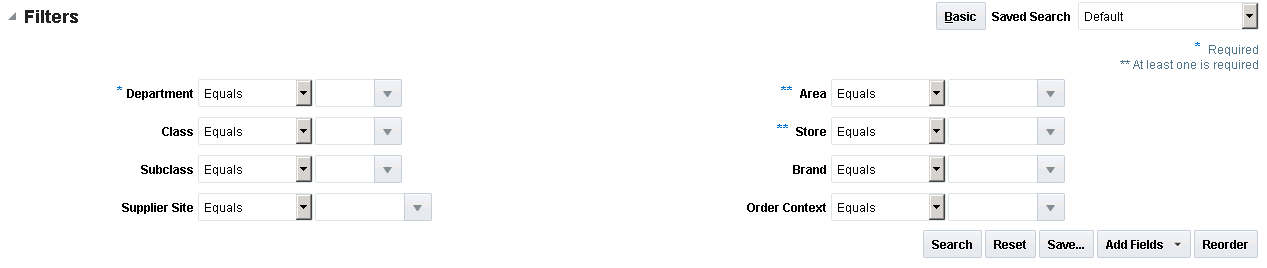
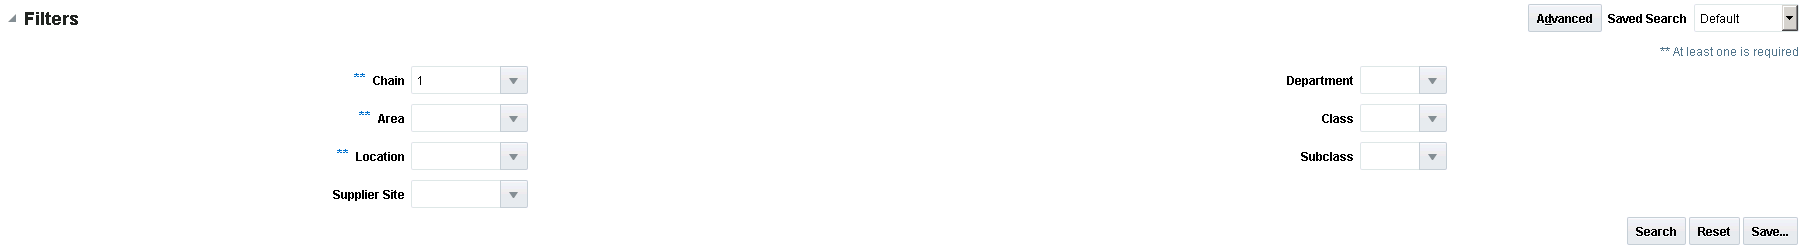
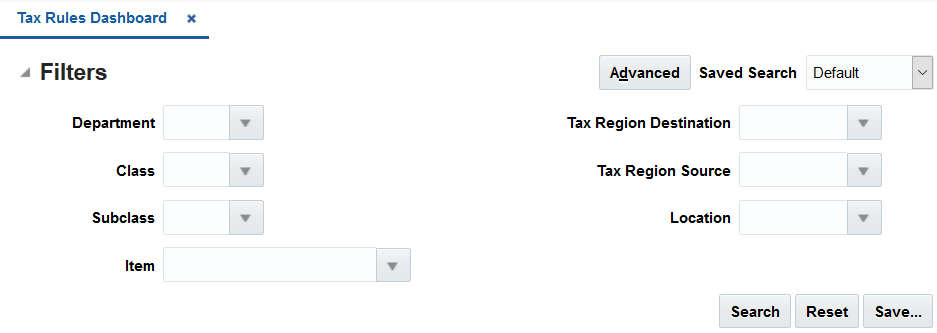
Each dashboard in Merchandising has a number of filters such as department, location, chain, and so on. These filters can be used to narrow down the information shown in the reports on that dashboard. The filters differ by dashboard and most of the dashboards have at least one mandatory filter where criteria value needs to be specified to populate reports. You can use these filters to configure the data displayed in your dashboard to be specific to your area of responsibility. The criteria can be provided either in Basic or Advanced mode, depending on the requirement. Basic is the default mode when the dashboard is entered. Click Advanced to access the filters panel in advanced mode where additional criteria can be specified. You can return to Basic mode by clicking Basic in the Filters section of the dashboard.
To filter the dashboard reports through the basic search criteria:
Enter, select or search default filter criteria in the Filters pane in basic mode.
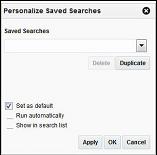
You can also click on the Saved Search drop down button to select one of the saved sets of filter criteria. Selecting a saved search will populate filters with saved filter criteria. If the saved search is selected to run automatically then the search will be executed too. You can also choose to manage and personalize saved searches by clicking Personalize in the list, which opens the Personalize Saved Searches window. For more information on personalized saved searches, see the section Personalize Saved Search.
Click Search. The data that matches the filter criteria is displayed in the dashboard reports.
Click Reset to remove the specified filter criteria.
Click the Save.. button to save the current set of filter criteria as a Saved Search. The Create Saved Search window appears. For information on the Create Saved Search window, see the section Create Saved Search.
To filter the dashboard reports through advanced search criteria:
Enter, select or search the filter criteria in the Filters pane in advanced mode.
You can also click on the Saved Search drop down button to select one of the saved sets of filter criteria. Selecting a saved search will populate filters with saved filter criteria. If the saved search is selected to run automatically then the search will be executed too. You can also choose to manage and personalize the saved searches by clicking Personalize in the list which opens the Personalize Saved Searches window. For more information on personalize saved searches, see the section Personalize Saved Search.
Click Search. The data that matches the filter criteria is displayed in the dashboard reports.
Click Reset to remove the specified filter criteria.
Click the Save.. button to save the current set of search filter criteria as a Saved Search. The Create Saved Search window appears. For information on the Create Saved Search window, see the section Create Saved Search.
Click Add Fields to add more filter criteria. To remove the field from the filter, click the x right next to the field.
Click Reorder to change the order of the available fields. The Reorder Search Fields window appears.
Select the desired field and use the up and down arrows to rearrange the order of the fields.
Click OK to confirm the new order of the fields and close the window.
Click Cancel to reject any changes and close the window.
Select Personalize from the Saved Search list to view the personalized saved searches. The Personalize Saved Searches pop up allows you to edit, copy, or delete saved search criteria set.
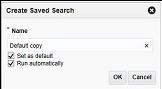
You can save a set of search criteria by clicking the Save.. button in the Filters panel after you have entered the criteria for your search. The Save button will call up the Create Saved Search window where the search criteria set is given a name and the user determines whether it should be the default search as well as whether it should be run automatically.
To view the created saved search:
Click the Save.. button. The Create Saved Search window appears.
Enter the name of the search.
You can also choose to save the combination of the search criteria by selecting the following check boxes:
Set as default
Run automatically
This dashboard is intended to be used by buyers in a retail organization. Buyers are generally focused on managing sales and margin performance to plan and orders. Their key areas of responsibility include monitoring sales, open to buy, shipments and PO approval. The reports in this dashboard allow buyers to monitor shipments for potential impacts on OTB and highlight orders that are waiting their approval.
This dashboard has following filters:
Basic
Department*
Class
Subclass
Supplier Site
Advanced
Store
Brand
Country of Sourcing
Order Context
|
Note:
|
To view the buyer dashboard, from the task bar menu select Reports > Buyer Dashboard. The Buyer Dashboard page appears.
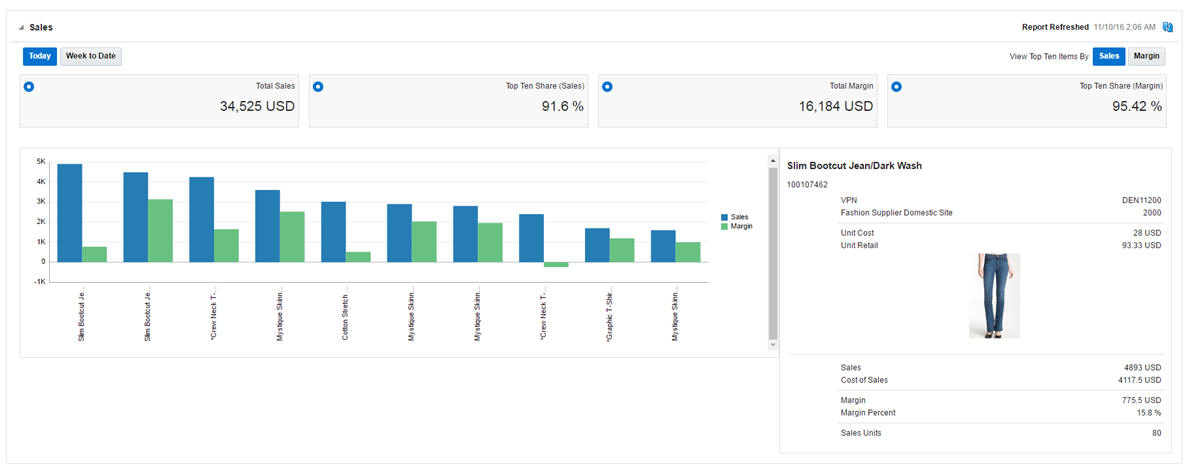
This report shows the sales and margin information of the top ten items by sales or margin based on the dashboard filter criteria. The buyer can choose to see this information for today's sales or sales for the week to date.
The following dashboard filters are used by this report. For each, it is possible for multiple values to be selected, in which case it will be considered an "and" condition for this report.
Department (mandatory filter) - Values for specified hierarchy will be shown.
Class - Values for specified hierarchy will be shown.
Subclass - Values for specified hierarchy will be shown.
Supplier Site - Items associated to specified values will be shown.
Store - Determines which store locations data is included in the report values.
Brand - Items associated to the specified brands will be shown.
Tiles
There are four tiles shown at the top of the report, showing total sales value, top ten share (sales), total margin value and top ten share (margin) according to criteria selected.
| Display | Description |
|---|---|
| Total Sales | Total VAT exclusive retail value of gross sales for all items in primary currency.
|
| Top Ten Share (Sales) | Share of the top ten items' sales as it relates to total sales of all items in the period.
|
| Total Margin | Total margin value for all items in primary currency
|
| Top Ten Share (Margin) | Share of top ten items' margin as it relates to total margin of all items in the period.
|
Toggles
Today/Week to Date - Allows you to switch the view between sales that have occurred today and those that have occurred this week to current.
Sales/Margin - Allows you to toggle between seeing the items that are top ten sellers in terms of sales revenue and in terms of margin.
Bar Chart
The bar chart has two bars showing sales (blue) and margin (green) for the respective items. Each pair of bars represents an item which is top ten item either by sales or margin and shows the sales and margin either for today or week to date based on selected toggles and dashboard filter criteria.
On the x-axis of the bar chart, the items are listed. For each item, the item description is shown, followed by the item number. The sales/margin bar is able to be selected, which refreshes the associated report showing item details. The items are shown in the order of sales (highest to lowest) when item by sales are displayed and in the order of margin (highest to lowest) when item by margin are displayed.
On the y-axis, the value of sales and margin is shown in the retailer's primary currency.
| Display | Description |
|---|---|
| Item Sales | Retail value of sales for the item in primary currency
|
| Item Margin | Margin value for the item in primary currency
|
For both sales and margin, if the item is displayed is a parent/diff aggregate, then the data will be displayed based on the aggregated diffs. For example, for an item with two diffs - color and size - if color is chosen as the aggregate, all the sales and margin information would be displayed by parent item/color.
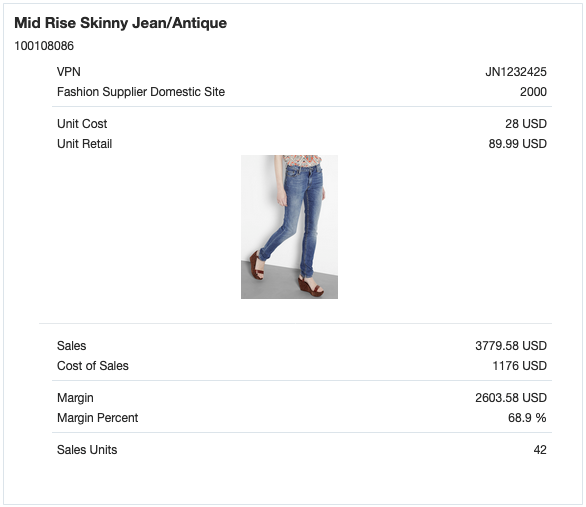
Item Details
The section of the report to the right of the bar graph represents details about a particular item in the chart that has been selected. It is updated by clicking on the bars for a particular item in the chart.
| Display | Description |
|---|---|
| Item Description and ID | In case of transaction level items, the description and item number is displayed at the top of the report. If the clicked-on item is parent/diff aggregate, it shows the parent item number and the diff description. |
| VPN | Shows the VPN associated with the supplier site shown in the report. In the case of parent/diff aggregate, it shows the VPN of the parent item. |
| Supplier Site | Shows the supplier site associated with the item. If a single supplier is indicated in the filter criteria for the dashboard, then that supplier site is shown. Otherwise, the primary supplier site is displayed. In case of parent/diff aggregate, it shows the primary supplier site of the parent item. |
| Unit Cost | Shows the unit cost of the item in the standard unit of measure (UOM) and primary currency for the supplier site shown in the report and primary origin country. If a single origin country was entered in the filter, then that origin country's cost is used for the item/supplier site. In the case of parent/diff aggregate, it shows the average unit cost of all transaction items for the parent/diff combination. |
| Unit Retail | Shows the unit retail in the base zone for the item in standard UOM and primary currency. In case of parent/diff aggregate, it shows the average unit retail for all transaction items for the parent/diff. |
| Sales | Shows the total VAT exclusive retail value of sales (in primary currency) for the item. The value displayed will be based on the report toggles - either Today or Week to Date
|
| Cost of Sales | Shows total cost value of sales (in primary currency).
|
| Margin | Margin value for the item in primary currency.
|
| Margin Percent |
|
| Sales Units | Shows number of units sold for item in standard UOM.
|
| Primary Item Image | Shows the primary image associated with the item. For items shown in aggregate (such as style/color), the image for one of the transaction level items for the item parent/diff combination is used. If any image of the applicable child item is not available, then the image associated with parent item is used. |
For sales and margin calculations in this report, if the item parent/diff aggregate, then the data will be displayed based on the aggregated diffs. For example, for an item with two diffs - color and size - if color is chosen as the aggregate, the sales and margin information would be displayed by parent item/color.
Report Actions
No actions are available from this report.
Configurations
There are no report option configurations associated with this report.
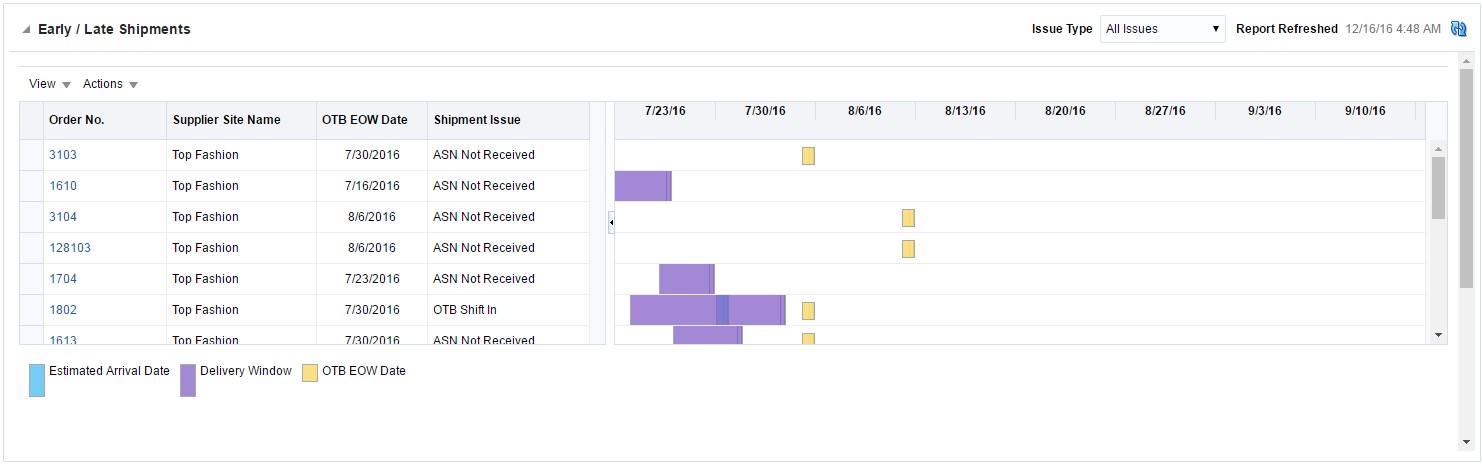
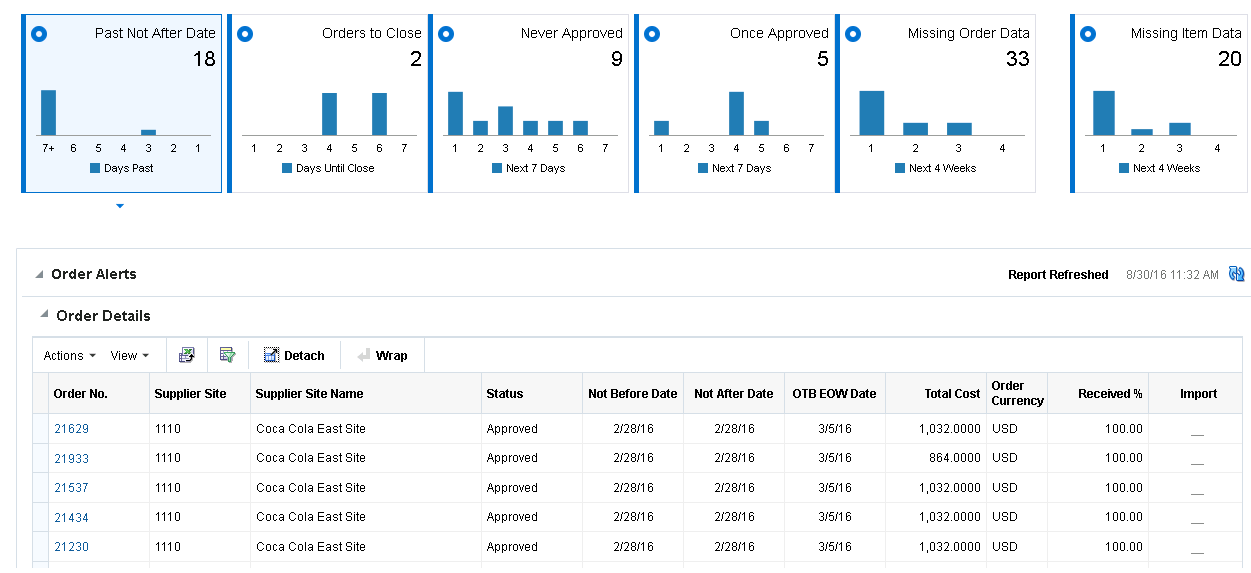
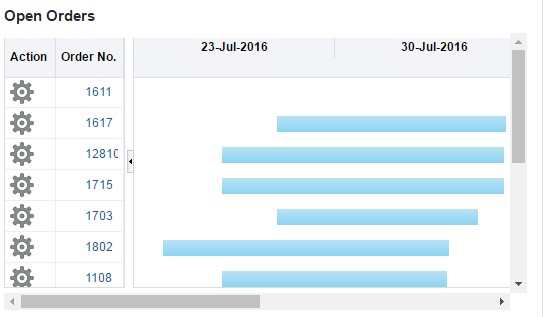
This report shows orders where the delivery window (as defined by the not before and not after dates on the order) is in the next 8 weeks and has potential issues, such as an ASN not being received when expected or an ASN that indicates a shipment will arrive outside the delivery window. The data is shown in both tabular and Gantt chart formats.
This report-level filter allows buyer to filter the table to show only certain issues. The default is All Issues. Other options are:
| Issue Type | Description |
|---|---|
| OTB Shift In | Shows only orders where the OTB EOW date may be able to be shifted to an earlier date based on the estimated arrival date from an ASN. |
| OTB Shift Out | Shows only orders where the OTB EOW date may be able to be shifted to a later date based on the estimated arrival date from an ASN. |
| Early Shipment | Shows only orders with an ASN containing an estimated arrival date earlier than the not before date of the order. |
| Late Shipment | Shows only orders with an ASN containing an estimated arrival date later than the not after date of the order. |
| ASN Not Received | Shows only orders where an ASN has not yet been received and, based on the supplier's lead times, an ASN should have been received in order to receive the order on time. |
With the help of this report, the buyer can make a pre-emptive and informed decision to update the Not After Date, Not Before Date, and OTB EOW dates for the order. The report also enables a buyer to cancel, view, or edit orders, depending on their privileges.
The following dashboard filters are used by this report. For each, it is possible for multiple values to be selected, in which case it will be considered an "and" condition for this report.
Department (mandatory filter) - Orders containing an item in the specified hierarchy will be shown.
Class - Orders containing an item in the specified hierarchy will be shown.
Subclass - Orders containing an item in the specified hierarchy will be shown.
Supplier Site - Orders containing an item associated to specified values will be shown.
Store - Orders containing the stores or orders to a warehouse with linked to allocations containing the stores.
Order Context - Orders containing the specified values will be shown.
Brand - Orders containing items associated to the specified brands will be shown.
Country of Origin - Orders containing items originating in the specified countries will be shown.
Table
| Metric | Description |
|---|---|
| Order Number | Indicates the order number of an order with an issue that has a delivery window in the next 8 weeks. |
| Supplier Site Name | Indicates the name of the supplier site for the order. |
| Not Before Date | This shows the Not Before Date of the order. |
| Not After Date | This shows the Not After Date of the order. |
| Estimated Arrival Date | Indicates the estimated arrival date of the order based on a received ASN. If there is more than one ASN for an order, the non-received ASN with the earliest Estimated Arrival Date is considered. |
| Open to Buy Date | Indicates the OTB EOW date on the purchase order. |
| Shipment Issue | This column shows the type of issue associated with the order that caused it to be displayed in the report. |
Gantt Chart
The Gantt chart plots the data from the table based on a calendar to show the expected delivery window of the order based on the Not Before and Not After date, along with Estimated Arrival and OTB EOW dates.
Report Actions
Edit Order - Clicking on an order number or selecting Edit Order option from the Actions menu in the table launches Purchase Order screen in Merchandising in edit or view mode, based on user's security privileges.
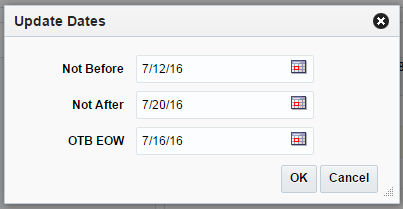
Update Dates - This option opens a popup where dates for one or more selected orders can be updated.
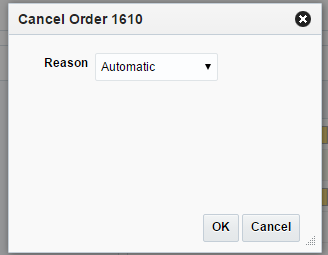
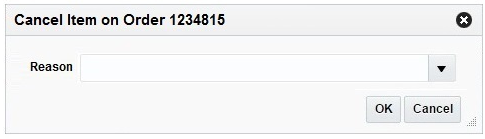
Cancel Order - With this option the user can choose to cancel one or more selected orders from the report itself by specifying the cancellation reason in the popup.
Configurations
The following values related to this report can be configured in the Report Options screen in Merchandising:
Beginning of Week to Estimated Arrival Date - Number of days between the beginning of week and estimated arrival date to determine if the order qualifies as an issue.
Not After Date to End of Week - Number of days between the end of week and the not after date to determine if the order qualifies as an issue.
Estimated Arrival Date to Open to Buy Date - Number of days between the estimated arrival date and the OTB date to determine if the order qualifies as an issue.
Display OTB - Whether to display OTB related issues for the report, which may differ from the overall system setting for the OTB budgets.
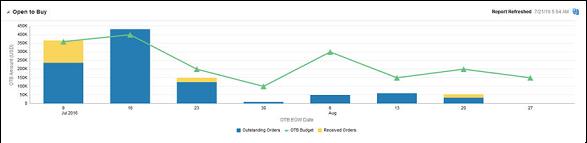
This report summarizes the open to buy position for a particular department, class, or subclass over the next 8 weeks. It is intended to give a buyer visibility to where they are over and under bought for their area, and will work in conjunction with the Early/Late Shipments report to help a buyer understand how late or early shipments may impact their OTB. The bars in the chart give visibility to the value of orders for the department, class, subclass, and date that have been received and approved. The line in the Gantt chart represents the budget.
The Buyer can navigate to Order Search window by clicking on the bars in the chart to view the Orders for the selected Open to Buy End Of Week Date.
The following dashboard filters are used by this report. For each, it is possible for multiple values to be selected, in which case it will be considered an "and" condition for this report.
Department (mandatory filter) - OTB values for specified hierarchy will be shown.
Class - OTB values for specified hierarchy will be shown.
Subclass - OTB values for specified hierarchy will be shown.
The report is a combination of bar chart and line graph. The bars in the chart give visibility to the value of orders for the selected hierarchy and date that have been received and approved. The line in the chart represents the budget. The x-axis displays the end of week dates and the y-axis displays the amount in the primary currency.
| Metric | Description |
|---|---|
| OTB Budget | Indicates the OTB budget summarized across all order types for the selected departments, classes, and/or subclasses for the week shown in the report from the OTB table in Merchandising. |
| Outstanding Orders | Displays the total amount (in terms of cost or retail, depending on the department) of non-received quantity on approved orders that have an OTB EOW date equal to the date in the chart. It is calculated as (approved - received) from the OTB table in Merchandising summarized across all order types. |
| Received Orders | Displays the total amount (in terms of cost or retail, depending on the department) of received quantity on approved orders that have an OTB EOW date equal to the date in the chart. |
Clicking on a bar in the chart launches the user into the Order Search screen, passing the department, class, subclass, and end of week date from the report. The Order Search opens with the search auto-executed based on these parameters, using the end of week date as the OTB EOW date.
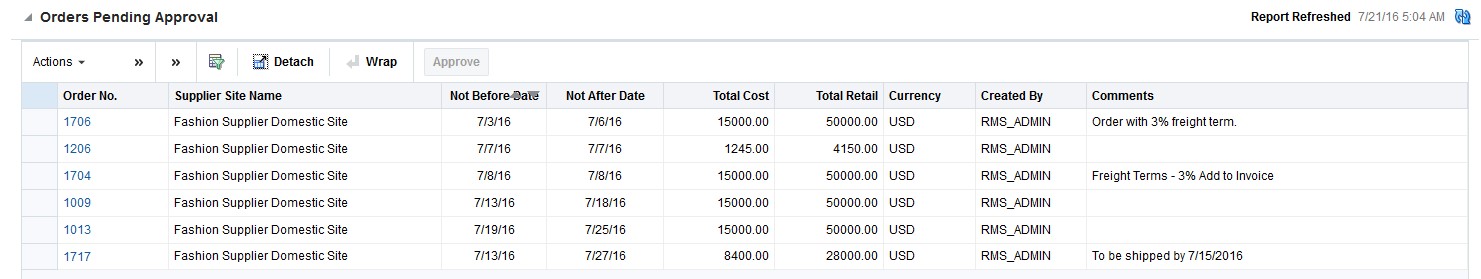
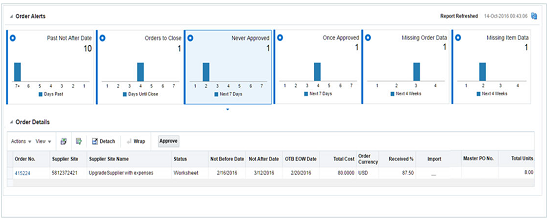
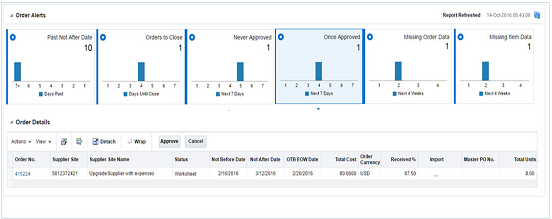
This report shows the orders that need to be reviewed by the buyer for approval or rejection. The orders shown in the table are limited to those that the buyer is able to approve based on the total cost or retail value of the orderFoot 1 . A buyer can approve or reject one or more orders from the dashboard or launch in-context to see the order details.
The following dashboard filters are used by this report. For each, it is possible for multiple values to be selected, in which case it will be considered an "and" condition for this report.
Department (mandatory filter) - Orders containing an item in the specified hierarchy will be shown.
Class - Orders containing an item in the specified hierarchy will be shown.
Subclass - Orders containing an item in the specified hierarchy will be shown.
Supplier Site - Orders containing an item associated to specified values will be shown.
Store - Orders containing the stores or orders to a warehouse with linked to allocations containing the stores.
Order Context - Orders containing the specified values will be shown.
Brand - Orders containing items associated to the specified brands will be shown.
Origin Country - Orders containing items originated in the specified countries will be shown.
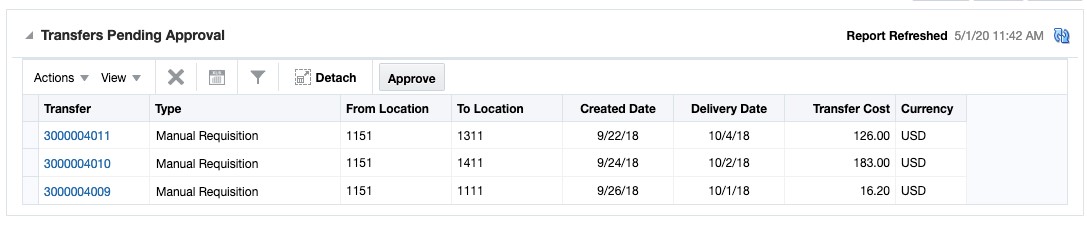
The report shows a table with a list of orders and their details.
| Metric | Description |
|---|---|
| Order Number | Indicates the order number of an order that has been submitted for approval and meets the filter criteria entered. |
| Supplier Site Name | The name of the supplier site for the order. |
| Not Before Date | The not before date for the order. |
| Not After Date | The not after date for the order. |
| Total Cost | The total cost of the order in the order currency. |
| Total Retail | The total retail value of the order in the order currency. |
| Currency | Shows the order currency. |
| Created By | Shows the user ID of the user who created the order. |
| Comments | Shows the comments associated with the order, if any. |
| OTB EOW Date | The OTB EOW date for the order. |
| Metric | Description |
|---|---|
| Approve | Clicking on the Approve button or selecting the Approve action from the Actions menu approves the selected order. Buyers can also select multiple orders to approve. Buyers must have the Approve Purchase Orders privilege in order to approve orders from this report. |
| Worksheet | Selecting the Worksheet action from the Actions menu rejects the order. Buyers can also select multiple orders to reject back to worksheet status. When a single order is selected, then this action opens the Reject Order popup, which allows the buyer to enter comments about why the order is being rejected. |
| Edit Order | Clicking on an order number in the table or selecting the Edit Order option from the Actions menu launches the user into the purchase order in edit or view mode depending on their privileges. |
| Order Details | This action launches the Order Details screen for the selected order directly, rather than having to drill through from the Order Header. The screen opens in edit or view mode depending on their privileges. |
This dashboard is intended to be used by a data steward, who is responsible to maintain data standards, accuracy and maintenance of foundation and item data.
This dashboard has following filters:
Basic
Department*
Class
Subclass
Supplier Site
Country of Sourcing
Created Date
Advanced
Location
Brand
Item Type
Item Level
Transaction Level
UDA/Value
Season
|
Note:
|
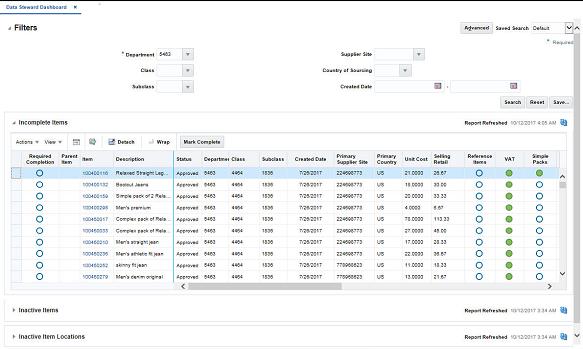
To view the data steward dashboard, from the task bar select Reports > Data Steward Dashboard. The Data Steward Dashboard page appears.
The purpose of Incomplete Items report is to introduce work flow into the item creation process by providing visibility to what item-related data has been set up for new items and what still requires setup. This report displays all items that satisfy the specified filter criteria, were created a certain number of days in the past, and have one or more required item attributes that is not yet completed.
The following dashboard filters are used by this report. For most, it is possible for multiple values to be selected, in which case it will be considered an "and" condition for this report.
Department (mandatory filter) - Items in the specified departments will be shown.
Class - Items in the specified classes will be shown.
Subclass - Items in the specified subclasses will be shown.
Supplier Site - Items associated to specified supplier sites will be shown.
Country of Sourcing -Items sourced from the specified countries will be shown.
Created Date - Items within the specified created date range will be shown.
Location - Items ranged to specified locations will be shown.
Item Type - Specified item types (e.g. regular item, simple pack, etc.) will be shown.
Item Level - Specified item levels (Level 1, Level 2, Level 3) will be shown.
Transaction Level - Items with the specified transaction levels will be shown.
UDA/Value - Items associated with specified UDAs will be shown.
Brand - Items associated to the specified brands will be shown.
Season - Items associated to the specified seasons will be shown.
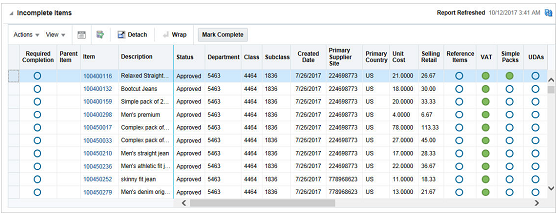
The report shows the list of items in a table with various columns showing item attributes and their state of completion. Additionally, for each item, a Harvey ball shows the overall completion status both for the item, as well as by attribute. For transaction level items all attributes are either complete or not, depending on whether data has been entered for the item.
For parent items, completion is based on its child items, such that for each attribute, if complete for all children, 100% is shown; when it is complete for some child items, 50% is shown; when it is not complete for any child items, 0% is shown.
Although there are not any report level filters, the data steward can further filter the data in the table using the Query by Example feature on the table.
| Metric | Description |
|---|---|
| Required Completion | Indicates the level of completeness for the item. For both the transaction and above transaction item level it is calculated as the sum of required attribute completion percentages / count of all required attributes * 100.
If the value is calculated as less than 25%, this will show an empty Harvey ball. If it is greater than or equal to 25% but less than 50%, then the it will show a 25% Harvey ball. If it is greater than or equal to 50%, but less than 75%, it will show a 50% Harvey ball. If it is greater than 75%, but less than 100%, it will show a 75% Harvey ball. |
| Parent Item | Parent item ID of the item shown or a parent item that is deemed incomplete. |
| Item | ID of the item that is considered incomplete. If this is blank, then the row corresponds with a parent item. |
| Description | Shows the description of the item. |
| Status | Shows the status of the item - worksheet, submitted, and approved. |
| Department | Indicates the ID of the department, which the item in the report belongs to. |
| Department Name | Indicates the name of the department which the item in the report belongs to. |
| Class | Indicates the ID of the class to which the item in the report belongs. |
| Class Name | Indicates the name of the class to which the item in the report belongs. |
| Subclass | Indicates the ID of the subclass to which the item in the report belongs. |
| Subclass Name | Indicates the name of the subclass to which the item in the report belongs. |
| Created Date | Indicates the date on which the item in the report was created. |
| Create By | Indicates the ID of the user who created the item in the report. |
| Primary Supplier Site | Indicates the ID of the primary supplier site to which the item in the report belongs. |
| Primary Supplier Site Name | Indicates the name of the primary supplier site to which the item in the report belongs. |
| Primary Country | Indicates the primary country associated with the item in the report. |
| Unit Cost | Indicates the unit cost of the item for its primary supplier/country. |
| Selling Retail | Indicates the average selling retail of the item for locations in the base zone. |
| Supplier Currency | Indicates the supplier currency associated with the primary supplier site of the item or the supplier site selected in the dashboard filter in the report. |
| VPN | Indicates the VPN associated with the primary supplier site of the item or the supplier site selected in the dashboard filter in the report. |
| Pack | Indicates whether or not the item is a pack. |
The completion for the following attributes can be tracked in this report:
| Attribute | Description |
|---|---|
| Reference Items | Indicates whether items below transaction level (such as barcodes) have been created for the item. |
| VAT | Indicates if VAT has been set up for the item. |
| Simple Packs | Indicates whether any simple packs are set up for the item. |
| UDAs | Indicates whether UDAs have been set up for the itemFoot 1 . |
| Locations | Indicates whether the item has been ranged to any location. |
| Seasons/Phases | Indicates if any season or phase has been defined for the item. |
| Replenishment | Indicates if the item has been set up on replenishment in at least one location. |
| Substitute Items | Indicates if any substitutes for purposes of replenishment have been set up for the item. |
| Dimensions | Indicates if the item has had dimensions defined for any supplier/country of origin combination. |
| Related Items | Indicates if any related items have been defined for the item. Related items can be defined as up-sell, cross-sell, or substitutes. |
| Tickets | Indicates if any ticketing attributes have been defined for the item. |
| HTS | For import items, indicates if the item has had Harmonized Tariff Schedules (HTS) set and approved. |
| Import Attributes | For import items, indicates if the item has had import attributes, such as the longer item description, tooling costs, or amortization basis defined. |
| Image | Indicates if at least one image has been designated for the item. |
Footnote 1 This indicator does not reflect whether required UDAs for the item have been added, only whether any UDAs have been added.
Clicking the Harvey ball icon showing the completion level of the attribute, contextually launches into the respective screen as specified below. The screens open in either edit or view mode, depending on user's privileges.
| Attribute | Contextual launch to |
|---|---|
| Dimensions | Item Supplier Country |
| HTS | Item HTS |
| Images | Item Images |
| Import Attributes | Item Import Attributes |
| Locations | Item Locations |
| Reference Items | Item Children or Item Children by Diff |
| Related Items | Related Items |
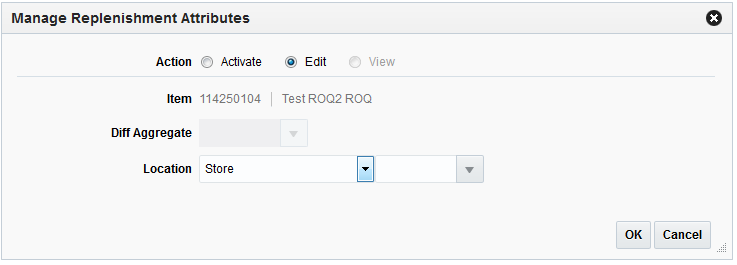
| Replenishment | Manage Replenishment Attributes |
| Seasons/Phases | Item Seasons |
| Simple Pack | Simple Pack Setup |
| Substitute Items | Substitute Items |
| Tickets | Item Tickets |
| UDAs | Item UDAs |
| VAT | VAT Item |
Users can also click on the item or item parent hyperlink to open the Item screen for access to all item attributes.
Clicking on the Mark Complete button allows users to select one or multiple items to be removed from the report when they no longer need to be tracked. For example, if a department contained a mix of import and domestic goods, the HTS attributes might be defined as required, but for those items where they don't apply, once all other attributes for the item that are required have been defined, the item can be marked complete to remove from the report. Users must have the Maintain Items privilege to be able to select this option.
The following values related to this report can be configured in the Report Options screen in Merchandising. Also, for each of the system level configurations for this report, department level exception can be specified.
Past Item Creation - Number of days post creation of items after which the item appears in this report.
Item Attributes - all the item attributes can be defined as required, optional, or not applicable. It is recommended that the superset of attributes to be used across all departments is set as either required or optional at the system level and then exceptions at the department level are used to drive the completion calculation.
|
Note: The columns that are not applicable can also be hidden by each data steward, so that only the critical columns are displayed. This can be done by selecting options in the View menu for the table. |
This report is intended to provide visibility to items that may be candidate for deletion due to inactivity. Items are displayed in this report based on their creation occurring more than a configurable number of days ago and also meeting all of the following:
Have not already been flagged for delete or were flagged for delete but have errors preventing it from being deleted
Have no stock on hand at any location
Do not exist on any order or allocation
Have not had any receipts or sales for a configurable number of days
The report also provides visibility to item/locations that were previously flagged for delete, but could not be deleted due to a conflict. Items in worksheet, submitted, or approved status can appear in this report. The report can also contain parent items, if all the transaction level items for the parent meet these criteria.
Department (mandatory filter) - Items in the specified departments will be shown.
Class - Items in the specified classes will be shown.
Subclass - Items in the specified subclasses will be shown.
Supplier Site - Items associated to specified supplier sites will be shown.
Country of Sourcing - Items sourced from the specified countries will be shown.
Created Date - Items with the specified created dates will be shown.
Location - Items ranged to specified locations will be shown.
Item Type - Specified item types will be shown.
Item Level - Specified item levels will be shown.
Transaction Level - Items with the specified transaction levels will be shown.
UDA/Value - Items associated with specified UDAs will be shown.
Brand - Items associated to the specified brands will be shown.
Season - Items associated to the specified seasons will be shown.
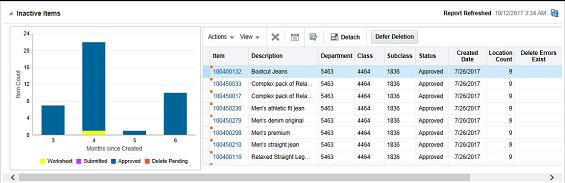
The report is comprised of a stacked bar chart and a linked table that displays the items that meet the dashboard query criteria and conditions mentioned in previous section.
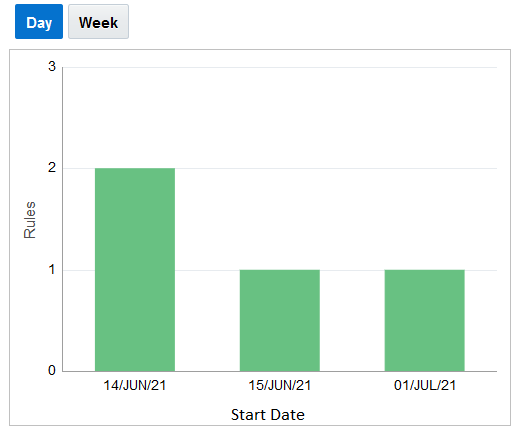
The stacked chart depicts the count of inactive items by relative aging, stacked by item status. The vertical axis represents the item count and the horizontal axis represents the number of months since which the items were created. Then, the previous four months are shown, with the final bar being anything six months older or more than this configuration.
Clicking on the bar or any of the segments on the bar filters the table based on the selection. The table by default shows the details of all inactive items based on the user query.
The following details are present in the table:
| Attribute | Description |
|---|---|
| Item | Displays the item ID of the item, which is a hyperlink to access the Item screen in edit or view mode based on user privilege. |
| Item Description | Displays the description of the item. |
| Department | Displays the ID of the department which the item belongs to. |
| Class | Displays the ID of the class which the item belongs to. |
| Subclass | Displays the ID of the subclass which the item belongs to. |
| Status | Display the current item status. |
| Created Date | Displays the date on which the item was created. |
| Location Count | Displays the count of the locations the item is ranged to. |
| Last Updated Date | Displays the date when the item was last updated. |
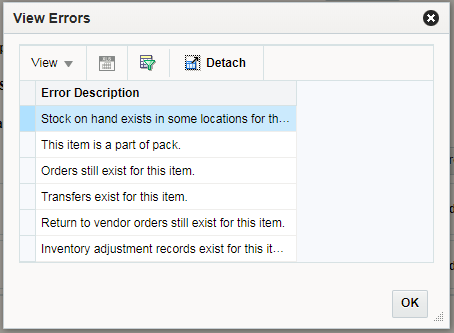
| Delete Errors Exist | If an item was previously attempted to be deleted, but could not be, then a conflict icon will be displayed here. Clicking on the icon will open up the View Errors pop up, displaying the errors that are associated with the itemFoot 1 . |
| Brand | Displays the brand name associated with the item. |
| Season | Displays the item season. |
| Parent Item | Displays the parent item ID of the inactive item; if applicable. |
| Parent Item Description | Displays the description of the parent item. |
Footnote 1 These are the same errors that are shown in the Daily Purge Error report.
Following actions can be taken from the report:
Delete
The data steward can select one or more items to be deleted with this action. This will change the status of the item to Delete Pending. If the item has any transaction level child items associated, they can also optionally be marked for deletion. Once marked delete, the item will be removed from the report and not re-picked for display in the report unless the delete process encounters errors.
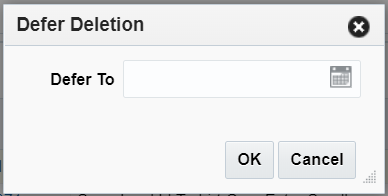
Defer Deletion
Clicking on the Defer Deletion action button or selecting Defer Deletion from the Actions menu will hide the selected item from the report view until a designated date. Clicking this option will display a popup that allows the data steward to enter the date for the deferral. This option may be used if there is any blocking issue for delete that will take time to resolve, and the data steward doesn't have to continue to review it each day. Once the deferral date is reached, the item will appear again in the report, if it hasn't yet been successfully deleted.
Edit/View Items
Clicking on Item ID or selecting Edit Item or View Item option from the Actions menu in the table will open the Item screen in Edit or View mode, based on user's privilege.
View Errors
Clicking the conflict icon in the Delete Errors Exist column, or selecting View Errors in the Actions menu, opens the View Errors popup displaying errors encountered when previously attempting to delete the item.
The following values related to this report can be configured in the Report Options screen in Merchandising. Also, for each of the configurations defined for this report, exceptions to the system-defined value can also be defined by department.
Display Items Created Days Ago - Number of days post creation of item, after which the item appears in this report.
Display Items Last Transacted Days Ago - Number of days post last receipt or sale at any location, after which the item appears in this report.
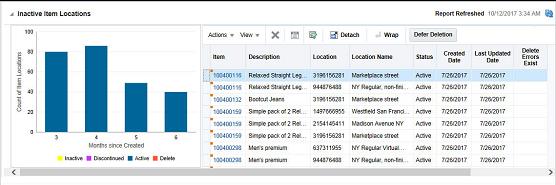
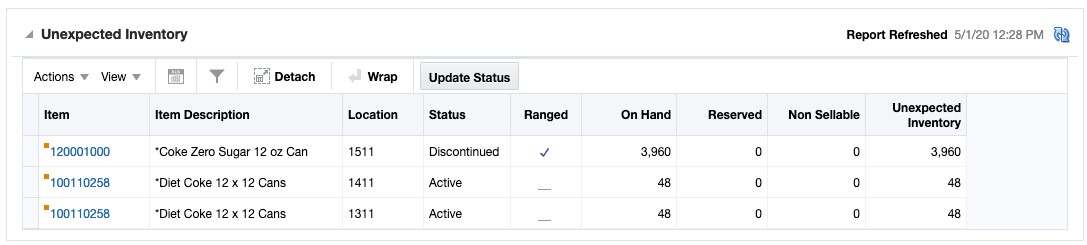
This report is intended to provide visibility to item location combinations that may be candidate for deletion due to inactivity. Item/locations are displayed in this report based on their creation occurring more than a configurable number of days ago and also meeting all of the following:
Have not already been flagged for delete or were flagged for delete but have errors preventing it from being deleted
Have no stock on hand
Do not exist on any order or allocation
Have not had any receipts or sales for a configurable number of days
Items in worksheet, submitted, or approved status can appear in this report. The report can also contain parent items, if all the transaction level items for the parent meet these criteria.
Department (mandatory filter) - Items in the specified departments will be shown.
Class - Items in the specified classes will be shown.
Subclass - Items in the specified subclasses will be shown.
Supplier Site - Items associated to specified supplier sites will be shown.
Country of Sourcing - Items sourced from the specified countries will be shown.
Created Date - Items with the specified created dates will be shown.
Location - Items ranged to specified locations will be shown.
Item Type - Specified item types will be shown.
Item Level - Specified item levels will be shown.
Transaction Level - Items with the specified transaction levels will be shown.
UDA/Value - Items associated with specified UDAs will be shown.
Brand - Items associated to the specified brands will be shown.
Season - Items associated to the specified seasons will be shown.
The report is comprised of a stacked bar chart and a linked table that displays the item/locations that meet the dashboard query criteria and conditions mentioned in previous section.
The stacked chart depicts the count of inactive item/locations by relative aging, stacked by item/location status. The vertical axis represents the item/location count and the horizontal axis represents the number of months since which the items were created. Then, the previous four months are shown, with the final bar being anything six months older or more than this configuration.
Clicking on the bar or any of the segments on the bar filters the table based on the selection. The table by default shows the details of all inactive item/locations based on the user query.
The following details are present in the table:
| Attribute | Description |
|---|---|
| Item | Displays the item ID of the item, which is a hyperlink to access the Item screen in edit or view mode based on user privilege. |
| Item Description | Displays the description of the item. |
| Location | Displays the location ID. |
| Location Name | Displays the location name. |
| Status | Display the item/location status. |
| Created Date | Displays the date on which the item/location was created. |
| Last Updated Date | Displays the date when the item/location was last updated. |
| Delete Errors Exist | If an item/location was previously attempted to be deleted, but could not be, then a conflict icon will be displayed here. Clicking on the icon will open up the View Errors pop up, displaying the errors that are associated with the item/locationFoot 1 . |
| Parent Item | Displays the parent item ID of the item, if applicable. |
| Parent Item Description | Displays the description of the parent item. |
| Brand | Displays the brand name associated with the item. |
| Season | Displays the item season. |
| Department | Displays the ID of the department which the item belongs to. |
| Class | Displays the ID of the class which the item belongs to. |
| Subclass | Displays the ID of the subclass which the item belongs to. |
Footnote 1 These are the same errors that are shown in the Daily Purge Error report.
The following actions can be taken from the report:
Update Status
The data steward can select one or more item/location combinations and update their status with this action, including Active, Discontinued, Inactive, and Delete. Clicking on this option will display a popup where the data steward can select the status to which they wish to update the selected item/location combinations. Clicking OK will save the changes and apply the updates.
Defer Deletion
Clicking on Defer Deletion action button or selecting Defer Deletion from the Actions menu will hide the selected item/locations from the report view until a designated date. Clicking this option will display a popup that allows the data steward to enter the duration of the deferral. This option may be used if there is any blocking issue for delete that will take time to resolve, and the data steward doesn't have to continue to review it each day. Once the deferral date is reached, the item/location will appear again in the report, if it hasn't yet been successfully deleted.
Edit/View Items
Clicking on Item ID or selecting view option from the Actions menu in the table will opens Item screen in edit or view mode based on user's privileges.
View Errors
Clicking the conflict icon in the Delete Errors Exist column opens the View Errors screen displaying errors encountered when previously attempting to delete the item/location. This option is only available for item/locations with the status Deleted, for which delete errors exist.
The following values related to this report can be configured in the Report Options screen in Merchandising. Also, for each of the configurations defined for this report, exceptions to the system-defined value can also be defined by department.
Display Items Created Days Ago - Number of days post creation of item/location after which the item/location appears in this report and considered for purge.
Display Items Last Transacted Days Ago - Number of days post last transaction of item/location after which the item/location appears in this report and considered for purge.
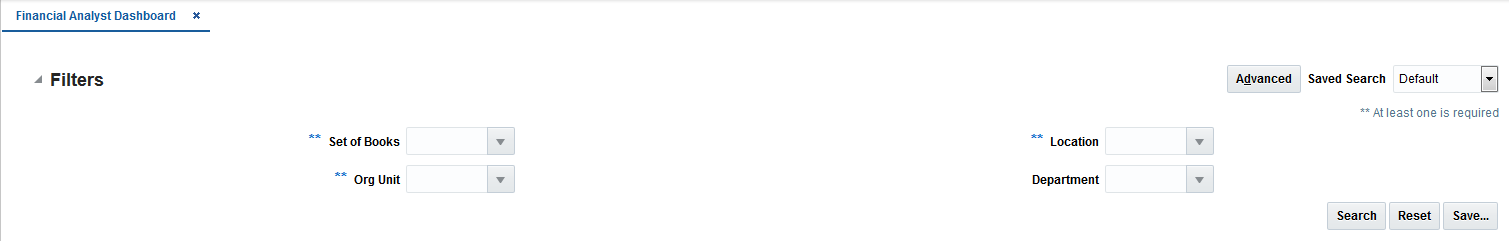
This dashboard is intended to be used by a finance analyst for evaluating inventory valuation and stock ledger accuracy. For every report in this dashboard, there is a headline tile at the top of the dashboard. These tiles provide summary of the information from the respective report and can be rendered in green, yellow or red as an indicator of criticality. These criticality criteria are configurable in Merchandising.
This dashboard has the following filters:
Basic
Set of Books**
Org Unit**
Location**
Department
Advanced
Class
Subclass
|
Note:
|
To view the financial analyst dashboard, from the task bar select Reports > Financial Analyst Dashboard. The Financial Analyst Dashboard page appears.
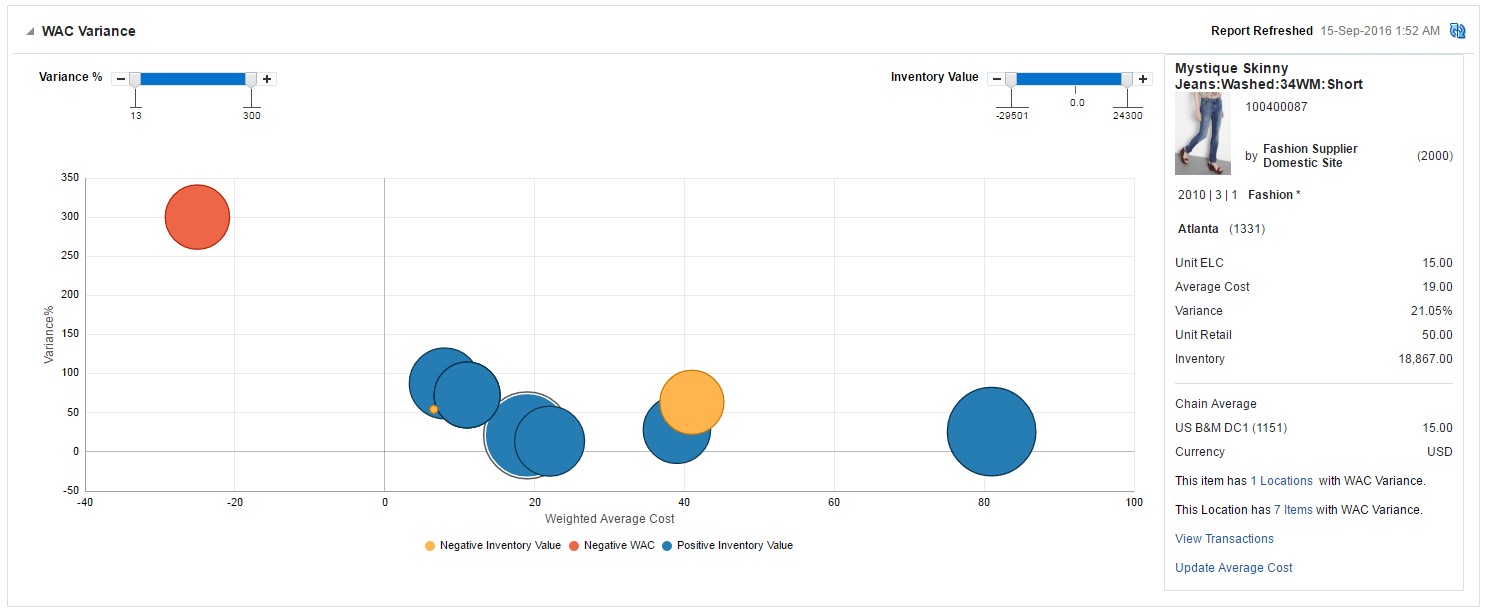
This report displays item/locations having a variance between the unit cost and weighted average cost (WAC) that falls outside of a defined tolerance. Each item/location fulfilling the filter criteria and tolerance is represented as a bubble in the chart. The size of the bubble is relative to the absolute value of inventory at the location and the color represents whether the variance is positive, negative, or it is a case of negative WAC. From the report users can launch the Stock Ledger and Average Cost Adjustment screen to view transactions to further inquire about the potential transactions causing WAC variance and to correct average cost if they wish respectively.
All dashboard-level filters are applicable to the report and item locations shown in the report will be associated with the filter criteria specified.
This report has three components - a tile, shown at the top of the dashboard; a bubble chart to show the item/location with a variance issue, and a display pane, which shows the details for the item/locations selected in the bubble chart.
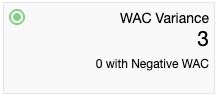
Tile
The tile report shows the count item/location combinations in the report, based on any filter setting for the dashboard and report configurations. It also shows the count of item/locations with negative WAC, if applicable.
The color of the tile changes colors to reflect the severity of the variances in terms of amount and quantity. The rules for this are defined in the table below.
| Tile Color | Rule |
|---|---|
| Green | All item/locations in the report have a WAC variance less than the system report Max Variance % and the count of item/locations in the report is less than the Variance Count and no item/location has a negative WAC. |
| Yellow | At least one item/location in the report has a WAC variance greater than or equal to the Max Variance % or the number of item/locations in the report is greater than or equal to the Variance Count and
No item has a negative WAC. |
| Red | At least one item/location has a negative WAC or
At least one item/location has a WAC variance greater than or equal to the Max Variance % and the number of item/locations in the report is greater than or equal to the Variance Count. |
Bubble Chart
Each bubble represents an item/location combination with a WAC to unit cost variance greater than or equal to the Value Tolerance Percent report system option. The x-axis of the chart shows average cost and y-axis is the variance %. The size of the bubble is relative to the absolute inventory value of the item at the location (owned inventory * WAC). In the case of a negative inventory value, the bubble color is orange, otherwise blue. The color of the bubble is red for item/locations with negative WAC. All monetary values shown in the chart are in primary currency.
There are two report level filters that can be used to further limit the information shown in the bubble chart. The Variance % slider shows the maximum and minimum variance percent present in the chart as extremes. By moving the slider, the finance analyst can narrow this range. The Inventory Value slider, similarly allows the finance analyst the ability to narrow the range of data shown in the bubble chart based on inventory valuation.
Clicking the bubble shows the details about the item/location in the display pane on the right.
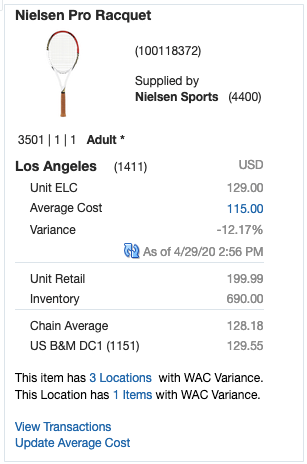
Item Location Details
This section of the report, shown to the right of the bubble chart, represents details about the particular item location in the chart which is selected by the finance analyst. When the report loads, by default it shows the details of item/location with highest inventory value, however, if negative values exist then it shows the item/location with highest negative inventory value.
| Display | Description |
|---|---|
| Item Description and Number | Indicates the item description and ID of the item/location selected in the chart. |
| Item Image | Shows the primary image associated with the selected item. |
| Supplier Site Name and ID | Shows the primary supplier site associated with the selected item. |
| Department, Class, Subclass, Subclass Name | Shows the ID of the department, class and subclass to which the item belongs to along with subclass name. |
| Location ID and Name | Shows the ID and name of the selected location with variance. |
| Unit ELC | Shows the pricing cost, from the Future Cost table for the item/location for primary supplier/primary country. In case the location is an external finisher, then it shows the unit cost. |
| Average Cost | Shows the current average cost for the selected item/location. |
| Variance | Shows the variance of average cost to unit ELC. Calculated as (average cost - unit ELC)/average cost * 100. |
| Unit Retail | Shows the current selling unit retail of item/location. |
| Inventory (Value) | Shows the cost value of the inventory at the location. Calculated as (stock on hand + pack comp SOH + in transit + pack comp in transit) * current average cost. |
| Chain Average | Shows a calculated average cost for all stores in the chain of the location in the report. This is intended to show the finance analyst if this particular location is out of tolerance with other locations in the chain to help in understanding the scope of the variance. |
| Sourcing Warehouse and average cost | Shows the name and ID of the sourcing warehouse attached with the item/location and its average cost. If sourcing warehouse is not set then the default warehouse of the store or warehouse is considered. This is included to help the finance analyst better understand if the variance perhaps was a result of incoming stock orders into the location from its sourcing warehouse. |
| Location Count | The report notes how many other locations for this item also have a WAC variance. This is shown in text at the bottom of the report as, "This item has x Locations with WAC Variance." The "x Locations" portion is a hyperlink, which is described below in Report Actions. |
| Item Count | The report notes how many other items for this location also have a WAC variance. This is shown in text at the bottom of the report as, "This location has x Items with WAC Variance." The "x Items" portion is a hyperlink, which is described below in Report Actions. |
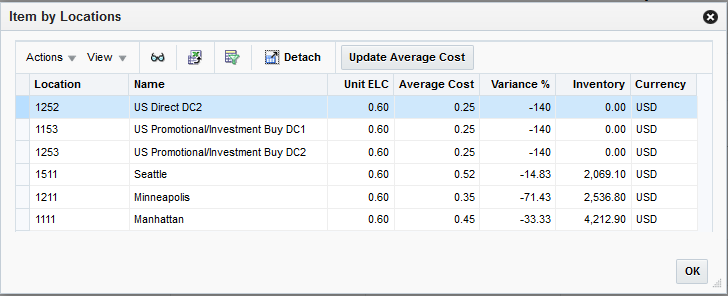
X Locations hyperlink - clicking on the number of locations with WAC variance in the side panel opens the Item by Locations popup, which shows all the locations where that item has a WAC variance outside tolerance or with a negative value, including the location already shown in the display pane. The locations returned in the popup are not affected by report level filters.
In the popup, the finance analyst can take the following actions:
Click on the View iconic button in the table toolbar or select View from the Action menu to open the Transaction Data screen in context for the selected row and see data for the last 7 days, by default.
Click on the Update Average Cost button, which opens the Average Cost Adjustment screen for the item/location highlighted in the table to adjust WAC. This link is not available when the location is an external finisher.
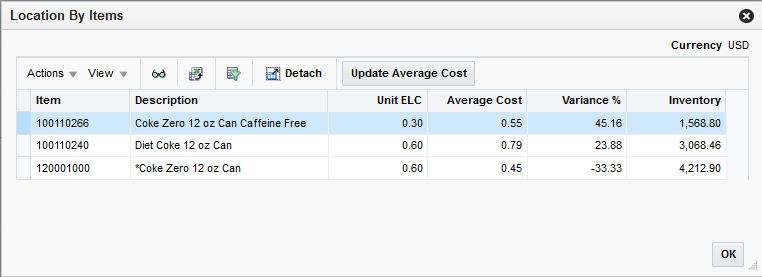
X Items hyperlink - clicking on the number of items with WAC variance in the side panel opens the Location by Items popup, which shows all the items in the location with WAC variance outside tolerance, including the item already shown in the display pane. The items returned in the popup are not affected by report level filters.
In the popup, the finance analyst can take the following actions:
Click on the View iconic button in the table toolbar or select View from the Action menu to open the Transaction Data screen in context for the selected row and see data for the last 7 days, by default.
Click on the Update Average Cost button, which opens the Average Cost Adjustment screen for the item/location to adjust WAC. This link is not available when the location is an external finisher.
View Transactions hyperlink - clicking on this link in the side panel opens the Transaction Data screen in context for the selected item/location, showing data for the last 7 days, by default.
Update Average Cost hyperlink - clicking on this link in the side panel opens the Average Cost Adjustment screen for the item/location to adjust WAC. This link is not available when the location is an external finisher.
The following values related to this report can be configured in the Report Options screen in Merchandising:
Tolerance Percent - Variance between unit and average cost that would result in an item/location combination being displayed in this report.
Variance Count - Count of Item location that impacts the tile color.
Maximum Variance Percent - Maximum variance level to have an impact on tile color.
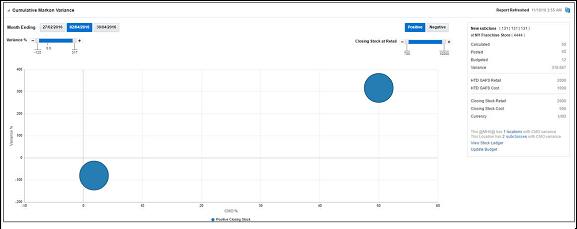
This report shows the subclass/location combinations having a cumulative mark-on variance that falls outside of a user defined tolerance for any one of the last three months. The variance is calculated as the difference between the calculated CMO of the displayed month and the Markup % of Retail for the department. All subclass/locations with negative cumulative mark-on percentages are also shown.
Each subclass/location fulfilling the filter criteria and variance tolerance is represented as a bubble in the chart. The size of the bubble is relative to the closing stock at the retail value of a subclass/location for the displayed month and the color represents whether the value of the closing stock is positive or negative.
From the report the Stock Ledger screen can be contextually launched to analyze the reason for the cumulative mark-on variances and the defined Markup % of Retail value for the department can also be updated.
All dashboard-level filters are applicable to the report and subclass/locations shown in the report will be associated with the filter criteria specified
This report has three components - a tile, which summarizes the number of subclass/locations with variance; a bubble chart to show subclass/locations with a variance issue, and a display pane, which shows the details for the subclass/locations selected in the bubble chart.
Tile
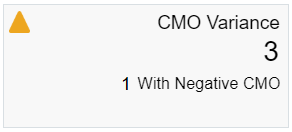
The tile report shows the count of subclass/ location combinations with a calculated CMO variance, based on the filter settings for the dashboard and report configurations. It also shows the count of subclass/locations with negative CMO variance, if applicable.
The color of the tile changes colors to reflect the severity of the variances in terms of amount and quantity. The rules for this are defined in the table below.
| Tile Color | Rule |
|---|---|
| Green | All subclass/locations in the report have a CMO % greater than or equal to the system option Minimum Cumulative Markdown % and
All subclass/locations in the report have a CMO % less than or equal to the system option Maximum Cumulative Markdown % and The number of subclass/locations in the report is less than the Subclass Locations Exceeding Variance Critical Count report option and No subclass/location has negative CMO % |
| Yellow | One or more subclass/locations in the report have a CMO % less than the system option Minimum Cumulative Markdown % or greater than the system option Maximum Cumulative Markdown % or the number of subclass/locations in the report is greater than or equal to the Subclass Locations Exceeding Variance Critical Count report option and
No subclass/location has negative CMO % |
| Red | Any subclass/location has negative CMO% or
One or more subclass/locations in the report have a CMO % less than the system option Minimum Cumulative Markdown % and the number of subclass/locations in the report is greater than or equal to the Subclass Locations Exceeding Variance Critical Count report option or One or more subclass/locations in the report have a CMO % greater than the system option Maximum Cumulative Markdown % and the number of subclass/locations in the report is greater than or equal to the t Subclass Locations Exceeding Variance Critical Count report option |
Bubble Chart
Each bubble represents a subclass/location combination with CMO % variance greater than or equal to the Minimum Variance report system option. CMO variance is calculated as:
((Calculated CMO % - Markup % of Retail for the department) / Markup % of Retail for the department) * 100.
The x-axis of the chart has CMO percentages and y-axis has Variance percentages. The size of the bubble is relative to the absolute retail value of closing stock for a subclass/location for the selected month. In case of positive closing stock, the bubble color is blue; otherwise orange. All monetary values shown in the chart are in primary currency.
There are several different ways to filter the report itself. The Positive and Negative toggles allow the finance analyst to view the variances with a positive CMO % and those with a negative CMO % separately. This will allow the finance analyst to prioritize the more critical issues - usually negative CMO percentages. The finance analyst can also toggle between viewing data for the current month and the two prior months. The Variance % slider shows the maximum and minimum variance percent present in the chart as extremes. By moving the slider, the finance analyst can narrow this range. The Closing Stock at Retail Value slider, similarly allows the finance analyst the ability to narrow the range of data shown in the bubble chart based on inventory valuation.
Clicking on the bubble shows details about the subclass/location in the display pane on the right.
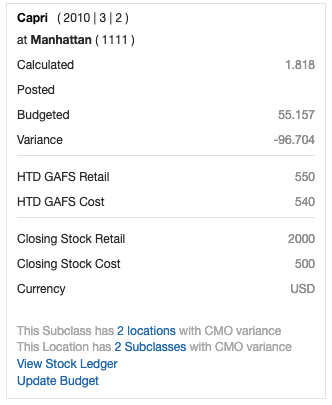
Subclass Location Details
This section of the report to the right of the bar graph represents details about the particular subclass/location in the chart which is clicked by the user. When the report loads, by default it shows the details of subclass/location with highest inventory value, however, if negative values exist then it shows the subclass/location with highest negative inventory value.
| Display | Description |
|---|---|
| Department, Class, Subclass, Subclass Name | Shows the ID of the department, class and subclass to which the item belongs to along with subclass name. |
| Location ID and Name | Shows the ID and Name of the selected location with a variance. |
| Calculated | Shows the calculated cumulative mark-on % value, determined as ((HTD GAFSFoot 1 at Retail - HTD GAFS at Cost)/HTD GAFS at retail) * 100. |
| Posted | Shows the cumulative mark-on % value posted for the month for the subclass/location. |
| Budgeted | Shows the budgeted Markup % of Retail for the department for the month. |
| Variance | Shows the variance between Calculated and Budgeted percentages. |
| HTDS GAFS Retail | Shows half to date goods available for sale value at retail of the displayed month for subclass/location. |
| HTDS GAFS Cost | Shows Half to date goods available for sale value at cost of the displayed month for subclass/location. |
| Closing Stock Retail | Shows closing stock value at retail of the displayed month for subclass/location. |
| Closing Stock Cost | Shows closing stock value at cost of the displayed month for subclass/location. |
| Currency | Shows currency of the location from the side panel. |
| Location Count | The report notes how many other locations for this item also have a CMO variance. This is shown in text at the bottom of the report as, "This item has x Locations with CMO Variance." The "x Locations" portion is a hyperlink, which is described below in Report Actions. |
| Item Count | The report notes how many other items for this location also have a CMO variance. This is shown in text at the bottom of the report as, "This location has x Items with CMO Variance." The "x Items" portion is a hyperlink, which is described below in Report Actions. |
Footnote 1 Half to Date Goods Available for Sale
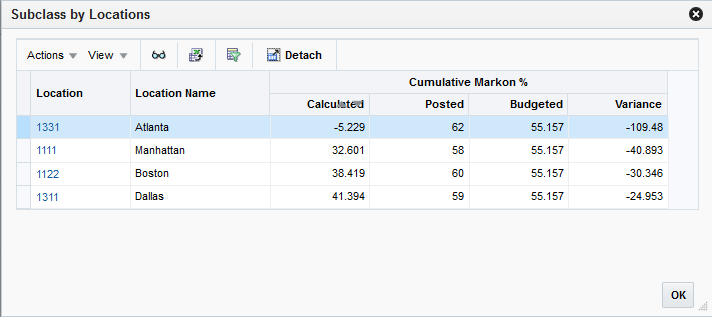
X Locations hyperlink - clicking this link opens the Subclass by Locations popup. This shows all the locations where the subclass has a CMO variance outside tolerance or with a negative value, including the location already shown in the display pane. The locations returned in the popup are not affected by report level filters.
In the popup, the finance analyst can take the following actions:
Click the location hyperlink, the view iconic button in the table toolbar or select View from the Action menu to open the Stock Ledger screen in context for the selected row to research the potential cause for the discrepancy.
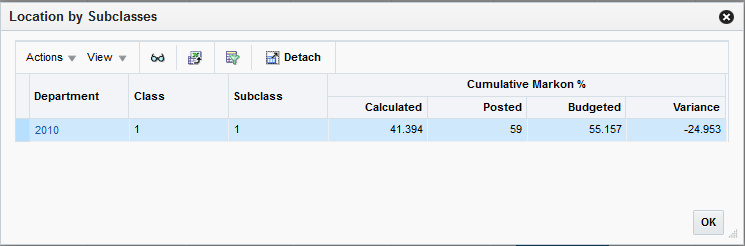
X Subclasses hyperlink - clicking on this link opens the Location by Subclasses popup. This shows all the subclasses in the location with a CMO variance outside tolerance, or with a negative value including the subclass already shown in the display pane. The subclasses returned in the popup are not affected by report level filters.
In the popup, the finance analyst can take the following actions:
Click on the department hyperlink, the view iconic button in the table toolbar, or select View from the Action menu to open the Stock Ledger screen in context for the selected row to research the potential cause for the discrepancy.
View Stock Ledger hyperlink - clicking this link opens the Stock Ledger screen for the subclass/location for the selected month.
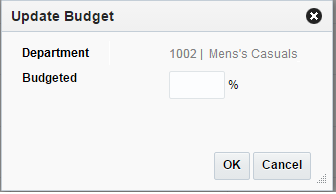
Update Budget hyperlink - clicking this link opens the Update Budget popup. The user can update department budgeted markup % in this popup.
The following values related to this report can be configured in the Report Options screen in Merchandising:
Minimum Variance - minimum variance between CMO % and Markup % of Retail for the department above which subclass/location combinations are displayed in the report.
Subclass Locations Exceeding Variance Critical Count - Count of subclass/locations that exceed the minimum variance % above in the most recently closed month; used for determining tile color.
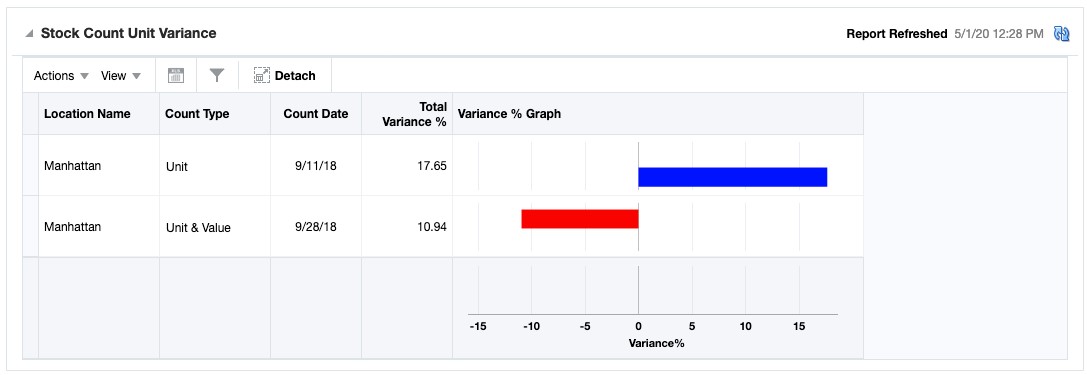
This report is used by the Finance Analyst to review Unit & Value stock counts that have a value variance greater than the Variance Threshold % report system option. This report considers only Unit & Value counts that have unit portion of the count accepted and the value portion still open.
All dashboard-level filters are applicable to the report and stock counts shown in the report will be associated with the specified filter criteria.
This report has three components - a tile, which summarizes the number of Unit and Value stock counts with value variance outside the defined threshold and fulfilling the dashboard filter criteria, a table listing such open stock counts and for each row in the report, a bar graph showing positive or negative variance.
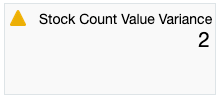
Tile
The tile shows the number of stock count location combinations that have exceeded their Variance Threshold Percent, as defined in report system options.
The color of the tile changes colors to reflect the severity of the variances in terms of amount and quantity. The rules for this are defined in the table below.
| Tile Color | Rule |
|---|---|
| Green | All stock count subclass/locations are within 7 days of their count dates and
The number of such stock counts is less than the Locations Exceeding Threshold Critical Count report option. |
| Yellow | At least one stock count location is past 7 days from its count date or
The number of stock count/locations is more than the Locations Exceeding Threshold Critical Count report option. |
| Red | At least one stock count locations is past 7 days from its count date and
The number of stock count/locations is more than the Locations Exceeding Threshold Critical Count report option. |
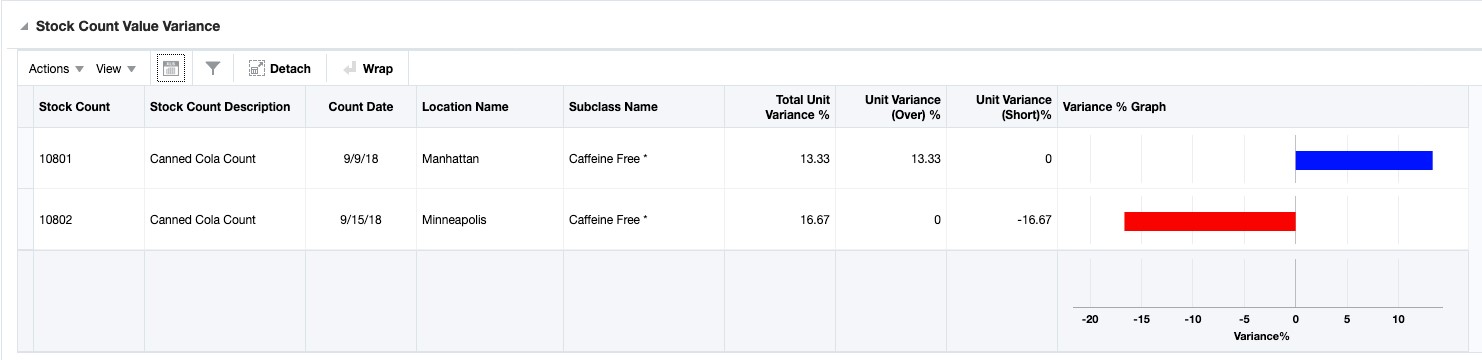
Table
This report is a table that shows the variances plotted in an adjoining bar chart.
| Column | Description |
|---|---|
| Stock Count | Displays the ID of the stock count that is reporting a variance. |
| Stock Count Description | Shows the description of the stock count that is reporting a variance. |
| Location | Displays ID of the store or warehouse with the variance. |
| Location Name | Displays name of the store or warehouse with a variance. |
| Location Type | Displays type of location on the count - Store, Warehouse or External Finisher. |
| Department | Displays department ID where the variance exists for the location. |
| Department Name | Displays department name. |
| Class | Displays class ID in the department where the variance exists for the location. |
| Class Name | Displays class name. |
| Subclass | Displays subclass ID in the department/class where the variance exists for the location of the stock count. |
| Subclass Name | Displays subclass name. |
| Count Date | Displays date that the count was scheduled to occur. |
| Actual Value | The physical count quantity * either the snapshot cost or retail, depending on if the department is cost or retail based. |
| Snapshot Value | The snapshot stock on hand * either the snapshot cost or retail, depending on if the department is cost or retail based. |
| Total Variance % | Displays the variance between actual value and snapshot value of the stock count by subclass/location. It is calculated as:
[Actual Value - Snapshot Value] / Snapshot Value * 100 |
| Unit Variance (Over) % | Displays the variance percentage for items in the subclass/location that were over in the unit portion of the count (count quantity < snapshot quantity), calculated as:
(Count Quantity - Snapshot Quantity) /Total Snapshot Quantity * 100 for those items This is included to help the finance analyst understand the value variance on the count. |
| Unit Variance (Short) % | Displays the variance percentage for items in the subclass/location that were short in the unit portion of the count (count quantity > snapshot quantity), calculated as:
(Count Quantity - Snapshot Quantity) /Total Snapshot Quantity * 100 for those items This is included to help the finance analyst understand the value variance on the count. |
| Total Unit Variance % | Displays the variance percentage for all items in the subclass/location with a variance, calculated as:
(Absolute value of (Count Quantity - Snapshot Quantity)) /Total Snapshot Quantity * 100 |
| Variance % Graph | This in-line bi-directional bar graph displays the total variance % for a subclass/location in the report. Clicking on the bar chart will display a pop up containing:
|
| Action | Description |
|---|---|
| Edit / View Value Variance | The label for this action reads Edit Value Variance or View Value Variance based on the finance analyst's privileges. This action opens the Value Variance and Adjustments screen in edit or view mode respectively for the stock count selected. |
| Accept Results | This action enables the finance analyst to accept one or more of the count results and queues the selected records for processing the inventory value updates. |
The following values related to this report can be configured in the Report Options screen in Merchandising:
Variance Threshold % - percentage that indicates whether or not stock counts will be included in report.
Locations Exceeding Threshold Critical Count - number of locations in stock count with variance that impacts the tile color.
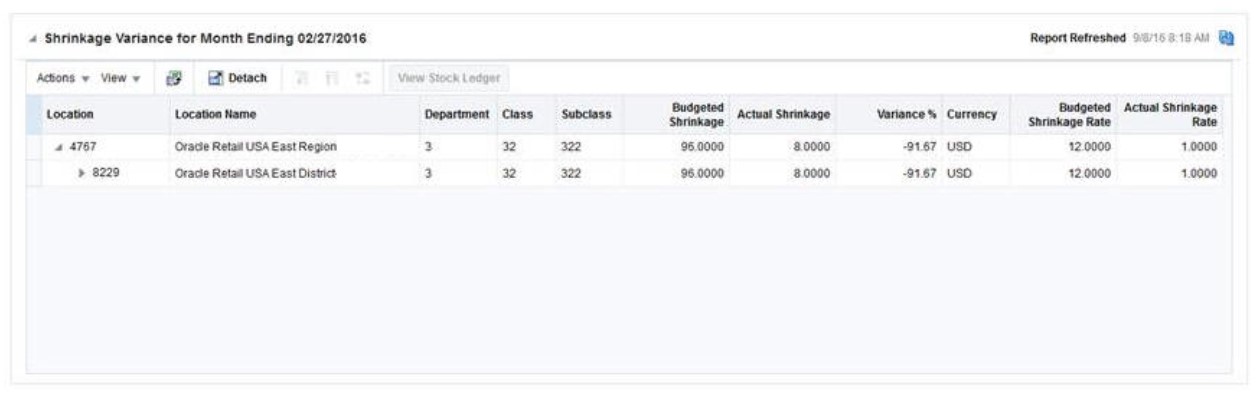
This report displays the subclass/locations where variance between the actual shrinkage in the last month and the budgeted shrinkage rate is outside of a tolerance. The data is summarized to the region level but can be drilled down to the location level as required. This report can help the finance analyst determine whether or not the budgeted shrink rates need to be adjusted or if there are other issues that need to be addressed that resulted in the variances.
All dashboard-level filters are applicable to the report and subclass/locations shown in the report will be associated with the specified filter criteria.
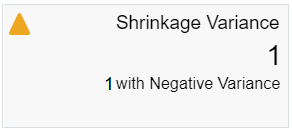
This report has two components - a tile showing the count of subclass/location combinations with a shrinkage variance and a table showing the details.
Tile
This report has two components - a tile showing the count of subclass/location combinations with a shrinkage variance and a table showing the details.
The color of the tile changes based on the minimum and maximum variances and the number of subclass/location combinations configured by the user.
| Tile Color | Rule |
|---|---|
| Green | All subclass/locations in the report have a shrinkage variance that is less than the Maximum Variance % defined in the report options and
The number of subclass/locations in the report is less than or equal to the Variance Count report option. |
| Yellow | Any subclass/location in the report has a shrinkage variance greater than or equal to the Maximum Variance % or
The number of subclass/locations in the report is greater than or equal to the Variance Count report option. |
| Red | Any subclass/location in the report has a shrinkage variance greater than or equal to the Maximum Variance % and
The number of subclass/locations in the report is greater than or equal to the Variance Count report option. |
Table
Data in the table is summarized at the subclass/region level. Clicking the node shows the details about the districts under the region. The finance analyst can further drill down using the nodes to the district level and location level. The variance percentage is displayed for each level based on the locations that have variances that exceed the Variance Tolerance % report option.
| Column | Description |
|---|---|
| Location | Displays ID of the location, region, or district with a shrinkage variance for the subclass. |
| Location Name | Displays name of the location, region or district with a shrinkage variance for the subclass. |
| Department | Displays department ID which the subclass belongs to. |
| Department Name | Displays department name. |
| Class | Displays class ID which the subclass belongs to. |
| Class Name | Displays class name. |
| Subclass | Displays subclass ID. |
| Subclass Name | Displays subclass name. |
| Budgeted Shrinkage | Shows the budgeted shrinkage value applicable to the subclass. It is calculated using the budgeted shrinkage percent for a financial half multiplied by sales at retail or at cost for the previously closed month, depending on whether the retail or cost accounting method is used. |
| Budgeted Shrinkage Rate | Shows the budgeted shrinkage rate applicable to the subclass. |
| Actual Shrinkage | Shows the actual shrinkage value applicable to the subclass. It is obtained from the shrinkage retail or cost value for the previously closed month, depending on whether the retail or cost accounting method is used. |
| Actual Shrinkage Rate | Shows the actual shrinkage rate calculated for the subclass. It is calculated by dividing actual shrinkage by net sales. |
| Total Sales | Shows the total sales for the subclass/location. It can be shown at cost or retail depending on whether the retail or cost accounting method is used. |
| Variance % | Shows the variance between the actual and budgeted shrinkage. |
| Unit and Value Count | This indicates whether a count was processed in the current month, which may indicate a higher than expected shrink or indicate that the budgeted shrink rate was reset. |
| Currency | Displays the local currency for the region, district and location levels. |
Clicking on View Stock Ledger button will open Stock Ledger screen in context for impacted subclass/locations for research.
The following values related to this report can be configured in the Report Options screen in Merchandising:
Variance Tolerance % - variance tolerance exceeding which subclass/locations are shown in this report.
Variance Count - count of subclass/locations that impacts tile color.
Maximum Variance % - maximum variance level that impacts tile color.
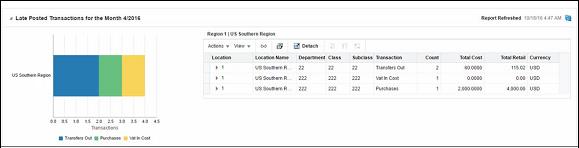
This report provides visibility for the finance analyst of transactions that were intended to have been posted in the previous month but instead got posted to the current month and by location. The table allows the user to drill down to see data at the lower levels of hierarchy through store or warehouse level. The transaction Data screen can be launched in context from the report for further investigation.
This report has three components - a tile, which summarizes the number of late posted transactions for the locations fulfilling the dashboard filter criteria, a stacked bar chart showing the count of late posted transaction by location stacked by transaction type and a table showing the details of late transactions at the configured organization hierarchy level, with an option to drill down to lower hierarchy level.
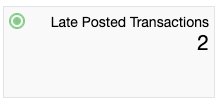
Tile
The tile report shows the count late posted transactions for the locations that fulfill criteria specified in the dashboard filter.
The color of the tile changes based on user defined thresholds for late posted transaction count and number of locations with late posted transactions.
| Tile Color | Rule |
|---|---|
| Green | The count of late transactions is less than the Transaction Count Threshold and
The count of locations with late posted transactions is less than Location Count Threshold defined in the report system options. |
| Yellow | The count of late transactions is equal to or greater than Transaction Count Threshold or
The count of locations with late posted transactions is equal to or greater than Location Count Threshold defined in the report system options. |
| Red | The count of late transactions is equal to or greater than Transaction Count Threshold and
The count of locations with late posted transactions is equal to or greater than Location Count Threshold defined in the report system options. |
Bar Chart
The stacked bar chart shows the count of late posted transactions stacked by transaction type. Clicking on a bar segment refreshes the side table to show further information related to a location group. The Y axis of the chart has the organizational hierarchy node's name (e.g. region name). It can be configured to show region, district, or location. It also shows physical warehouses that have late posted transactions and do not have their reporting level as Region or District. The X axis has the count of transactions by type.
Table
The side panel shows details of late transactions aggregated at the configured organization hierarchy level in a tree table format. Depending on bar segment clicked in the bar chart, the table displays for that particular transaction type, location, and subclass. The default view displays the details of the organization hierarchy with the highest count from the first row.
| Column | Description |
|---|---|
| Location | Represents the ID for the organizational hierarchy. This column is enabled for drilling down to details of lower organizational levels. When the organization hierarchy level is store or virtual warehouse, this is a hyperlink to open Transaction Data screen. |
| Location Name | Displays the name of the organizational hierarchy. |
| Department | Displays the department ID which the subclass which has late posted transaction belongs to. |
| Department Name | Displays the department name. |
| Class | Displays the class ID which the subclass which has late posted transaction belongs to. |
| Class Name | Displays the class name. |
| Subclass | Displays the subclass ID which has late posted transaction. |
| Subclass Name | Displays the subclass name. |
| Transaction | Shows the description of transaction types for the late transactions. |
| Tran Code | Displays the Merchandising transaction code for the late posted transaction. |
| Count | Shows the count of late transactions for a particular transaction type for the location/subclass. |
| Total Cost | Shows the total cost of late transactions associated to a transaction type belonging to a particular location / subclass. For rows showing values at a higher level than that of store/virtual warehouse, this value is converted to the currency of that particular level of hierarchy. |
| Total Retail | Shows the total retail of late transactions associated to a transaction type belonging to a particular location / subclass. For rows showing values at a higher level than that of store/virtual warehouse, this value is converted to the currency of that particular level of hierarchy. |
| Currency | Displays the currency of the respective region, district and location. |
View Transaction Data - clicking on the store or warehouse level hyperlink, clicking on the View iconic button, or selecting View Transaction Data from the Actions menu allows the finance analyst to open the Transaction Data screen in context of the selected subclass/location for the current month.
The following values related to this report can be configured in the Report Options screen in Merchandising:
Transaction Count Threshold - Count of late transactions per location that impacts tile color.
Location Count Threshold - Count of locations with late posted transactions that impacts tile color.
Organizational Hierarchy Display Level - defines the organization hierarchy for late posted transaction display. Possible values are region, area or store.
This dashboard is intended for the users in the Inventory Analyst role, which is focused on managing inventory levels in a retail organization. The reports in this dashboard assist the inventory analyst in monitoring stock variance to plan for the assigned merchandise hierarchies, creating adjustments to open orders or replenishment settings and resolving purchase order issues which may prevent timely shipping or receiving.
This dashboard has the following filters:
Basic
Department*
Store Grade/Area** - a report system option, Filter Location Type, determines whether store grade or area are displayed as a criterion
Store**
Supplier Site
Advanced
Class
Subclass
Brand
Order Context
|
Note:
|
To view the inventory analyst dashboard from the task bar select Reports > Inventory Analyst Dashboard. The Inventory Analyst Dashboard page appears.
This collection of reports enables an inventory analyst to monitor common ordering issues for the orders fulfilling the specified dashboard filter criteria. The order issues that are tracked in this report are:
Past Not After Date
Orders to Close
Never Approved
Once Approved
Missing Order Data
Missing Item Data
This report shows orders that are past the not after date and are still open. It consists of a clickable tile and the Order Details table, displayed when you click on the tile.
Tile
This tile shows a total count of orders that are approved or were once approved (but now are in Worksheet or Submitted status), where the not after date has past. It also displays a bar chart that visually shows the count of orders with a not after date in the last 6 days, by day, and then orders with not after dates that are 7 days or more beyond the current business date. Clicking on the tile will display the details about the order in the table below.
Table
The table has the following information available for each of the orders that are past the not after date:
| Column | Description |
|---|---|
| Order No | Shows the order number of an order that has the issue indicated on the tile selected and meets the filter criteria entered. This is also a hyperlink that allows you to open the purchase order to edit or view the details, depending on privileges. |
| Supplier Site and Name | Shows the ID and name for the supplier for the order. |
| Status | Shows the current status of the order. |
| Not Before Date | Shows the not before date for the order. |
| Not After Date | Shows the not after date for the order. |
| OTB EOW Date | Shows the OTB end of week date for the order. |
| Total Units | This displays the total units on order. |
| Multiple UOM | This indicates if the order contains items with multiple UOMs. |
| Total Cost | Shows the total cost of the order in the order currency. |
| Total Retail | Shows the total retail value of the order in the order currency. |
| Currency | Shows the order currency. |
| Received % | Shows the percent of units that have been received on the order. |
| Import | Indicates whether or not the order is an import order. |
| Master Order No | Shows the master order number associated with the order, if applicable. |
| Outstanding Units | Displays the total outstanding units on the order. |
| Outstanding Cost | Shows the outstanding cost of the order. |
| Outstanding Retail | Shows the outstanding retail of the order. |
| Order Context and Description | This displays the order context type and description. |
| Department and Name | This displays the department ID and name, if a department level order. |
| Comments | Shows order comments, if any. |
| Last Updated By | This displays the ID of the user who last updated the order. |
| Last Updated Date | This displays the timestamp of last update to the order. |
Report Actions
| Actions | Description |
|---|---|
| Cancel Order | This option allows the inventory analyst to cancel one or more orders in the table. Selecting this option will result in a popup being displayed, where the user can select the cancel reason and, if a single order is selected, enter comments. |
| Update Dates | This option allows the inventory analyst to update the Not Before, Not After, and OTB EOW dates for the selected orders. |
| Edit/View Order | This option in the Actions menu, or by clicking on the order number hyperlink, takes the inventory analyst in-context to the Order screen for the order displayed, in either edit or view mode depending on privileges. |
| Edit/View Order Details | This option in the Actions menu takes the inventory analyst in-context to the Order Details screen for the order displayed, in either edit or view mode depending on privileges. |
| Update Comments | This is an option, this allows the inventory analyst to add to the comments that exist for the selected order. |
This report provides the inventory analyst visibility into orders that are within a week of the not after date and have no open shipments against them, indicating that they may not be received on time. It consists of a clickable tile and the Order Details table, displayed when you click on the tile.
Tile
The clickable tile for this report shows the count of open orders that are approved or were once approved and within a week of the not after date, but that have no open shipments. It also displays a bar chart that visually shows the count of orders with a not after date in the next 7 days, by day, starting with today. Clicking on the tile will display the details about the order in the table below.
Table
The table has the following information available for each of the orders that are nearing the not after date:
| Column | Description |
|---|---|
| Order No | Shows the order number of an order that has the issue indicated on the tile selected and meets the filter criteria entered. This is also a hyperlink that allows you to open the purchase order to edit or view the details, depending on privileges. |
| Supplier Site and Name | Shows the ID and name for the supplier for the order. |
| Status | Shows the current status of the order. |
| Not Before Date | Shows the not before date for the order. |
| Not After Date | Shows the not after date for the order. |
| OTB EOW Date | Shows the OTB end of week date for the order. |
| Total Units | This displays the total units on order. |
| Multiple UOM | This indicates if the order contains items with multiple UOMs. |
| Total Cost | Shows the total cost of the order in the order currency. |
| Total Retail | Shows the total retail value of the order in the order currency. |
| Currency | Shows the order currency. |
| Received % | Shows the percent of units that have been received on the order. |
| Import | Indicates whether or not the order is an import order. |
| Master Order No | Shows the master order number associated with the order, if applicable. |
| Outstanding Units | Displays the total outstanding units on the order. |
| Outstanding Cost | Shows the outstanding cost of the order. |
| Outstanding Retail | Shows the outstanding retail of the order. |
| Order Context and Description | This displays the order context type and description. |
| Department and Name | This displays the department ID and name, if a department level order. |
| Comments | Shows order comments, if any. |
| Last Updated By | This displays the ID of the user who last updated the order. |
| Last Updated Date | This displays the timestamp of last update to the order. |
Report Actions
| Action | Description |
|---|---|
| Cancel Order | This option allows the inventory analyst to cancel one or more orders in the table. Selecting this option will result in a popup being displayed, where the user can select the cancel reason and, if a single order is selected, enter comments. |
| Update Dates | This option allows the inventory analyst to update the Not Before, Not After, and OTB EOW dates for the selected orders. |
| Edit/View Order | This option in the Actions menu, or clicking on the order number hyperlink, takes the inventory analyst in-context to the Order screen for the order displayed, in either edit or view mode depending on privileges. |
| Edit/View Order Details | This option in the Actions menu takes the inventory analyst in-context to the Order Details screen for the order displayed, in either edit or view mode depending on privileges. |
| Update Comments | This is an option, this allows the inventory analyst to add to the comments that exist for the selected order. |
This report displays a count of orders that have never been approved and which need to be approved within seven days from the current date in order to ensure that they can be received by their order dates. It consists of a clickable tile and the Order Details table, displayed when you click on the tile.
Tile
The clickable tile for this report shows the count of orders that have never been approved and are within 7 days from the latest date it can be approved, which is determined as
Not before date - maximum lead time from items on the order
It also displays a bar chart that visually shows the count of orders that should be approved in the next 7 days, by day, starting with today. Clicking on the tile will display the details about the order in the table below.
Table
The table has the following information available for each of the orders that haven't been approved:
| Column | Description |
|---|---|
| Order No | Shows the order number of an order that has the issue indicated on the tile selected and meets the filter criteria entered. This is also a hyperlink that allows you to open the purchase order to edit or view the details, depending on privileges. |
| Supplier Site and Name | Shows the ID and name for the supplier for the order. |
| Status | Shows the current status of the order. |
| Not Before Date | Shows the not before date for the order. |
| Not After Date | Shows the not after date for the order. |
| OTB EOW Date | Shows the OTB end of week date for the order. |
| Total Units | This displays the total units on order. |
| Multiple UOM | This indicates if the order contains items with multiple UOMs. |
| Total Cost | Shows the total cost of the order in the order currency. |
| Total Retail | Shows the total retail value of the order in the order currency. |
| Currency | Shows the order currency. |
| Received % | Shows the percent of units that have been received on the order. |
| Import | Indicates whether or not the order is an import order. |
| Master Order No | Shows the master order number associated with the order, if applicable. |
| Outstanding Units | Displays the total outstanding units on the order. |
| Outstanding Cost | Shows the outstanding cost of the order. |
| Outstanding Retail | Shows the outstanding retail of the order. |
| Order Context and Description | This displays the order context type and description. |
| Department and Name | This displays the department ID and name, if a department level order. |
| Comments | Shows order comments, if any. |
| Last Updated By | This displays the ID of the user who last updated the order. |
| Last Updated Date | This displays the timestamp of last update to the order. |
Report Actions
| Action | Description |
|---|---|
| Delete Order | This will allow one or more orders to be deleted |
| Approve Order | This allows one or more orders to be approved. |
| Update Dates | This option allows the inventory analyst to update the Not Before, Not After, and OTB EOW dates for the selected orders. |
| Edit/View Order | This option in the Actions menu, or by clicking on the order number hyperlink, takes the inventory analyst in-context to the Order screen for the order displayed, in either edit or view mode depending on privileges. |
| Edit/View Order Details | This option in the Actions menu takes the inventory analyst in-context to the Order Details screen for the order displayed, in either edit or view mode depending on privileges. |
| Update Comments | This allows the inventory analyst to add to the comments that exist for the selected order. |
This report displays a count of orders that have were once approved, but are now in a worksheet or submitted status, and need to be approved within seven days from the current date in order to ensure that they can be received by their order dates. It consists of a clickable tile and the Order Details table, displayed when you click on the tile.
Tile
The clickable tile for this report shows the count of orders were once approved and are within 7 days from the latest date it can be approved, which is determined as
Not before date - maximum lead time from items on the order
It also displays a bar chart that visually shows the count of orders that should be approved in the next 7 days, by day, starting with today. Clicking on the tile will display the details about the order in the table below.
Table
The table has the following information available for each of the orders that haven't been approved:
| Column | Description |
|---|---|
| Order No | Shows the order number of an order that has the issue indicated on the tile selected and meets the filter criteria entered. This is also a hyperlink that allows you to open the purchase order to edit or view the details, depending on privileges. |
| Supplier Site and Name | Shows the ID and name for the supplier for the order. |
| Status | Shows the current status of the order. |
| Not Before Date | Shows the not before date for the order. |
| Not After Date | Shows the not after date for the order. |
| OTB EOW Date | Shows the OTB end of week date for the order. |
| Total Units | This displays the total units on order. |
| Multiple UOM | This indicates if the order contains items with multiple UOMs. |
| Total Cost | Shows the total cost of the order in the order currency. |
| Total Retail | Shows the total retail value of the order in the order currency. |
| Currency | Shows the order currency. |
| Received % | Shows the percent of units that have been received on the order. |
| Import | Indicates whether or not the order is an import order. |
| Master Order No | Shows the master order number associated with the order, if applicable. |
| Outstanding Units | Displays the total outstanding units on the order. |
| Outstanding Cost | Shows the outstanding cost of the order. |
| Outstanding Retail | Shows the outstanding retail of the order. |
| Order Context and Description | This displays the order context type and description. |
| Department and Name | This displays the department ID and name, if a department level order. |
| Comments | Shows order comments, if any. |
| Last Updated By | This displays the ID of the user who last updated the order. |
| Last Updated Date | This displays the timestamp of last update to the order. |
Report Actions
| Action | Description |
|---|---|
| Cancel Order | This will allow one or more orders to be deleted |
| Approve Order | This allows one or more orders to be approved. |
| Update Dates | This option allows the inventory analyst to update the Not Before, Not After, and OTB EOW dates for the selected orders. |
| Edit/View Order | This option in the Actions menu, or by clicking on the order number hyperlink, takes the inventory analyst in-context to the Order screen for the order displayed, in either edit or view mode depending on privileges. |
| Edit/View Order Details | This option in the Actions menu takes the inventory analyst in-context to the Order Details screen for the order displayed, in either edit or view mode depending on privileges. |
| Update Comments | This allows the inventory analyst to add to the comments that exist for the selected order. |
This report provides the inventory analyst with a count of approved or previously approved orders that are due to arrive in the next 4 weeks, and are missing one of the following:
Lading Port (for import orders only)
Discharge Port (for import orders only)
Factory
The report tile also includes a bar chart that shows the spread of these orders across each of the next 4 weeks, based on the not before date.
Tile
This tile shows the total count of orders that are in approved status or were previously approved, and are due to arrive in the next 4 weeks, but are missing key information. It also includes a bar chart to help the inventory analyst understand how those orders are spread out over the next four weeks and prioritize resolving the issues. Clicking on the tile will display the details about the order in the table below.
Table
The table has the following information available for each of the orders that are missing data:
| Column | Description |
|---|---|
| Order No | Shows the order number of an order that has the issue indicated on the tile selected and meets the filter criteria entered. |
| Supplier Site | Shows the ID for the supplier for the order. |
| Supplier Site Name | Shows the name of the supplier for the order. |
| Status | Shows the current status of the order. |
| Not Before Date | Shows the not before date for the order. |
| Not After Date | Shows the not after date for the order. |
| OTB EOW Date | Shows the OTB end of week date for the order. |
| Total Units | This displays the total units on order. |
| Multiple UOM | This indicates if the order contains items with multiple UOMs. |
| Total Cost | Shows the total cost of the order in the order currency. |
| Total Retail | Shows the total retail value of the order in the order currency. |
| Currency | Shows the order currency. |
| Received % | Shows the percent of units that have been received on the order. |
| Import | Indicates whether or not the order is an import order. |
| Master Order No | Shows the master order number associated with the order, if applicable. |
| Outstanding Units | Displays the outstanding units computed by aggregating the open quantities on the order. |
| Outstanding Cost | Shows the outstanding cost of the order. |
| Outstanding Retail | Shows the outstanding retail of the order. |
| Order Context | This displays the order context type. |
| Order Context Description | This displays the order context description. |
| Department | This displays the department ID in case of department level orders. |
| Department Name | This displays the department name in case of department level orders. |
| Comments | Shows order comments, if any. |
| Last Updated By | This displays the ID of the user who last updated the order. |
| Last Updated Date | This displays the timestamp of last update to the order. |
| Error Details | Describes the error that caused the order to appear in the report. Order data monitored are:
|
Report Actions
| Action | Description |
|---|---|
| Edit/View Order | This option in the Actions menu, or by clicking on the order number hyperlink, takes the inventory analyst in-context to the Order screen for the order displayed, in either edit or view mode depending on privileges. |
| Edit/View Order Details | This option in the Actions menu takes the inventory analyst in-context to the Order Details screen for the order displayed, in either edit or view mode depending on privileges. |
This report provides the inventory analyst a count of approved or previously approved orders that are due to arrive in the next 4 weeks, but are missing any the following for one or more of the items on the order:
HTS classification missing or not approved (for import orders only)
Reference item (bar code) not defined or not associated with the order
Zero or negative margin
Tile
The clickable tile for this report shows the count of orders that are missing key item data for the order and are due to arrive in the next 4 weeks, based on the not before date. It also includes a bar chart to help the inventory analyst understand how those orders are spread out over the next four weeks and prioritize resolving the issues. Clicking on the tile will display the details about the order in the table below.
Table
| Column | Description |
|---|---|
| Order No | Shows the ID of the order that has an item missing one or more key data elements and meets the filter criteria entered. |
| Item | Shows the ID of the item on the order that has one or more issues. |
| Item Description | Shows the description of the item. |
| Item Parent | This column indicates the item's parent. |
| VPN | This column indicates the VPN for the item for the supplier on the order. |
| Primary Reference Item | This shows primary reference number of the item, if it exists. If no reference items are defined in Merchandising, the table column presents a create icon that allows a quick launch into the Item children screen to create a new reference item. |
| Import | This is a checkbox that indicates whether or not the order is an import order. |
| Margin | Indicates the margin of the item based on the PO cost and the current retail price for the item. |
| Error Details | Describes the error that caused the order to appear in the report. Order/item data monitored are:
|
Report Actions
| Action | Description |
|---|---|
| Edit/View Order | This option in the Actions menu, or by clicking on the order number hyperlink, takes the inventory analyst in-context to the Order screen for the order displayed, in either edit or view mode depending on privileges. |
| Edit/View Ordre Details | This option in the Actions menu takes the inventory analyst in-context to the Order Details screen for the order displayed, in either edit or view mode depending on privileges. |
| Edit/View Item | This option in the Actions menu, or by clicking on the Item hyperlink will open Item screen for the selected item, in either edit or view depending on privileges. |
| Edit/View Item Parent | This option in the Actions menu, or clicking on the Item hyperlink will open Item screen for the selected item, in either edit or view depending on privileges. |
| Add HTS | This option opens the Order screen, so that HTS codes for the order/item combination where it is missing can be added. |
| Add Reference Item | This option will add the primary reference item for the item, if defined, to the order. |
Configurations
The following values related to these reports can be configured in the Report Options screen in Merchandising:
Validate Reference Items - If this is set to Yes, then system enforces the check for missing reference item on the order and show errors.
Include Factory Check - If this is set to Yes, then system enforces the check for factory missing on the order and show errors.
This report shows item/location combinations with negative inventory balances in order to alert the inventory analyst to take necessary action. Only those item/locations with inventory values less than their configured inventory variance' number of units (from zero) are shown. You can navigate to transaction level data window to identify exceptions, by clicking Item hyperlink or by action drop down to view the transaction data for the selected item.
| Metric | Description |
|---|---|
| Item | Shows the ID of an item with negative inventory at the location. |
| Description | Shows the item description. |
| Location | Shows the location ID where the item has negative inventory. If Store Grade is specified in the filter criteria then the report shows the stores that are part of the store grade group plus, all virtual warehouses and internal finishers which match the negative inventory criteria. In case of Area, only stores and warehouses (virtual warehouses as well as internal finishers) that are part of the Area hierarchy appear on the report. |
| Location Name | Shows the location name. |
| Location Type | Shows the location type. Valid values are store or warehouse. |
| Stock On Hand | Summary of the stock on hand for the item/location, including on hand that is part of a pack (for warehouse locations only). |
| In Progress Shipments - Orders | Number of units present in incoming deliveries against open orders for the item/location. |
| In Progress Shipments - Transfers | Number of units present in incoming transfers for the item/location. |
| In Progress Shipments - Allocations | Number of units present in inbound allocations for the item/location. |
| Standard UOM | Shows the standard UOM of the item. |
Selecting the View Transaction Detail option in the Action menu or clicking on the item hyperlink opens the Transaction Data screen where the inventory analyst can view transactions linked with the selected item/location to investigate how the negative inventory situation may have occurred.
The following values related to this report can be configured in the Report Options screen:
Quantity Threshold - Only the item/locations with inventory values less than this number of units (from zero) are shown in this report. Exceptions to the system defined value can also be defined by department.
This report is used by an Inventory Analyst to provide a weekly review of their business by highlighting items that have a significant inventory variance to forecasted sales over the next four weeks. It contains related reports that are used to provide more context and assist in decision making, as well as a number of actions that can be taken from the dashboard to resolve issues. Only forecasted, inventoried items will appear in this report.
There are also 4 reports shown in the context of this report that are described in other sections below - Inventory by Store, Inventory by Warehouse, Open Orders, and Lead Time Days.
This report is intended to highlight potential inventory shortages or overages to an inventory analyst. It highlights sales from the last four weeks for an item and its variance to the forecast for that same period. And it also looks at expected future inventory and the forecast for the next four weeks. The location data considered for the report is based on the dashboard filter selections.
The data in the report can be toggled to be shown by item parent, parent/diff aggregate, or transaction item level. It can also be filtered to show subsets of the data, so that the inventory analyst can focus on ranges of variance while reviewing the data. These ranges are configurable. The table data includes:
| Item Details | Description |
|---|---|
| Sales - Units | Sum of sales units for item in the parent item or parent item/diff aggregate or transaction item over the last 4 weeks in terms of the standard UOM. Including the current week to date sales. |
| Sales - Variance % | (Sum of sales units - Sum of sales forecast) / Sum of sales forecast |
| Inventory Variance to Forecast -Units | Sum of available inventory - Sum of forecasted sales for the next 4 weeks including the current week, prorated based on the day in the week. Available inventory is calculated as (on hand + inbound inventory - reserved inventory - customer backorder - non-sellable inventory)
A positive variance would indicate more inventory inbound than sales forecasted. A negative variance would indicate more sales expected than inventory to cover. |
| Inventory Variance to Forecast - Value | Inventory Variance to Forecast - Units * Current selling price in the primary currency, based on the base zone for the item. |
| Forecast Variance % | Inventory Variance to Forecast - Units/Sum of forecasted sales for the next 4 weeks |
Edit/View Item - Allows the inventory analyst to launch into the Item screen for the selected item. The screen is opened in edit or view mode, depending on the privileges.
Create Order - This initiates the order creation using the primary supplier and the department for the first selected parent item, parent item/diff aggregate or transaction item. The selected items get seeded into the details of the order. Then, the Order Header screen is opened in edit mode. It is intended to allow the inventory analyst to create new orders to address projected inventory shortfall.
Create Allocation - This opens the advanced version of the Create Standard Allocation screen in the Allocation Cloud Service to allow the inventory analyst to create new allocations to address projected inventory shortfall. It launches the Create Standard Allocation screen with the parent item or transaction item entered as search criteria and the search auto executed and the warehouse checkbox in the checked state. This option is displayed only if Allocation is provisioned based on system options and the user has the Maintain Allocation privilege.
Update Replenishment Attributes - This opens the Manage Replenishment Attributes screen for the parent item, parent item/diff aggregate or transaction item in edit mode so that replenishment attributes can be adjusted based on the projected overage/shortage.
Defer Variance - Allows the item parent, item parent/diff aggregate, or transaction item to be deferred from the variance report for a designated amount of time. This option may be chosen if there isn't any action that can be taken currently to address the issue and the inventory analyst wants to defer further updates for the time being.
The following values related to this report can be configured in the Report Options screen:
Inventory Variance to Forecast Report Supported - Indicates if the Inventory Variance to Forecast report in the Inventory Analyst dashboard is being used. If yes, the system will preserve 4 weeks of item weekly forecasted sales data before loading the next set of forecasting data.
The following configurations can be defined at the system level which limits the items returned in the table based on the inventory variance percentage for an item to the forecasted value. Exceptions to the system defined value can also be defined by department.
Upper Inventory Variance:
High Lower Inventory Variance % - Specifies the upper limit of the lower threshold range.
High Upper Inventory Variance % - Specifies the upper limit of the upper threshold range.
Lower Inventory Variance:
Low Lower Inventory Variance % - Specifies the lower limit of the lower threshold range.
Low Upper Inventory Variance % - Specifies the lower limit of the upper threshold range.
This report shows the inventory figures by active, ranged, store, store grade, or region for the highlighted parent item, parent/diff, or transaction item in the Inventory Variance to Forecast table. For each location or location grouping, the report will display the available on hand, inbound units and forecasted sales values. The intent of this report is to indicate what stores or store groupings for the item may have more or less inventory than needed for potential re-balancing of inventory. Clicking on the bars in the report provides a more detailed breakdown of the inventory figures.
| Metric | Description |
|---|---|
| On Hand | Summary of stock on hand for the item in the stores or store groupings. |
| Reserved Inventory | Summary of inventory reserved in the stores or store groupings expected to ship in the next 4 weeks related to RTVs, transfers and customer orders for the item. |
| Customer Backorder | Summary of inventory classified as customer backorder in the stores or store groupings for the item. |
| Non-sellable Inventory | Summary of inventory classified as non-sellable in the stores or store groupings for the item. |
| Available On Hand | Calculated as On Hand - Reserved - Customer Backorder - Non-sellable |
| Inbound Inventory | Summary of in transit, on order, transfer expected, and inbound allocations for the item at the store or store groupings that is expected to arrive in the next 4 weeks. |
| Forecast | Summary of sales forecast data for store or store groupings for the next 4 weeks for the item. Note: This is the black square in the example above. |
The Inventory by Warehouse report displays the total available on-hand and inbound inventory for any warehouses supplying the parent item, parent/diff, or transaction item highlighted in the table of the Inventory Variance to Forecast report in the stores being represented based on the dashboard filter. The relationship between the item/stores and warehouse is determined using the sourcing warehouse for the item at the store, or otherwise the store's default warehouse.
For each warehouse, the report will display the available on hand and inbound units. The intent of this report is to indicate what warehouses for the item may have inventory that could be allocated or transferred. Clicking on the bars in the report provides a more detailed breakdown of the inventory figures.
| Metric | Description |
|---|---|
| On Hand | Summary of stock on hand, including pack component quantity, for the item in the warehouse. |
| Reserved Inventory | Summary of inventory reserved in the warehouse, including pack component quantity, expected to ship in the next 4 weeks related to RTVs, transfers and customer orders for the item. |
| Customer Backorder | Summary of inventory classified as customer backorder, including pack component quantity, in the warehouse for the item. |
| Non-sellable Inventory | Summary of inventory classified as non-sellable in the warehouse groupings for the item. |
| Available On Hand | Calculated as On Hand - Reserved - Customer Backorder - Non-sellable |
| Inbound Inventory | Summary of in transit, on order, transfer expected, and inbound allocations, including pack component quantity, for the item at the warehouse that is expected to arrive in the next 4 weeks. |
This report allows you to see open orders due in the next four weeks the parent item, parent/diff, or transaction item highlighted in the table of the Inventory Variance to Forecast report. It is intended to help the inventory analyst determine whether there are any open orders that could be cancelled in overstock situations.
| Metric | Description |
|---|---|
| Order Number | Shows the order number of open, approved or once approved orders that are due to be received in the next 4 weeks (based on the not after date) and include items in the parent item or parent item/diff aggregate or transaction item. |
| Delivery Window | A Gantt chart indicating the not before and not after dates for the order in the report. |
Edit Order - Selecting this option under the Actions icon, or by clicking on the order number's hyperlink, opens the Order Header screen for more details on the order based.
Cancel Item on Order - selecting this option under the Actions icon displays a cancel order pop-up to the inventory analyst, allowing them to enter a cancel reason and cancel the item from the order. The cancel is limited to the item (or all items for the selected parent or parent/diff combination) on the order. If the inventory analyst wants to cancel the entire order, they should access the order header and cancel the order in that screen.
Reallocate Order - selecting this option under the Action icon opens the Manage Allocations option in Allocations in advanced search mode, with the order number pre-populated and query executed. This is only displayed if Allocation is provisioned for the implementation based on system options.
Reallocate Order Item - selecting this option under the Actions icon opens the Manage Allocations option in Allocations in advanced search mode, with the order number and parent item or transaction item pre-populated and the query executed. This is displayed if Allocation is provisioned for the implementation based on system options.
The Lead Time Days report displays a variance between the planned and actual review cycle, warehouse lead time, and supplier-site lead times. For items not on replenishment, only the supplier lead time would be considered for this report. Significant variances between planned and actual may be causing an over or short inventory situation for a particular item and indicate a need for updates.
| Metric | Description |
|---|---|
| Review Cycle (plan) | Represents the average setting defined in the system for the number of days between which the transaction item, parent item or parent item/diff aggregate is reviewed for replenishment across locations. |
| Review Cycle (actual) | Represents the average number of days between all purchase orders created for this transaction item, parent item or parent item/diff aggregate in the last 4 weeks. |
| Warehouse Lead Time (plan) | Represents the average value for the warehouse lead time for a transaction item, parent item or parent item/diff aggregate defined in the system based on replenishment parameters. It indicates the amount of time it takes to ship inventory from a warehouse to the store it services. |
| Warehouse Lead Time (actual) | Represents the average number of days it has taken to ship transfers or allocations of this transaction item, parent item or parent item/diff aggregate from a retailer's warehouse to a store in the last 4 weeks. |
| Supplier Lead Time (plan) | Represents the average value for the supplier lead time for the transaction item, parent item or parent item/diff aggregate defined in the system for the primary supplier. It includes both the time it takes the supplier to process the order, as well as to ship it to the retailer's location. |
| Supplier Lead Time (actual) | Represents the average number of days it has taken to receive a purchase order from the primary supplier for this transaction item, parent item or parent item/diff aggregate in the last 4 weeks from the time it was originally approved. |
The Inventory Control dashboard is intended to be used by a corporate inventory control analyst, who is focused on ensuring that inventory transactions are being completed in a timely manner. The dashboard reports aid an inventory control analyst by ensuring stock orders and RTVs are reconciled and closed in a timely manner and that stock counts are reported, reconciled and processed within an acceptable processing window.
The Dashboard is comprised of a filter, followed by a set of reports that are refreshed based on the filter criteria. Each report is comprised of a tile that displays the number of actionable items specific to the report. Clicking on the different tiles will display each report.
At the top of the dashboard is a criteria-based filter that allows the user to filter the data displayed in the dashboard to their area in the organization. For the Inventory Control Analyst dashboard, only a location or location hierarchy field is mandatorily required.
Selecting the Advanced button provides the ability to indicate multiples of filter criteria, such as department.
Filters for this dashboard are:
Chain**
Area**
Location**
Supplier Site
Department
Class
Subclass
To view the inventory control dashboard, from the task bar select Reports > Inventory Control Dashboard. The Inventory Control Dashboard window appears.
This report shows the transfers in Submitted status that have passed a certain configurable number of days after creation without being approved or deleted. This will be helpful in ensuring that the transfers, especially those created out of semi-automated replenishment, are approved in a timely manner in order to ensure they are executed as planned. The number of days is determined by the Past Creation Date Days report system option. Franchise and Customer Orders Foot 2 are excluded from this report.
All dashboard-level filters are applicable to the report. Selecting a chain or an area in the filter searches and displays the result for the locations that come under the respective hierarchy for either the from or to location. The location filter corresponds to both from and to locations of the searched stock orders and displays the results.
This report includes a clickable tile and then a table that shows the details of the transfers that require approval.
Tile
The clickable tile for this report shows the count of transfers that need approval based on the dashboard criteria entered.
The color of the tile changes colors to reflect the severity. The rules for this are defined in the table below.
| Tile Color | Rule |
|---|---|
| Green | All of the transfers shown in this report are within 7 days + Past Creation Date Days of the create date or
The number of transfers shown in the report is less than the Stock Order Critical Count report option. |
| Yellow | One or more transfers are more than 7 days + Past Creation Date Days from the create date or
The number of transfers shown in the report is greater than the Stock Order Critical Count report option. |
| Red | One or more transfers are more than 7 days + Past Creation Date Days from the create date and
The number of transfers shown in the report is greater than the Stock Order Critical Count report option. |
Table
The details of the transfers needing the inventory control analyst's attention are shown in the table when the tile for this report is clicked. The details include the following:
| Column | Description |
|---|---|
| Transfer | The transfer number of a transfer that needs to be approved is a hyperlink that, when clicked opens the Transfer screen in edit/view mode based on user privileges. |
| Type | This shows the transfer type. |
| From Location Type | This shows the source location type for the transfer - Store or Warehouse. |
| From Location | This shows the source location on the transfer. |
| From Location Name | This shows the source location's name. |
| To Location Type | This shows the destination location type for the transfer. |
| To Location | This shows the destination location on the transfer - Store or Warehouse. |
| To Location Name | This shows the destination location's name. |
| Created Date | This shows the date on which the transfer was created. |
| Delivery Date | This shows the planned delivery date on the transfer. |
| Transfer Cost | This shows the total transfer cost for the transfer based on the source location's cost and shown in the source location's currency. |
| Transfer Retail | This shows the total transfer retail for the transfer based on the source location's retail. For intercompany transfers, the transfer price is used for this calculation. It is shown in the source location's currency. |
| Currency | This shows from location currency. |
| Intercompany | Indicates if the transfer is intercompany, which may be the case even if the transfer type is not Intercompany. |
| Finisher | This shows the finisher ID on the transfer, if applicable. |
| Finisher Name | This shows the finisher name, if applicable. |
| Action | Description |
|---|---|
| Approve Transfer | Clicking on the Approve button or selecting the Approve action from the Actions menu approves the selected transfers. One or more transfers can be selected for approval at a time. |
| Delete Transfer | Selecting the Delete action from the Actions menu or clicking on the Delete button changes the transfer status to Deleted for the selected transfers. One or more transfers can be selected for deletion at a time. |
| View Transfer | Clicking on the transfer number hyperlink launches into the Transfer screen in view or edit mode depending on user privileges. |
The following values related to this report can be configured in the Report Options screen:
Past Creation Date Days - Number of days past the create date of transfer to determine whether the transfer is displayed in the report.
Stock Order Critical Count - For tiles, users can configure the threshold number of transfers shown in the report past which the tile turns critical.
This report provides visibility to approved transfers with a not after date or delivery date that is more than Past Expected Receipt Date days in the past and has not yet shipped. Franchise and Customer OrdersFoot 3 are excluded from this report. Also, intercompany transfers will only be displayed to an inventory control analyst that has privileges for managing that type of transfer.
This report consists of a clickable tile and a table that shows the details on the transfers that are overdue for shipment.
Tile
The clickable tile for this report shows the count of transfers that are overdue based on the dashboard criteria entered.
The color of the tile changes colors to reflect the severity. The rules for this are defined in the table below.
| Tile Color | Rule |
|---|---|
| Green | All transfers shown in this report have passed the date where they should have shipped, but they have not exceeded the Past Expected Receipt Date days and
The number of transfers do not exceed the Stock Order Critical Count |
| Yellow | All the transfers shown in this report have passed the date they should have shipped + the Past Expected Receipt Date days or
The number of transfers exceed the Stock Order Critical Count. |
| Red | All the transfers shown in this report have passed the date they should have shipped + the Past Expected Receipt Date days and The number of transfers exceed the Stock Order Critical Count. |
Table
The details of the transfers needing the inventory control analyst's attention are shown in the table when the tile for this report is clicked. The details include the following:
| Column | Description |
|---|---|
| Transfer | This shows the transfer number and is a hyperlink that, when clicked, opens Transfer screen in edit/view mode based on user privileges. |
| Type | This shows the transfer type. |
| From Location | This shows the source location on the transfer. |
| From Location Type | This shows the source location type - Store or Warehouse. |
| From Location Name | This shows the source location name. |
| To Location | This shows the destination location on the transfer. |
| To Location Type | This shows the destination location type - Store or Warehouse. |
| To Location Name | This shows the destination location name. |
| Approval Date | This shows the date on which transfer was approved. |
| Not After Date | This shows the not after date on the transfer. If this is not available, delivery date is used as the reference. |
| Delivery Date | This shows the delivery date on the transfer. |
| Transfer Quantity | This shows the total transfer quantity for the transfer. |
| Multiple UOM | Indicates whether the transfer quantity represents a mix of units of measure. |
| Intercompany | Indicates if the transfer is intercompany, which may be the case even if the transfer type is not Intercompany. |
| Finisher | This shows the finisher ID on the transfer, if applicable. |
| Finisher Name | This shows the finisher name, if applicable. |
| Action | Description |
|---|---|
| Delete | The delete iconic button, or selecting the Delete option from the Actions menu, allows the inventory control analyst to update the status of the transfer to Deleted. |
| View Transfer | Clicking on the transfer number, or selecting View Transfer from the Actions menu, launches into the Transfer screen in view or edit mode depending on user privileges. |
The following values related to this report can be configured in the Report Options screen:
Past Expected Receipt Date - Number of days past the expected shipment date for the transfer that results in the transfer appearing in the report.
Stock Order Critical Count - For tiles, users can configure the threshold number of transfers shown in the report past which the tile turns critical.
This report will provide visibility to approved allocations that have passed their release date plus Past Expected Receipt Date days, buy has not shipped.
This report consists of a clickable tile and a table that shows the details on the allocations that are overdue for shipment.
Tile
The clickable tile for this report shows the count of allocations that are overdue based on the dashboard criteria entered.
The color of the tile changes colors to reflect the severity. The rules for this are defined in the table below.
| Tile Color | Rule |
|---|---|
| Green | All allocations shown in this report have passed the date where they should have shipped, but they have not exceeded the Past Expected Receipt Date days and
The number of allocations do not exceed the Stock Order Critical Count. |
| Yellow | All the allocations shown in this report have passed the date they should have shipped + the Past Expected Receipt Date days or
The number of allocations exceed the Stock Order Critical Count. |
| Red | All the allocations shown in this report have passed the date they should have shipped + the Past Expected Receipt Date days and
The number of allocations exceed the Stock Order Critical Count. |
Table
The details of the allocations needing the inventory control analyst's attention are shown in the table when the tile for this report is clicked. The details include the following:
| Columns | Description |
|---|---|
| Allocation | This shows the Allocation ID, which is a hyperlink that, when clicked, opens Allocation Detail popup. |
| From Location | This shows the from location on the allocation. |
| From Location Type | This shows the from location type - Warehouse. |
| From Location Name | This shows the from location name. |
| Item | This shows the item ID of the item on the allocation. |
| Item Description | This shows the item description. |
| Released Date | This shows the date on which allocation was to be released. |
| Allocation Quantity | This shows the sum of allocated quantity across all destination locations for the item. |
Allocation Details - the allocation hyperlink, or selecting Allocation Details from the Actions menu, opens a popup which shows the details of the chosen allocation record, including the destination locations and quantities.
The following values related to this report can be configured in the Report Options screen:
Past Expected Receipt Date - Number of days past the expected shipment date for the allocation that results in the allocation appearing in the report.
Stock Order Critical Count - For tiles, users can configure the threshold number of allocations shown in the report past which the tile turns critical.
This report will provide visibility to approved return to vendor transactions that should have shipped based on the not after date of the transaction plus Past Expected Receipt Date days, but has not yet shipped. If not after date is not available for an RTV, then the report will use created date as the basis.
This report consists of a clickable tile and a table that shows the details on the RTVs that are overdue for shipment.
Tile
The clickable tile for this report shows the count of RTVs that are overdue based on the dashboard criteria entered.
The color of the tile changes colors to reflect the severity. The rules for this are defined in the table below.
| Tile Color | Rule |
|---|---|
| Green | None of the RTVs shown in this report have passed the date they should have shipped + the Past Expected Receipt Date days and
The number of RTVs does not exceed the Stock Order Critical Count. |
| Yellow | All the RTVs shown in this report have passed the date they should have shipped + the Past Expected Receipt Date days or
The number of RTVs exceed the Stock Order Critical Count. |
| Red | All the RTVs shown in this report have passed the date they should have shipped + the Past Expected Receipt Date days and
The number of RTVs exceed the Stock Order Critical Count. |
Table
The details of the RTVs needing the inventory control analyst's attention are shown in the table when the tile for this report is clicked. The details include the following:
| Column | Description |
|---|---|
| RTV | This shows the RTV number, which is a hyperlink that, when clicked, opens RTV screen in edit/view mode based on user privileges. |
| From Location | This shows the from location on the RTV. |
| From Location Type | This shows the from location type - Warehouse or Store. |
| From Location Name | This shows the from location name. |
| Supplier Site | This shows the supplier site ID that is on the RTV. |
| Supplier Site Name | This shows the supplier site name. |
| Created Date | This shows the date on which RTV was created. |
| Not After Date | This shows the not after date for the RTV. |
| RTV Quantity | This shows the sum of quantity of items which are present in the RTV. |
| Multiple UOM | Indicates whether the RTV quantity represents a mix of units of measure. |
Cancel RTV - This action allows the user to update the status of the selected RTV orders to Cancelled.
View RTV - This action, or the hyperlink on RTV, launches into the RTV screen in edit mode provided the user has the Maintain RTV privileges otherwise, the user will have view mode capability.
The following values related to this report can be configured in the Report Options screen:
Past Expected Receipt Date - Number of days past the expected shipment date for the RTV that results in the RTV appearing in the report.
Stock Order Critical Count - For tiles, users can configure the threshold number of RTV shown in the report past which the tile turns critical.
This report is used by a corporate inventory control analyst to have visibility into stock order shipments that are either
Past their receipt date and have not been closed due to mismatches between the shipped and received quantities or;
Shipped but not yet received despite being past their date of delivery
The number of days beyond the expected receipt date after which the shipments will appear in this report can be configured. The number of such stock orders will be summarized on the report tile. The tile will be flagged green, yellow or red as an indicator of criticality. The criteria governing tile criticality takes account of two parameters; an acceptable processing delay in days and a threshold number of stock orders, both of which can be defined through configuration. Clicking on the tile will display the details of these stock order shipments in a tabular format. The table menu provides the Inventory Control Analyst with the Actions to reconcile selected shipments directly from the dashboard or view the stock order shipments for further analysis or launch the Order Reconciliation screen for the stock order where reconciliation can be performed.
This report consists of a clickable tile and a table that shows the details of the stock orders.
Tile
The number of stock orders that fit the criteria for appearing in the report will be summarized on the clickable report tile.
The color of the tile changes colors to reflect the severity. The rules for this are defined in the table below.
| Tile Color | Rule |
|---|---|
| Green | None of the stock orders pending closure are 7 days past the receipt date plus Past Receipt Date days and
The number of stock orders in the report are less than the threshold value specified in the Stock Order Critical Count configuration. |
| Yellow | Any of the stock orders pending closure are 7 days past the receipt date plus Past Receipt Date days or
The number of stock orders in the report is greater than or equal to the Stock Order Critical Count configuration. |
| Red | Any of the stock orders pending closure are 7 days past the receipt date plus Past Receipt Date days and
The number of stock orders in the report is greater than or equal to the Stock Order Critical Count configuration. |
Table
Clicking on the tile will display the details of these stock orders in a tabular format. The details displayed are described below:
| Column | Description |
|---|---|
| Stock Order | ID for the transfer or allocation; this is also a hyperlink that will open the Stock Order Reconciliation screen with search auto executed for that particular stock order. |
| Shipment | ID of the shipment; this is also a hyperlink, when clicked, it will open the Shipment search screen in-context with the search auto executed for particular shipment. |
| Type | Transfer or Allocation |
| From Location Type | Type of the source location - Store or Warehouse. |
| From Location | Source location ID |
| From Location Name | Source location name |
| To Location Type | Type of the destination location - Store or Warehouse |
| To Location | Destination location ID |
| To Location Name | Name of destination location |
| Finisher | Finisher ID on the transfer, if applicable. |
| Finisher Name | Finisher's name, if applicable. |
| Receipt Date | Date of the last receipt associated with the stock order. |
| Multiple UOM | Indicates whether the quantities represent a mix of units of measure. |
| % Received | Percentage of the stock order that has been received. Calculated as (receipt quantity/stock order quantity) * 100 |
| Quantity to be Reconciled | Difference between shipped quantity and received quantity. |
| Stock Order Quantity | Total quantity transferred or allocated for the stock order. |
| Shipped Quantity | Total quantity shipped on the stock order. |
| Received Quantity | Total quantity received on the stock order. |
| Cancelled Quantity | Total quantity that has been cancelled on the stock order. |
| Shipment Status | Status of the shipment. |
| Shipped Date | The date shipment was shipped |
| Days Since Shipment | The number of days since the shipment date |
View BOL Shipments - Selecting this option in the Action menu, or clicking on the Shipment ID hyperlink, opens the Shipment search screen in-context with the search auto-executed for a particular shipment and allows the inventory control analyst to access to shipments linked to the stock order. The action is enabled only when a single row is selected in the table.
Reconcile Stock Order - Clicking this option in the Actions menu, or clicking the Stock ID hyperlink, launches the Stock Order Reconciliation screen with search auto-executed for that particular stock order to manually reconcile mismatches between the quantity shipped and the quantity received for the selected transfer or allocation. This action is enabled only when a single row is selected in the table.
Reconcile Shipment - Clicking the Reconcile button on the toolbar or selecting this option in the Actions menu will open the 'Reconcile Shipment' popup where, in the Adjustment Type field, you can select the Adjustment Type (Freight Claim, Forced Receipt, Receiving Location or Shipping Location). Clicking the OK button on this popup will reconcile selected rows with the specified adjustment type.
The following values related to this report can be configured in the Report Options screen:
Past Receipt Date - Number of days past the receipt date that the stock order shipments are considered for inclusion in this report.
Stock Order Critical Count - For tiles, users can configure the threshold number of stock orders shown in the report past which the tile turns critical.
This report is used by the corporate inventory control analyst for visibility to stock count locations from which physical counts have not been received Past Count Date Days after the count date for both Unit and Unit and Value type counts.
This report consists of a clickable tile and a table that shows the details of the stock counts that are missing results.
Tile
The number of stock counts that fit this criteria will be summarized on the clickable report tile.
The color of the tile changes colors to reflect the severity. The rules for this are defined in the table below.
| Tile Color | Rule |
|---|---|
| Green | All counts in the report occurred less than 7 days + Past Count Date Days ago and
The number of counts in the report is less than or equal to the Stock Count Location Exception Count configuration. |
| Yellow | One or more counts in the report occurred more than to 7 days + Past Count Date Days ago or
The number of counts in the report is greater than the Stock Count Location Exception Count configuration. |
| Red | One or more counts in the report occurred more than to 7 days + Past Count Date Days ago and
The number of counts in the report is greater than the Stock Count Location Exception Count configuration. |
Table
The details about the counts that are missing are displayed in the table, including these data points:
| Column | Description |
|---|---|
| Stock Count | Stock Count ID; hyperlinked to access the Stock Count Request Screen in edit or view mode based on user privileges. |
| Stock Count Description | Description of the stock count. |
| Location | ID of location that has missed reporting the count. |
| Location Type | Type of location - Store or Warehouse. |
| Location Name | Name of location. |
| Count Date | Date the count occurred. |
View Stock Count Request - selecting this option from the Action menu by clicking the stock count hyperlink will open the Stock Count Request screen for the selected count in view or edit mode. This action is enabled only when a single row is selected in the table.
Delete - clicking the Delete iconic button or selecting Delete from the Actions menu allows the inventory control analyst to delete the location from the count. This may be chosen if it is determined that the count location's results are unusable or the count didn't occur. It is enabled when either single or multiple rows are selected in the table. Exercising this action deletes the selected locations from the stock counts.
The following values related to this report can be configured in the Report Options screen:
Stock Count Location Exception Count - Defines the number of locations missing above which the tile should be accorded criticality.
Past Count Date Days - Represents the number of days after the stock count date post which the count should be reported as missing if no physical count data is available.
This report is used by the corporate inventory control analyst to have visibility into Unit and Unit & Value stock counts that have a unit variance that is greater than a system defined tolerance. The number of stock counts with exceeding variances will be displayed on the report tile. The color will be set to green, yellow or red reflecting different levels of criticality based on the number of stock counts exceeding the tolerance and the existence of counts with variances are unresolved for more than a week after the count date. Clicking on the tile will display the details of these stock counts in a tabular format. The table menu provides the Inventory Controller options to view the unit variances and to accept or update the count results.
The report consists of a clickable tile and a table with a bar chart that shows the stock counts with a unit variance outside of tolerance.
Tile
The number of stock counts that fit this criteria will be summarized on the clickable report tile.
The color of the tile changes colors to reflect the severity. The rules for this are defined in the table below.
| Tile Color | Rule |
|---|---|
| Green | All of the stock count/locations in the report occurred on or less than 7 days ago and
The count of stock count/locations in the report are less than or equal to the Stock Count Location Exception Count configuration. |
| Yellow | Any of the stock count/locations in the report occurred more than 7 days ago or
The count of stock count/locations in the report exceeds the Stock Count Location Exception Count configuration. |
| Red | Any of the stock count/locations in the report occurred more than 7 days ago and
The count of stock count/locations in the report exceeds the Stock Count Location Exception Count configuration. |
Table
The details of the stock counts with variances are displayed in a table with an attached bar chart when the tile is clicked and shows the following information:
| Column | Description |
|---|---|
| Stock Count | Stock count ID |
| Stock Count Description | Stock count description |
| Location | ID of the location that reported the variance. |
| Location Name | Name of the location |
| Location Type | Type of location - Store or Warehouse |
| Count Type | Type of count - Unit or Unit & Value |
| Count Date | Date the count occurred |
| Over Variance % | Displays the variance percentage for items in the location that were over in the unit portion of the count (count quantity < snapshot quantity), calculated as:
(Count Quantity - Snapshot Quantity) /Total Snapshot Quantity * 100 for those items |
| Short Variance % | Displays the variance percentage for items in the location that were short in the unit portion of the count (count quantity < snapshot quantity), calculated as:
(Count Quantity - Snapshot Quantity) /Total Snapshot Quantity * 100 for those items |
| Total Variance % | Displays the variance percentage for all items in the location with a variance, calculated as:
(Absolute value of (Count Quantity - Snapshot Quantity)) /Total Snapshot Quantity * 100 |
| Variance % Graph | Inline bi-directional bar graph indicating over variance and short variances. Clicking on the graph displays a pop up with the following:
|
| Action | Description |
|---|---|
| Accept Results | This action allows the inventory control analyst to accept the unit portion of the count results. The action is enabled for both single and multi-row selection. |
| Update Results | This action is available when a single stock count location is selected in the table. It launches the inventory control analyst into the Stock Count Results screen for the selected count, enabling adjustments to be made to the count results reported from the store or warehouse, if needed. |
| Edit/View Unit Variance and Adjustments | This action opens the Unit Variance and Adjustments screen for the selected stock count in view or edit mode. The label reads Edit Unit Variance and Adjustments or View Unit Variance and Adjustments based on user privileges. |
The following values related to this report can be configured in the Report Options screen:
Stock Count Location Exception Count - Threshold number of locations with variances greater than the tolerance % that is allowed before flagging the tile with intermediate criticality i.e. yellow.
Variance Threshold - Represents the threshold tolerance percentage at a count-location level above which the count location should be picked up for consideration in the Stock Count Unit Variance report subject to filter criteria.
This report is used to provide visibility to items that were incidentally ranged to a location, such as from a customer return to a store. This report also shows intentionally ranged item locations that have available inventory, but is in a status other than Active.
This report consists of a clickable tile and a table displaying the details about the item/locations that are unexpected in the location.
Tile
The tile shows a total count of item/locations that have unexpected inventory.
The color of the tile changes colors to reflect the severity. The rules for this are defined in the table below.
| Tile Color | Rule |
|---|---|
| Green | The count of locations with unexpected inventory is lower than the Item Location Warning Count configuration. |
| Yellow | The count of item locations with unexpected inventory is higher than the Item Location Warning Count configuration, but lower than the Item Location Critical Count configuration. |
| Red | The count of item/locations with unexpected inventory is higher than the Item Location Critical Count configuration. |
Table
| Column | Description |
|---|---|
| Item | The item with unexpected inventory is also a hyperlink that allows the inventory control analyst to open the Item Inventory by Location screen with the Item and Location populated from the current record. |
| Item Description | Item description |
| Item Parent | Item parent ID, if applicable |
| Item Parent Description | Item parent description, if applicable |
| Location | Location ID that has unexpected inventory |
| Location Name | Name of location |
| Location Type | Type of the location - Store or Warehouse |
| Status | Item location status - Active, Inactive, Discontinued, or Deleted |
| Ranged | Indicates if the item is intentionally ranged to the location |
| On Hand | Stock on Hand for the item/location. In the case of pack components for warehouse, pack component stock on hand is also included. |
| Reserved | Total inventory reserved at the location for an outbound transfer, allocation, or RTV. This also includes any pack component inventory in these categories, as applicable, for warehouses. |
| Non Sellable | Non-sellable item inventory for the item/location |
| Unexpected Inventory | On Hand - Reserved |
| Department | ID of the department to which the item belongs to |
| Department Name | Department name |
| Class | ID of the class to which the item belongs to |
| Class Name | Class Name |
| Subclass | ID of the subclass to which the item belongs to |
| Subclass Name | Subclass Name |
| Action | Description |
|---|---|
| Update Status | This action allows users to update the status and/or the Ranged indicator for one or more item/locations selected in the table. Selecting this option opens a popup where the updates can be made. |
| View Item Inventory | This action launches the Item Inventory by Location screen with the item/location from the selected row in the table. |
| View Transaction Data | This action launches the Transaction Data screen that shows last 7 days worth of transactions for the item/location from the selected row, by default. |
| Create Transfer | This action allows the inventory control analyst to create a transfer for one or more selected rows in the report with the same location and that location is not a finisher. Selecting this option opens a Create Transfer popup with the location defaulted as the From Location. After the destination location is added in the popup, the transfer will be created defaulting the items with their unexpected inventory quantities. |
| Create RTV | This action allows the inventory control analyst to create an RTV for one or more selected records in the table with the same location and that location is not a finisher. This opens a Create Return to Vendor popup with the location defaulted. After the supplier and other details have been added in the popup, the RTV will be created defaulting the items with their unexpected inventory quantities. |
The following values related to this report can be configured in the Report Options screen:
Quantity Threshold - Only the item/locations with inventory values higher than this number of units (from zero) are shown in this report.
Warning Count - A configurable count of locations with unexpected inventory. Higher number in the report would result in related tile turning intermediate critical (yellow) in the dashboard.
Critical Count - A configurable count of locations with unexpected inventory. Higher number in the report would result in related tile turning critical (red) in the dashboard.
Include Deleted - Indicates whether item/locations in deleted status with a ranged indicator of Y should be included in this report if they have inventory.
Include Discontinued - Indicates whether item/locations in discontinued status with a ranged indicator of Y should be included in this report if they have inventory.
Include Inactive - Indicates whether item/locations in inactive status with a ranged indicator of Y should be included in this report if they have inventory.
If using Global Tax as your default tax type, it is optional to have tax setup for all items and departments in Merchandising as opposed to how it happens in case of Simple VAT. In such a case, users responsible for managing tax setup need to have visibility to tax rule coverage across items, departments and tax regions. The Tax Rules Dashboard contains reports that are intended to help users monitor and manage tax rules coverage and their lifecycle. This dashboard is intended to be used by users in Financial Analyst role in a retail organization.
The Dashboard is comprised of a set of filter criteria and reports that are refreshed based on the filter criteria.
At the top of the dashboard there is a set of filter criteria that allows the user to filter the data displayed in the various reports on this dashboard. There is no mandatory filter, so the reports will automatically be executed when the dashboard opens.
Selecting the Advanced option provides the ability to add multiples of filter criteria.
Filters available for this dashboard are:
Department
Class
Subclass
Item
Tax Region Destination
Tax Region Source
Location
To view the Tax Rules dashboard, from the task bar select Reports > Tax Rules Dashboard. The Tax Rules dashboard appears.
This report is intended to alert users to take action on the tax rules with end date approaching. Only tax rules that have an end date falling in the configurable future date range are shown in this report.
All dashboard-level filters are applicable to the report. This report displays rules that matches the filters specified, which means if the user specifies a class in the filter, only rules that have that specific class as a condition will be displayed. Rules created with higher level conditions will not be listed in this case, even if there are rules with upcoming end dates that eventually would be applied to the specified class.
This report includes a bar chart with clickable bars and a table that shows the rules with end dates based on the day or week selected in the bar chart.
Bar Chart
The bar chart for this report has clickable bars that show the count of rules with upcoming end date by day or week depending on the toggle selected. X-axis of the chart shows either end date or end of week date depending on day or week toggle selected respectively. Y-axis has count of rules. Each bar represents the count of rules with end date on Y-axis when Day toggle is selected or count of rules with end date falling in the week with EOW date depicted on Y-axis. Clicking on a bar refreshes the accompanied table listing the tax rules.
Table
The table shows details of the rules with end dates for which the bar was clicked in the day view. If in the week view, it shows all the rules with end dates falling in the particular week for which the bar is clicked. The table has the following columns:
| Column | Description |
|---|---|
| Rule | The ID of the rule. It is also a hyperlink that, when clicked, opens the Tax Rule screen in edit or view mode based on user privileges. |
| Description | This shows the rule description. |
| Status | This shows the rule status. |
| Start Date | This shows the start date of the rule. |
| End Date | This shows the end date of the rule. |
| Last Update | This shows the last date when rule was updated. |
| Last Updated by | This shows the ID of the last user that updated the rule. |
| Action | Description |
|---|---|
| Create | Clicking on the Create iconic button or selecting the Create action from the Actions menu will open the Tax Rule Creation screen in create mode. |
| Edit | Selecting the Edit action from the Actions menu or clicking on the Edit iconic button opens the Tax Rule screen for the selected tax rule in edit mode. This option is available to only users that have privileges to edit rules. |
| View | Clicking on the View iconic button or selecting View action from the Actions menu will open the Tax Rule screen for the selected rule in view mode. |
This report shows all rules that are in worksheet or submitted status and have a start date in the configurable date range defined in the Report Options screen. A user can launch the Tax Rule screen in-context to approve a particular rule shown in the report.
All dashboard-level filters are applicable to the report. This report displays rules that matches the filters specified, which means if the user specifies a class in the filter, only rules that have that specific class as a condition will be displayed. Rules created with higher level conditions will not be listed, even if there are rules pending approval that eventually would be applied to the specified class.
This report includes a bar chart with clickable bars and a table that shows the rules that are pending approval based on the day or week selected in the bar chart.
Bar Chart
The bar chart for this report has clickable bars that show the count of rules pending approval with upcoming start dates by day or week depending on the toggle selected. X-axis of the chart shows either start date or end of week date depending on day or week toggle selected. The Y-axis has a count of rules. Each bar represents the count of rules with a start date on Y-axis when the Day toggle is selected or the count of rules with its start date falling in the week depicted on Y-axis. Clicking on a bar refreshes the accompanied table listing the tax rules.
Table
The table shows the details of the rules with a start date for which the bar was clicked in the day view, or in the week view, it shows all the rules with a start date in the selected week. The table has the following columns:
| Column | Description |
|---|---|
| Rule | The rule ID; it is also a hyperlink that, when clicked opens the Tax Rule screen in edit or view mode. |
| Description | This shows the rule description. |
| Status | This shows the rule status. |
| Start Date | This shows the start date of the rule |
| End Date | This shows the end date of the rule. |
| Last Update | This shows the last date when rule was updated. |
| Last Updated by | This shows the ID of last user that updated the rule. |
| Actions | Description |
|---|---|
| Create | Clicking on the Create iconic button or selecting the Create action from the Actions menu will open the Tax Rule screen in create mode. |
| Edit | Selecting the Edit action from the Actions menu or clicking on the Edit iconic button opens the Tax Rule screen for the selected tax rule in edit mode. This option is only available to users that have privileges to edit rules. |
| View | Clicking on the View button or selecting View action from the Actions menu will open the Tax Rule screen for the selected rule in view mode. |
The following value related to this report can be configured in the Report Options screen:
Number of Weeks for Pending Approval Rules - This option is used to specify the number of weeks from the current date for tax rules that should be included in the report. Only rules that have a start date falling in this range and are either in worksheet or submitted status will be shown in the report.
This report shows tax regions, departments, and items that have no tax rules associated with them, based on the selected tile. Departments and items that are not explicitly associated with a tax rule, but qualify for a tax rule created at higher levels will not be shown in this report.
The dashboard level filters do not apply to all aspects of this report, as the tiles act as a report specific filter that overrides the dashboard level filter in some cases. For example, if you click on the Items or Departments tile, all items or departments that are missing tax rules will be displayed, regardless of the locations or tax regions entered in the dashboard level filter. Similarly, if you click on the Tax Regions tile, all tax regions that are missing setup will be displayed regardless of the dashboard level merchandise hierarchy or item filters.
However, if the user has entered a merchandise hierarchy level (or item) in the dashboard level filter, the details shown when clicking on the Departments or Items tile will be filtered by those entries. Similarly, for the Tax Region tile, the any location, or source or destination tax region entered in the filter will limit the data shown in the table as follows:
If the location entered in the dashboard filter is part of a regions that is not in any tax rule either as the source or destination tax region, it will be listed as missing tax setup.
If the source tax region in the dashboard filter is not used in any rule as the source tax region, it will be listed as missing tax setup.
If the destination tax region in the dashboard filter is not used in any rule as the destination tax region, it will be listed as missing tax setup.
This report includes three clickable tiles and a table that lists entities missing tax setup, depending on the respective tile selected.
Tile
There are three tiles showing the count of entities with no tax setup by tax region, department, or item. Clicking on a tile shows the details of the respective entity.
Table
The table will show the list of tax regions, departments, or items depending on the tile selected. When the dashboard is opened by default the table will show list of tax regions.
List of table columns when the Tax Region tile is clicked:
| Column | Description |
|---|---|
| Tax Region | This shows the tax region code. |
| Name | This shows the tax region description. |
Table
List of table columns when Department tile is clicked:
| Column | Description |
|---|---|
| Department | This shows the department ID. |
| Name | This shows the department description. |
Table
List of table columns when Items tile is clicked:
| Column | Description |
|---|---|
| Item | This shows the item ID. |
| Item Description | This shows the item description. |
| Department | This shows the department for the item. |
| Department Name | This shows the department name. |
| Class | This shows the class in the department for the item. |
| Class Name | This shows the class name. |
| Subclass | This shows the subclass in the department/class for the item. |
| Subclass Name | This shows the subclass name. |
| Status | This shows the item status. |
Footnote Legend
Footnote 1: This is defined in the RTK_ROLE_PRIVS table in RMS based on a user's application role.