| Oracle® Argus Insight User's Guide Release 8.1 E68408-01 |
|

 Previous |
 Next |
Argus Insight provides an out-of-the-box RPD for analyzing the data of aggregated reports generated through Argus Safety or BI Publisher.
|
Note: Analysis can be done on the RPD once the Argus Mart ETL has brought all the necessary data from BIP Enabled Argus Safety. |
This chapter includes the following topics:
The following components are available as part of the Argus Insight Catalog:
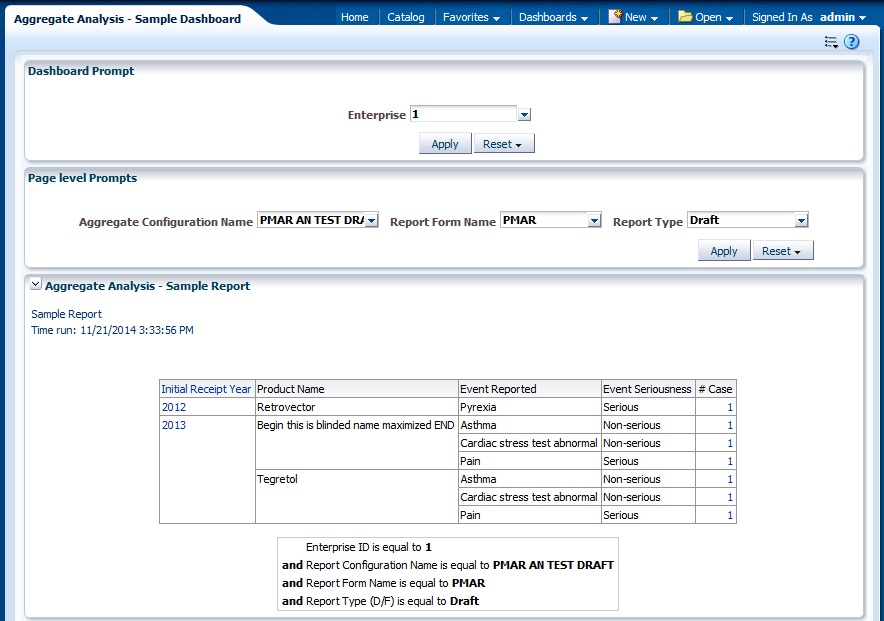
Aggregate Analysis - Sample Dashboard — Provides Dashboard and Page Level prompts, and displays data on Sample Report based on these prompts.
Dashboard Prompt — Enables selection of the Enterprise ID.
Page Prompts — Comprises three-level page prompts: Aggregate Configuration Name, Report Form Name and Report Type.
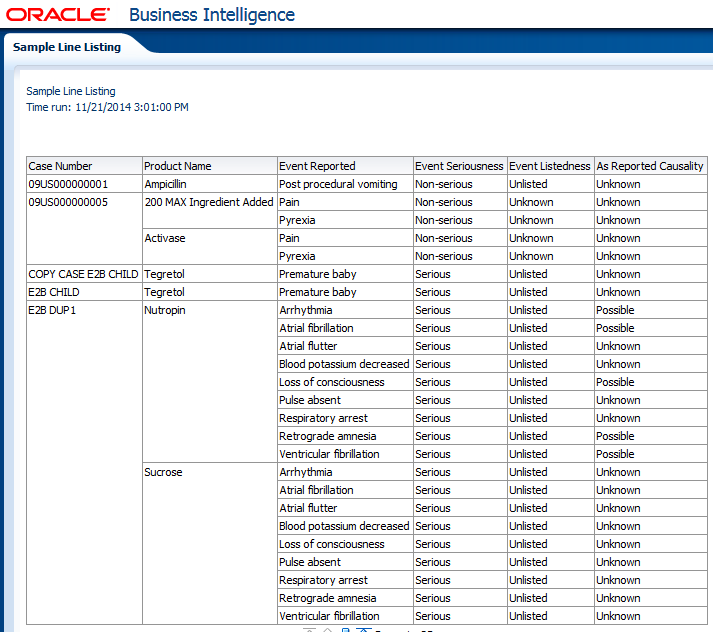
Sample Line Listing — Generates as Sample Line Listing Report comprising the following dimensions:
Case Number
Product Name
Event Reported
Event Seriousness
Event Listedness
As Reported Causality
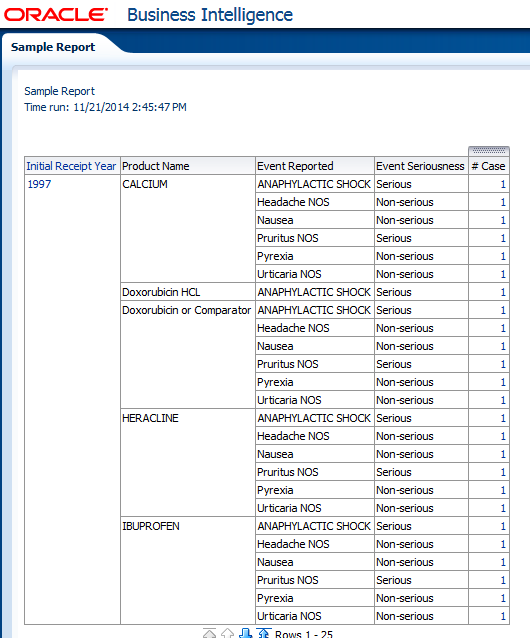
Sample Report — Generates as Sample Report comprising the following dimensions:
Initial Receipt Year
Product Name
Event Reported
Event Seriousness
Case Count
To view OBIEE Aggregate Analysis - Sample Dashboard:
From Argus Insight, navigate to Reporting > BI Answers.
The OBIEE URL is opened in a new window as configured in the Argus Insight > List Maintenance > Profile Switch. 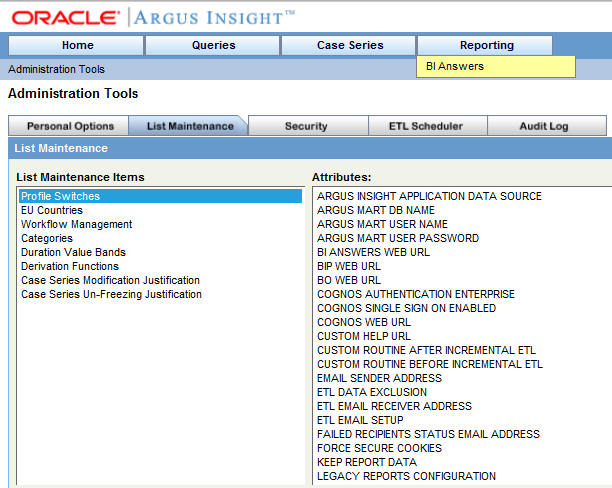
Go to Dashboard > Aggregate Analysis - Sample Dashboard.
A sample dashboard as available in Argus Insight catalog, will generate a report based on the selected prompt values.
The Sample Report displays the data based on the prompts available on the dashboard, such as:
Enterprise ID
Aggregate Configuration Name
Report Form Name
Report Type
You may drill-down based on the Case Count Dimension.
|
Note: By default, the drill-down option is available only for Sample Dashboard. For Custom Dashboards, add the drill-down option manually. |
To view the Sample Line Listing Report, click the case count.
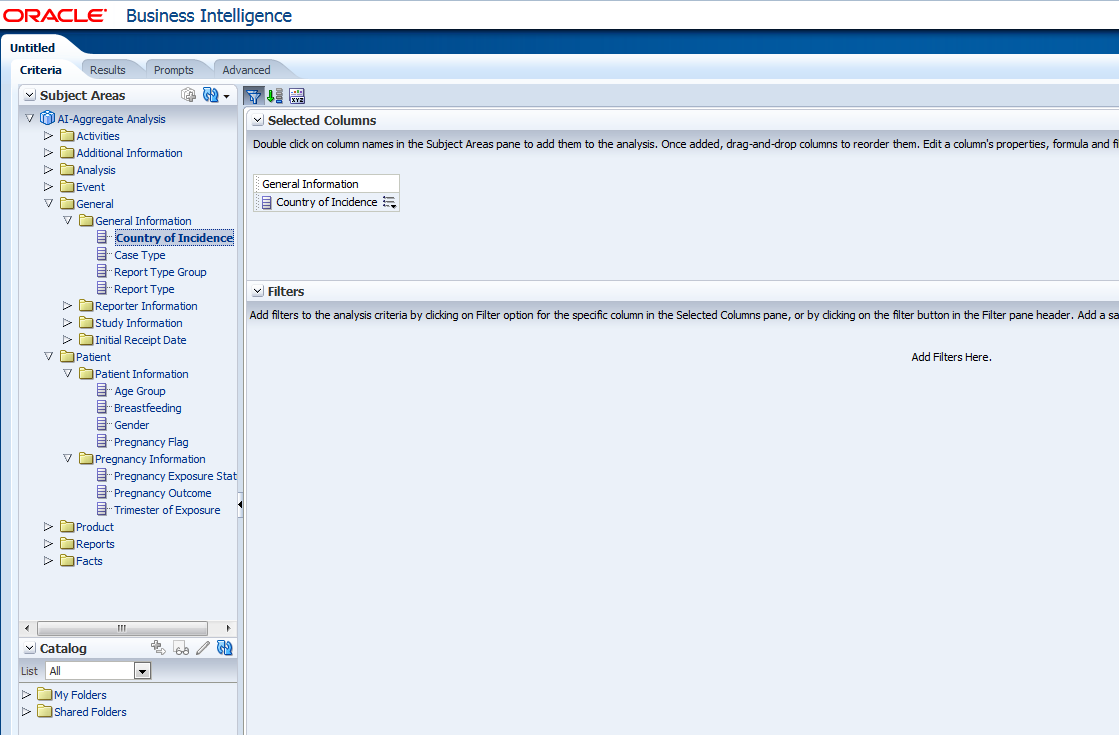
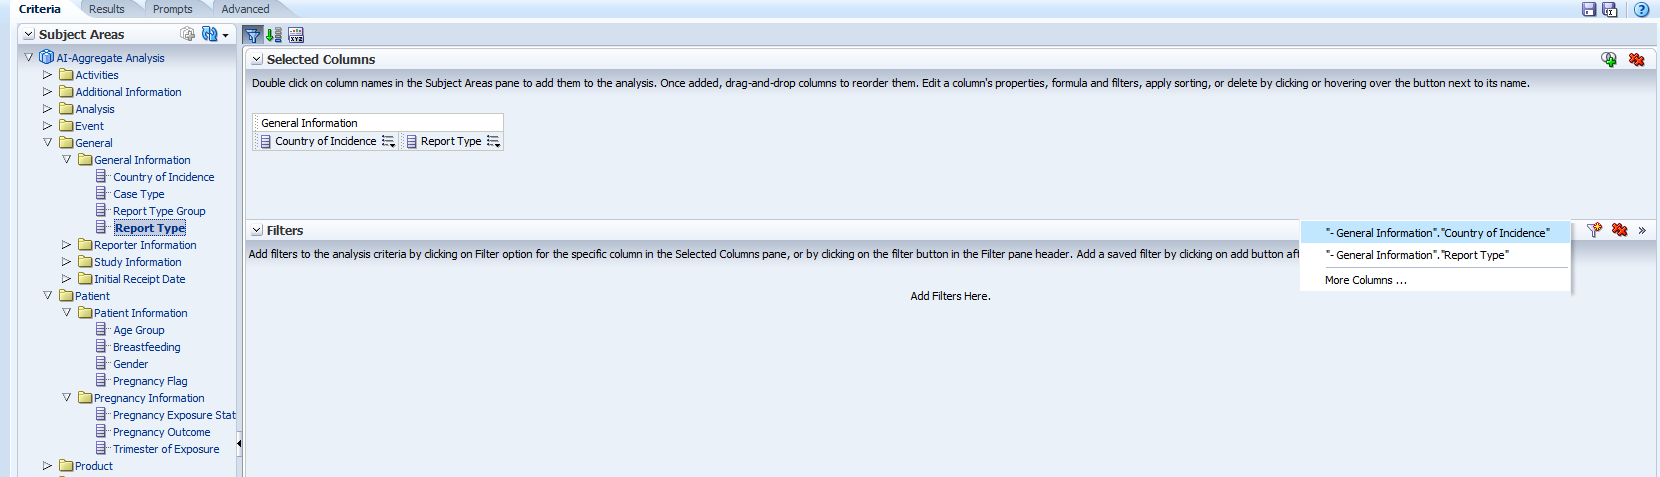
To create new Analysis or Answers, navigate to New > Analysis, and select the dimensions from the Subject Area.
The Subject Area displays all the dimensions created in the RPD.
For more information on these dimensions, refer to Oracle Argus Insight Extensibility Guide > Appendix: Dimensions and their Mapping.
To add filters in the Answers, select a dimension, and click Create a Filter.
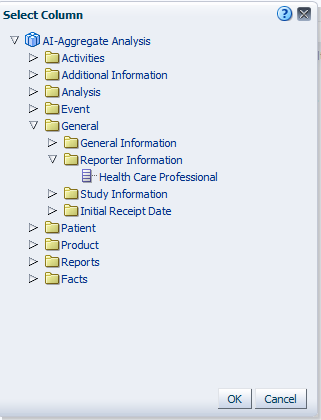
To add filter on the non-selected columns, click More Columns.
A list of all the available dimensions appears.
Go to the Results tab, to view the result of the analysis based on the dimensions and filters.
|
Note: For more information on each dimension, refer to Oracle Argus Insight Extensibility Guide > Appendix: Dimensions and Mappings.For more information on each field description, refer to Oracle Argus Safety BIP Aggregate Reporting Extensibility Guide > Appendix A: Data Model. |