Working with the Schedule Comparison Page
Use the Schedule Comparison page to compare the variances between two different versions of a project schedule. Variance information is displayed in several areas of the page, each with a distinct configuration and purpose.
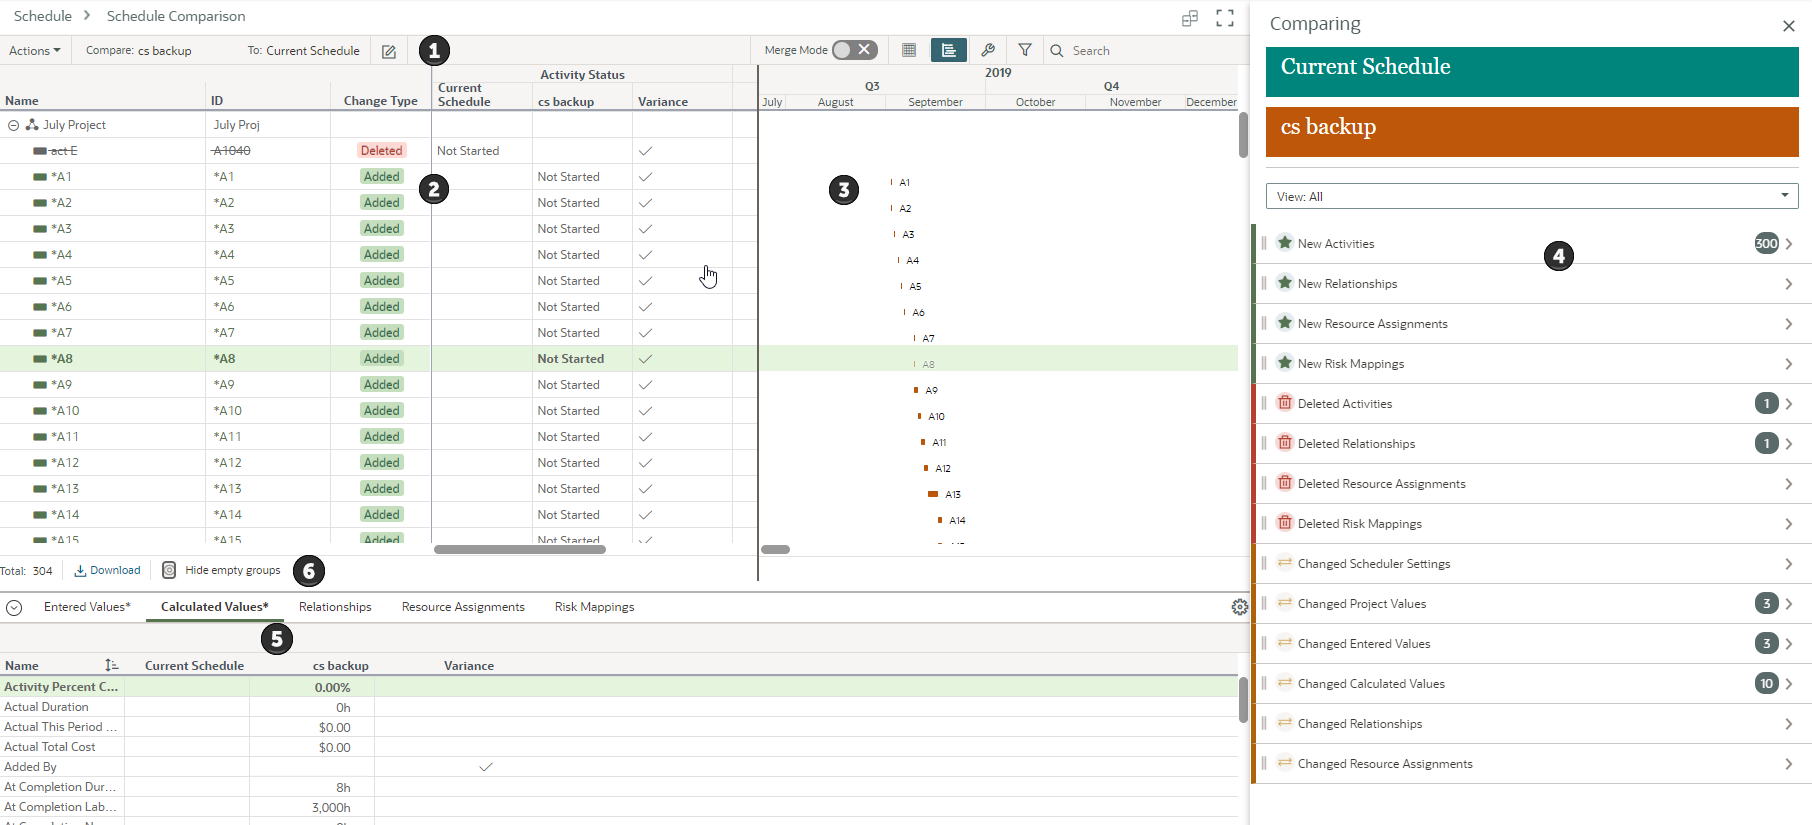
Table of Screen Highlights
Item | Description |
|---|---|
1 | Comparison Toolbar: Use the You can chose to export the comparison to a .xlsx file and work with the comparison data in the spreadsheet program of your choice. |
2 | Activity Table: The display of activities in the Activity Table and indication of change types will adjust depending on the mode. There are two possible modes for the Schedule Comparison page: Compare Mode, which is the default, and Merge Mode, which requires an additional user privilege. You can compare two schedules in either mode, but Merge Mode enables you to view only activities with variances. From this list you can select certain activities from the schedules and merge them. In Compare Mode, each row in the table contains an activity from the two schedules being compared. Activities that do not exist in the Comparison schedule, but exist in the Source schedule, are considered new and display with an asterisk and the Added label in the Change Type column. Activities that exist in the Comparison schedule, but do not exist in the Source schedule, are considered deleted and display with struck-through text and a Deleted label in the Change Type column. Activities that exist in both schedules, but have been modified in the Source schedule, display Edited in the Change Type column. In Merge Mode, each row in the table contains an activity from both schedules before they merge. Activities that do not exist in the Merge To schedule, but exist in the Merge From schedule, are considered new and display with an asterisk and the label Added in the Change Type column. These activities would be added to the combined schedule. Activities that exist in the Merge To schedule, but do not exist in the Merge From schedule, display as struck-through text and with the Deleted label in the Change Type column. These activities would be deleted from the combined schedule. Activities that exist in both schedules, but will be modified by the Merge From schedule, display with the label Edited in the Change Type column. Each column you choose to add to the table is separated into three values: the Comparison/Merge To value, the Source/Merge From value, and the variance between the two. The Comparison/Merge To schedule column displays before the Source/Merge From schedule so that you can easily note the changes between the two. When activity date indicators are enabled, an indicator for actual start dates, actual finish dates, and constraints are displayed in the Activity Table. Variances for numerical fields show numerical values. If there is no variance, the cell value is zero. Variances for non-numerical fields show a check mark. If there is no variance, the cell is blank. Variance cell values for new or deleted activities are also blank. You can toggle between modes without losing schedule selections. Note Name, ID, and Change Type columns are pinned. |
3 | Gantt Chart: The Gantt chart shows activity bars for the two schedules being compared. Each bar represents an activity's start date, finish date, and duration. Relationship lines are shown for the Source/Merge From schedule's activities. |
4 | Schedule Variance Analysis panel: Configure and display added, deleted, or changed values for all fields across the project. Categories in the panel include activities, activity-related objects, activity values, project values, and scheduler settings. The number displayed for each category in the panel represents the total number of items that meet that category's criteria. Drill down into a category to view data for individual items. Some items provide editable thresholds so you can focus on more significant changes to the schedule. |
5 | Detail Windows: View all modified field values for the selected activity. If a value in the schedule is not new, deleted, or changed, it will not appear in a detail window. Detail windows that contain updated values are displayed with an asterisk in the tab title. The detail windows are separated into the following categories:
|
6 | Download: Select this option to download a spreadsheet containing Activities List data. Show/Hide empty groups: Toggle to automatically show or hide grouping bands that do not have any data. |
Last Published Monday, June 22, 2026