Working with Measures
Measures are configured metrics used to monitor the health and status of a portfolio, strategy, program, or project. Measures can be created using aggregates of object attributes, by using existing measures, or set for manual entry. Object attributes and existing measures cannot be used in the same expression for a measure.
Measures have two dimensions: actual and target. A target value can optionally be defined to use when setting thresholds for the measure. Thresholds and indicators are defined to visually represent the status of a measure.
Use the workspace Measures dictionary to create portfolio and strategy measures, the Program Defaults & Options page to create program measures, and the Project Defaults & Options page to create project measures. See Measures Overview for more information.
For information on creating advanced formulas to set values for configured fields and measures, refer to the Oracle Primavera Cloud Expression Language Guide on Oracle Help Center.
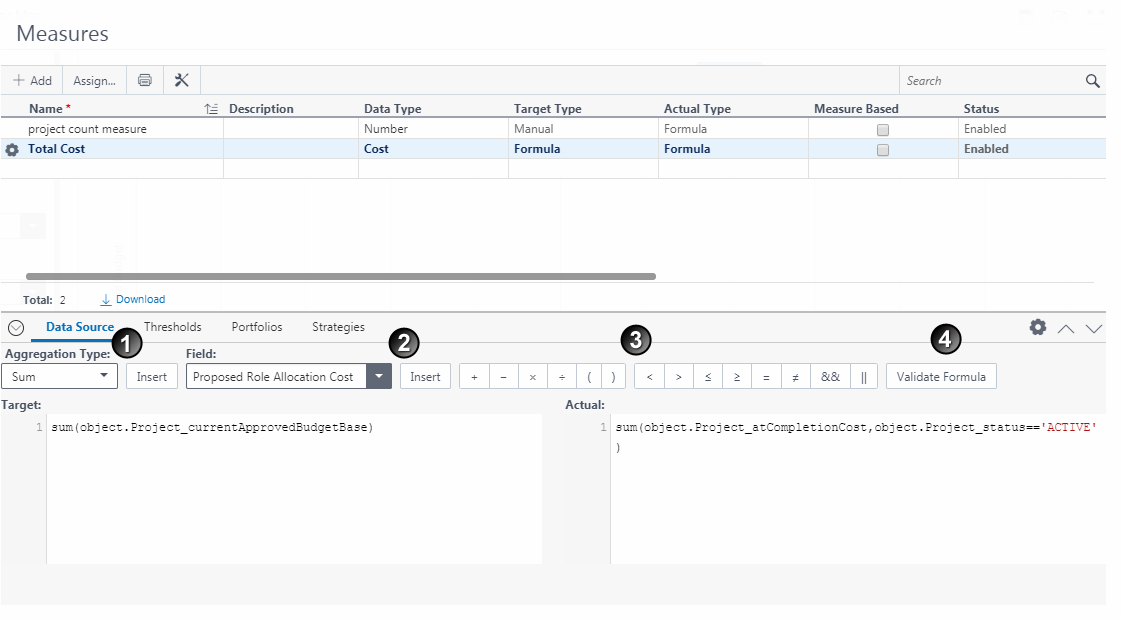
Table of Screen Highlights
Item | Description |
|---|---|
1 | Aggregation Type: Provides a template for formulas that use Sum, Min, Max, Count, and Average equations. Select the Aggregation Type, and select Insert. For example, the Sum template displays the following: sum(< Field >,< Filter >) Replace <Field> with the name of the field to be summed. Optionally, replace <Filter> with a field that will filter the results by. Add any additional filter requirements using the mathematical symbols provided. |
2 | Field: Provides all the fields that can be used in formulas. If Measure Based is selected, only existing measures display. Select Referenced Measures in the Field list to view measures that are currently assigned to Portfolios or Strategies. Select either the actual or target value for the measure. Select a field name, and select Insert. The proper formatting for the field displays. |
3 | Mathematical Symbols: Used when defining formulas manually or when using the aggregation type template. |
4 | Validate Formula: Verifies the formula works. |
The following table provides examples of formulas that can be created. Total Cost is represented in the preceding image.
Table of Measure Examples
Measure Name | Data Type | Target | Actual | Base Expression (Actual) |
|---|---|---|---|---|
Total Cost | Cost | sum(object.Project_currentApprovedBudgetBase) | sum(object.Project_atCompletionCost, object.Project_status=='Active') |
|
Projects on Time | Percentage |
| count(object.ProjectCode_Code, object.Project_scheduleVariance<10) | count(object.ProjectCode_Code) |
Cost/ROI Ratio | Number |
| object.'PortfolioMeasure_Total Cost'/object.'PortfolioMeasure_Return on Investment' Note This expression is Measure Based. |
|
Project Count | Number |
| count(object.ProjectCode_Code,object.Project_status=='Active') |
|
Return on Investment | Number |
| average(object.Project_returnInvestment) |
|
Net ROI | Number |
| 0.25*Portfolios.get("Consulting","Consulting Portfolio").'PortfolioMeasure_ROI' + 0.50*Portfolios.get("E&C","E&C Portfolio").'PortfolioMeasure_ROI' + 0.50*Portfolios.get("Energy","Energy Portfolio").'PortfolioMeasure_ROI' Note: This expression is Measure Based and references measures from other portfolios. |
|
Defining Thresholds
The following image provides an example of thresholds that can be set for the Total Cost example. These thresholds are used to determine how status for the measure is visually represented on pages where it is displayed.
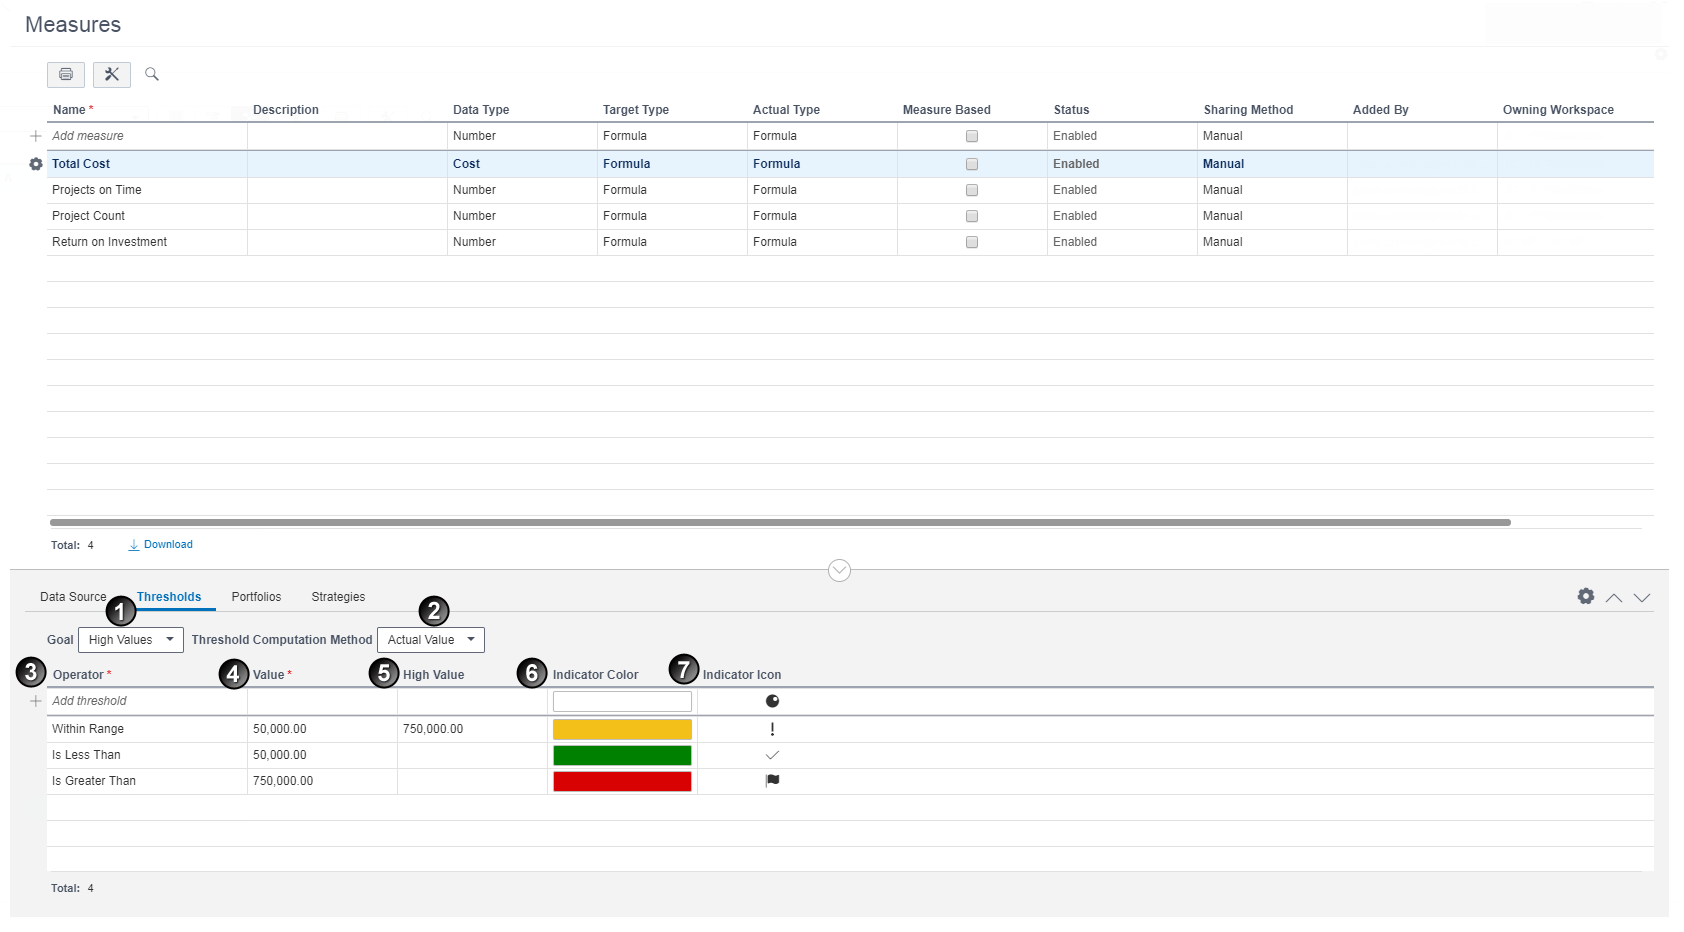
Table of Screen Highlights
Item | Description |
|---|---|
1 | Goal: Determines whether a high or low value indicates a positive change in the measure. |
2 | Threshold Computation Method: Determines how thresholds are calculated using Actual and Target values.
|
3 | Operator: The operators necessary for comparing values in the thresholds. |
4 | Value: The values the operators use for comparison. |
5 | High Value: The top of the range when the operator is set to Within Range or Not Within Range. |
6 | Indicator Color: The color to visually represent status when the threshold is met. |
7 | Indicator Icon: The icon to visually represent status when the threshold is met. |