Understanding Budget Scenario Optimization Results
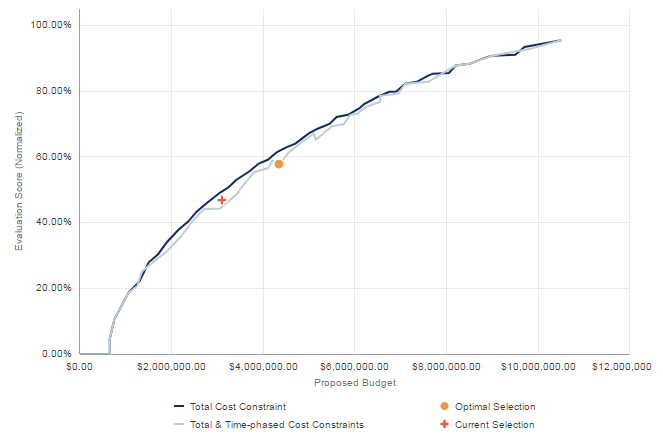
The Optimization tool plots an Efficient Frontier chart that shows possible project selection scenarios in terms of total project cost and value. A point on the Efficient Frontier represents the optimal project selection for the input cost constraints - primary and secondary objective values for the minimal total cost value. Two Efficient Frontier lines are drawn to connect the points plotted in the chart:
- Total Cost Constraint: This line connects all plot points that consider the lump-sum cost constraint value only.
- Total Cost & Time-phased Constraints: This line connects all plot points that consider the lump-sum cost constraint and time-phased cost constraint values.
The following example may help you to understand the different results generated by the Optimization tool.
Selection Points
The Optimal Selection point represents the total cost value and total objective values of the optimal set of projects selected by the tool. If you manually select any projects, a Current Selection point is plotted to represent the total cost value and total objective values of the manual selection.
The position of the Current Selection point in the chart is determined by one of the following cases:
- Below both lines: The current selection is not optimal.
- On the inner line: When manually selecting projects, only the total cost constraint value is considered. A current selection point on the inner line does not necessarily indicate an optimal selection.
- Between the lines: The current selection meets the total time constraint value, but does not meet one or more time-phased constraint values.
- On the outer line: The current selection is optimal, considering only the total cost constraint value.
- Above both lines: The State of a project has been changed since last optimization, or project dependencies have been modified. The Optimization points were plotted using outdated information. Optimization should be run again.
When using funds as constraints, the Optimal Selection point may lie below both lines if there are allocation rules defined for at least one fund. If no allocation rules are present, the Optimal Selection point will lie on the Efficient Frontier.
Line Kinks
A "kink" in an Efficient Frontier line indicates that the total value decreased as the total cost increased from one set of selected projects to the next. The Optimization tool plots points on the chart that represent total objective and total cost values for different selections of projects. One selection of projects will have a specific total cost and specific total value, which is plotted as a point on the chart. It is possible that a different selection of projects with a higher cost but lower value may be plotted as the next point in the chart. This scenario is depicted in the chart above in the Total & Time-phased Cost Constraints line between the $4,000,000.00 and $6,000,000.00 axis lines. Kinks may be present if time-phased constraints are entered. If only a total cost constraint is entered, kinks would not be observed.
Line Shifts
Line shifts have two possible causes. A horizontal shift occurs when one or more projects have Forced In states. The minimum total cost value represents the sum total cost of all forced in projects at the time of optimization. There can be no project selection solution with a total cost less than this value. A vertical shift occurs when one or more projects have Forced Out states. When projects are forced out, the upper limit of either constraint line cannot reach 100% of the objective value.
Optimization Recommendation Cases
Note Recommendations are not generated when using funds as constraints.
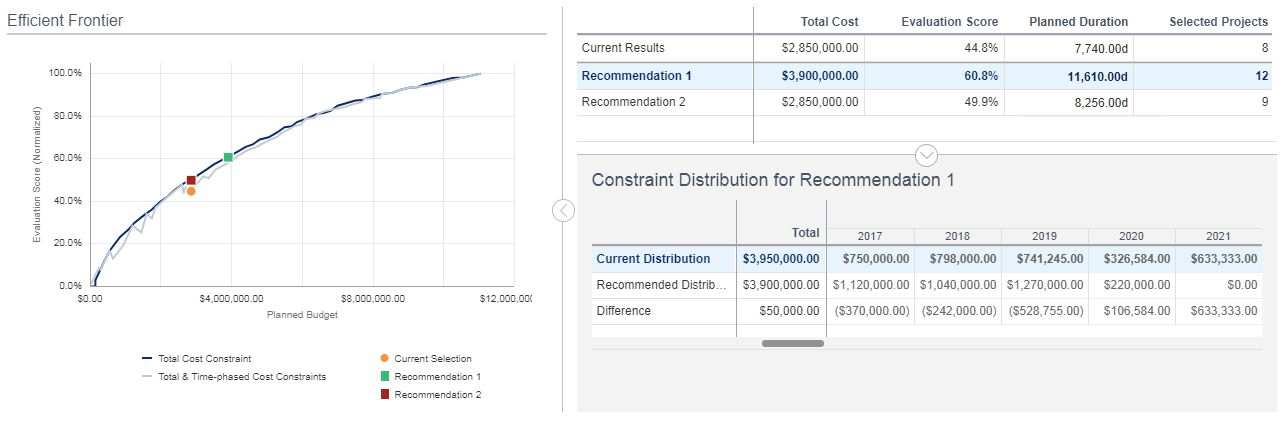
The Optimization tool may recommend up to two alternative cost distribution solutions that achieve better objective values than your current selection. In the Recommendations dialog box on the Budget Planning page, you can compare the total and time-phased cost constraint values and objective values of each recommendation with your current selection.
The top table in the graphic above contains total cost values, primary and secondary objective values, and the number of selected projects in the current results and one or both recommended selection of projects. The Total Cost column refers to the total cost value of the current and recommended solutions for the constraint field you selected during optimization. These values are created during the optimization process.
The Constraint Distribution detail window in the bottom of the graphic lists the total and time-phased constraint values that you entered during the optimization process, the total cost and time-phased constraint values suggested for the selected recommendation, and the difference in values for each column.
The following examples explain the different cases in which a recommendation is generated:
Better Objective Values Can Be Achieved at Same Total Constraint Cost
Recommendation 1 shows that a higher Evaluation Score can be achieved at the same Total Constraint Cost as the Current Results when the time-phased constraint values are redistributed. A better objective value may be possible for a primary objective, for either the primary or secondary objective when both are set to maximize, or for either the primary objective set to maximize or the secondary objective set to minimize.
Better Objective Values Can Be Achieved at Same Total Project Cost
Recommendation 2 shows that a higher Evaluation Score can be achieved at the same Total Cost as the Current Results when the time-phased constraint values are redistributed. A better objective value may be possible for a primary objective, for either the primary or secondary objective when both are set to maximize, or for either the primary objective set to maximize or the secondary objective set to minimize.
Better Objective Values Can Be Achieved at Lower Total Project Cost
An optimized project solution plotted on a "kink" may occur when the time-phased constraint values yield a lower objective value. In this case, a recommendation may be generated that achieves better objective values at a lower cost than the optimized solution. This case would be covered by Recommendation 2.
Same Objective Value Can Be Achieved at Lower Total Project Cost
A recommendation may be generated if the same primary or secondary objective value can be achieved at a lower project cost. This case would be covered by Recommendation 2.
Fund Allocation Results
When using portfolio funds as constraints for Optimization, the tool generates the optimal selection of projects that meet all fund requirements. Funds are automatically assigned to the selected projects, with total and time-phased fund values allocated to the funds in a specific order. The tool is designed to completely allocate all the money in a fund before assigning another fund. If there are restricted funds with allocation rules defined, the tool allocates all of the money in the restricted funds before looking for money from unrestricted funds, if applicable. The assignment process selects funds in the order in which the funds were created.