Working with the Resource Scenario Optimization Tool
Use the Optimization tool on the Resource Planning page to generate an optimal selection of projects under role availability constraints. Specify objective values, an amount of allowable overallocation, and a planning horizon period, and then run the optimization to view the optimal selection.
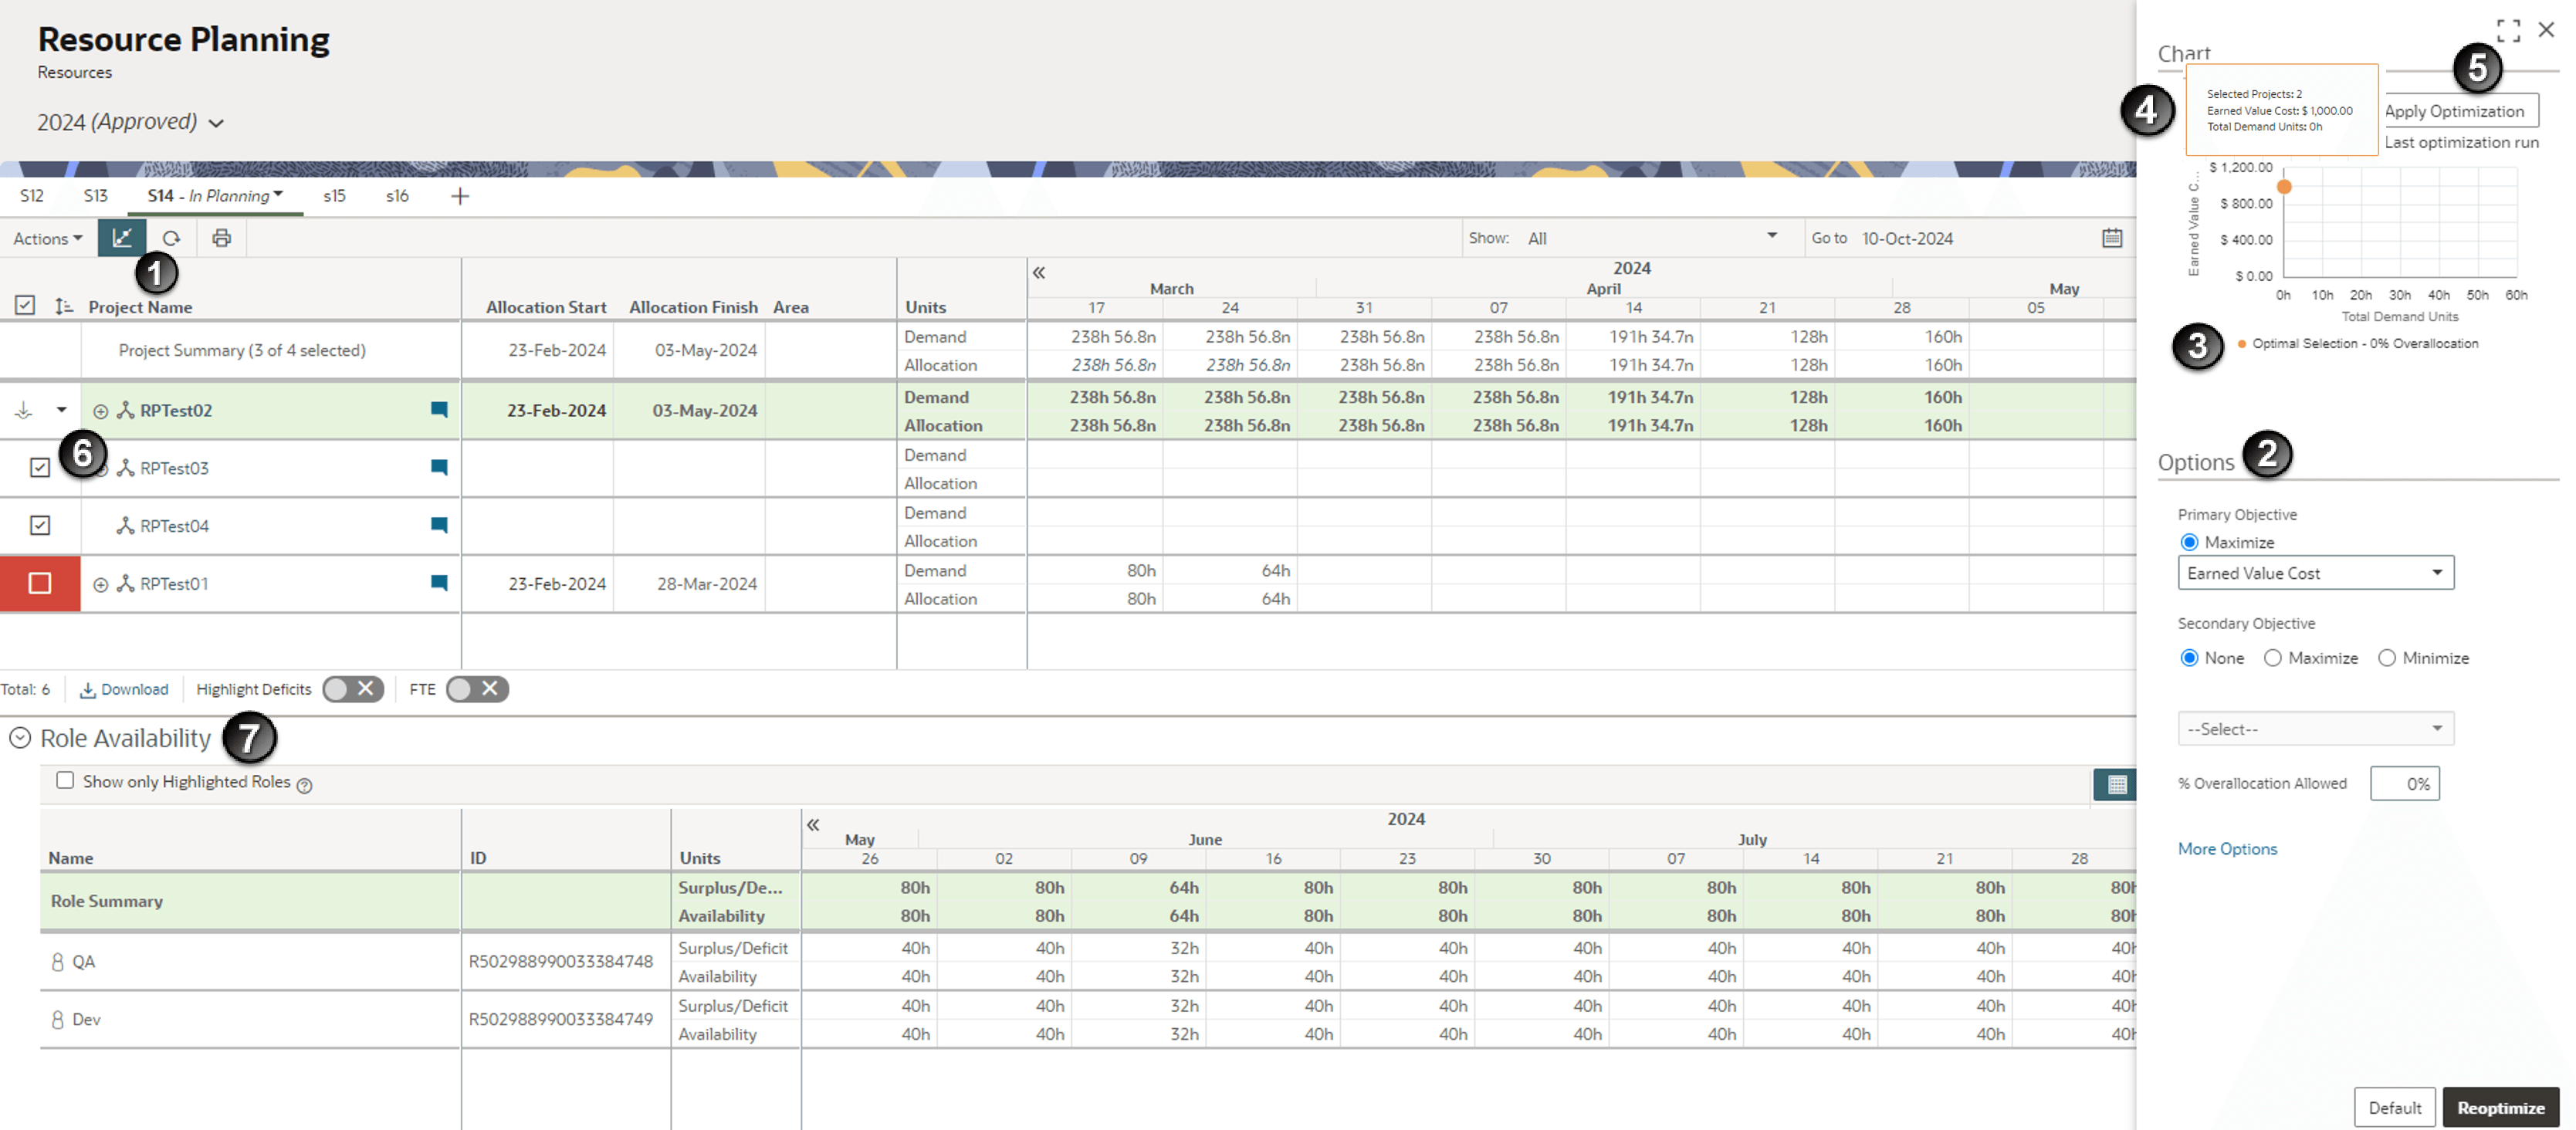
Table of Screen Highlights
Item | Description |
|---|---|
1 | Scenario Optimization: Select the Scenario Optimization button to open the scenario optimization panel on the Resource Planning page. |
2 | Options: Select a primary objective field whose value you want to maximize. Optionally, maximize or minimize a secondary objective field value to further refine optimization results. Specify % Overallocation Allowed to run optimization with increased role availability values. In the More Options dialog box, choose to run optimization against role demand or role allocation. Constrain calculations to a specific period of time by selecting planning horizon start and finish dates. |
3 | Selection Points: The Optimal Selection - 0% Overallocation point represents the optimal selection of projects that achieves your objectives without overallocating your roles. A second point is plotted if you input a value in the % Overallocation Allowed field. This point represents the optimal selection of projects if role availability values are increased by the given percentage. If you manually select any projects, a Current Selection point is plotted to represent the unit and objective values of the projects in the manual selection. |
4 | Selection Details: Hover over the Optimal Selection - 0% Overallocation point in the chart to view the number of selected projects in the solution, the values of the chosen objective fields, and the total number of demand or allocation units in the selection. If an additional point was plotted for allowable overallocation, hover over the point to view the additional number of demand or allocation units necessary to achieve the increased objective values. |
5 | Apply Optimization: Select Apply Optimization to apply the optimized project selection scenario. |
6 | Selected Projects: After applying optimization, the State field contains a check mark for projects that have been selected, red for projects that have been deselected, and not highlighted for projects whose state did not change. |
7 | Role Availability: Use the detail window to view cumulative role data for all projects in the portfolio, a surplus/deficit chart to measure over- and under-allocations, and a stacked histogram to view selected role data by project. |