Understanding Risk Scoring
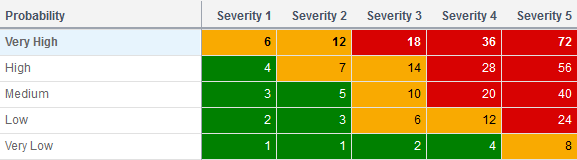
A risk's score is derived from the probability and impact values assigned to the risk. Probability and impact thresholds combine to form a risk matrix, which indicates the possible scores a risk can have. Each risk matrix contains a probability threshold, cost impact threshold, schedule impact threshold, and an optional user impact threshold. A sample risk matrix is shown below:

Probability threshold values are listed as rows. Impact thresholds are listed as columns. Each risk score marks an intersection in the risk matrix between a probability value and the overall impact value. The overall impact value is calculated based upon the scoring method assigned to the risk matrix. In the matrix settings, you can choose from one of the following two methods:
- Highest Impact: The overall impact for a risk is set to the highest of all the impacts assigned to the risk.
- Average Impact: The overall impact is determined by calculating the average of all impact values.
It is important to note that different risk matrixes can be the same size and have the same risk scores, but consist of separate risk thresholds with different sets of values. For example, a Medium impact in a risk matrix for a smaller project may represent a range of 10 to 20 days. A Medium impact in a matrix for a large project may represent a range of 100 to 200 days. Risk scores enable you to rank risks based on severity, and the values themselves do not indicate a standard period of time or cost. You can use a program risk matrix to compare risk scores across projects with different risk matrixes. This is described in Example 2.
For more information on risk threshold creation, see Risk Thresholds Overview. For more information on risk matrix creation, see Risk Matrixes Overview.
The following examples demonstrate the calculation of project risk scores and program risk scores using the two scoring methods.
Example 1: Project Risk Scoring
In this example, we will examine how a project risk score is calculated.
The JFK Airport Terminal 1 - Retail Space project is a retail space construction project for which several risks have been identified and added to the project risk register, shown below. For each risk, a risk score is calculated based upon the probability and impact values and the assigned risk matrix. The assigned matrix uses the Highest Impact scoring method to calculate risk scores.
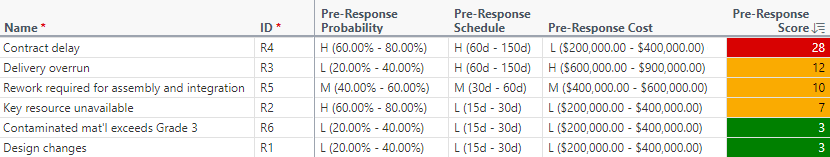
Using the project and the sample risk matrix as a reference, review the following table to understand how the score was calculated for risk R4: Contract delay and how the score changes depending on the risk scoring method assigned to the risk matrix.
When determining the impact value, each impact threshold level is given a numeric value. The possible impact threshold levels in the project are given the following risk matrix values: (None= Severity 0; VL= Severity 1; L=Severity 2; M=Severity 3; H=Severity 4; VH=Severity 5).
Method | Calculation Details | Score |
|---|---|---|
Highest Impact | The probability of risk R4: Contract delay occurring is H (60.00% - 80.00%). The highest impact for the risk is the schedule impact, which is marked as H (60d - 150d). H is equivalent to Severity 4 in the risk matrix. The cell in the risk matrix where a Severity 4 impact and a High probability intersect gives a risk score of 28. | 28 |
Average Impact | The schedule impact for the risk is H (60d - 150d), which is equivalent to a Severity 4. The cost impact for the risk is L ($200,000.00 - $400,000.00), which is equivalent to a Severity 2. The average of a Severity 4 impact and a Severity 2 impact equals 3. The cell in the risk matrix where a Severity 3 impact and a High probability intersect gives a risk score of 14. | 14 |
Project Impact Thresholds
Probability thresholds are defined as percentages that measure the likelihood of a risk occurring. Schedule impact thresholds can be defined in terms of duration or as a percentage of the project's planned duration. Cost impact thresholds can be defined in terms of currency or as a percentage of the project's planned cost. Thresholds defined using percentages are called relative thresholds. Relative schedule thresholds and relative cost thresholds are useful in the early stages of your project when you are still determining specific project values, but they cannot be used for quantitative risk analysis. User thresholds use text-based values to measure user-defined impacts, such as safety or environmental impact. All threshold types can be used to define project risk scores.
Example 2: Program Risk Scoring
In this example, we will examine the same risk from Example 1, R4: Contract delay, to understand how a program risk matrix can be applied to project risks to generate a normalized set of risk scores.
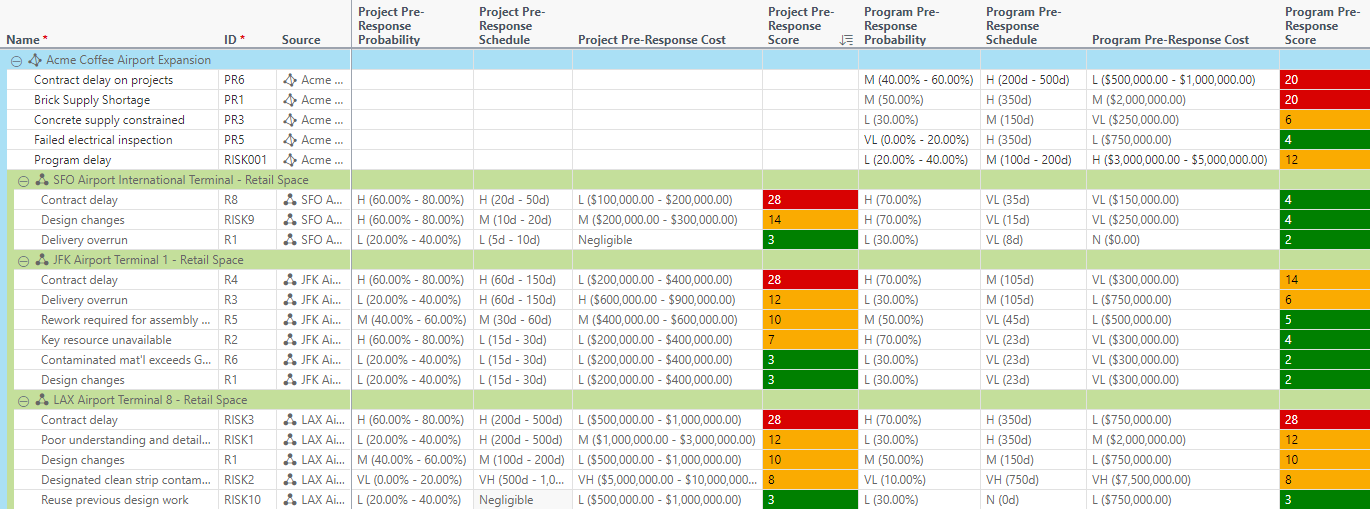
The Acme Coffee Airport Expansion program risk register depicted below contains three related projects focused on retail space construction in various airports. The program includes the project used in the previous example, JFK Airport Terminal 1 - Retail Space. The program risk register contains a list of risks that either directly impact the program or may impact multiple projects within a program. The register also includes risks from projects that belong to the program.
Program risk scores and project risk scores are both available at the program level. Program risk scores are calculated based on the risk assigned probability and impact values and the program risk matrix assigned to the program. Project risks may be given two scores, depending on the thresholds assigned to the project risk matrix. The first score uses the thresholds and values associated with the project's assigned matrix. This is the same score that is visible in the project risk register. The second score uses the thresholds and values associated with the program risk matrix. Each project in the program may be assigned a different risk matrix with different values and thresholds. Applying program risk matrix values to your projects' risks enables you to compare risk scores from different projects using a consistent and normalized scale. It also enables comparison between project risks and program risks.
The risk matrix below is assigned to the program. It uses the Highest Impact scoring method to calculate the program risk scores shown in the program risk register. You will notice that this program matrix contains the same possible risk scores as the matrix used in the project risk scoring example. However, the threshold values associated with the program matrix represent durations and costs on a larger scale.
Using the sample program risk matrix as a reference, review the following table to understand how the program score was calculated for project risk R4: Contract delay and how the score changes depending on the risk scoring method assigned to the risk matrix.
Before a score can be calculated, the project risk's threshold values must be converted using the program risk matrix thresholds. For each project risk threshold, the average value is taken and compared to the corresponding program threshold. The level where the value falls on the program threshold is the converted value's new threshold level. For example, the average of the project schedule impact threshold value H (60d - 150d) is 105d. When applied to the program schedule impact threshold, the value falls in the Medium impact level. The converted value and its threshold level, M (105d), is displayed in the program schedule impact threshold for the same risk.
Like the project risk matrix in Example 1, the following numeric values are given to the possible impact thresholds: (None= Severity 0; VL= Severity 1; L=Severity 2; M=Severity 3; H=Severity 4; VH=Severity 5). Using the converted threshold values, the following program risk scores are possible:
Method | Calculation Details | Score |
|---|---|---|
Highest Impact | The probability of risk R4: Contract delay occurring is H (70.00%). The highest impact for the risk is the schedule impact, which is marked as M (105d). M is equivalent to Severity 3 in the program risk matrix. The cell in the program risk matrix where a Severity 3 impact and a High probability intersect gives a risk score of 14. | 14 |
Average Impact | The schedule impact for the risk is M (105d), which is equivalent to a Severity 3. The cost impact for the risk is VL ($300,000.00), which is equivalent to a Severity 1. The average of a Severity 3 impact and a Severity 1 impact equals 2. The cell in the risk matrix where a Severity 2 impact and a High probability intersect gives a risk score of 7. | 7 |
Program Impact Thresholds
Program risk matrixes support the use of probability, schedule, cost, and user thresholds for both program risks and converted project risks. However, relative schedule thresholds and relative cost thresholds use percentages to define potential risk impact, and percentages cannot be accurately converted from a smaller project scale to a larger program scale. For this reason, relative threshold types are not supported by program risk matrixes. Converted program threshold fields for project risks that use relative thresholds will appear as blank in the program risk register. To display user impact thresholds for project risks, the same user threshold must be assigned to the program risk matrix and project risk matrix. User impact threshold values for program risks and project risks are displayed in the same column.