Working with the Risk Analysis Distribution Results Scatter Plot
When viewing the Risk Analysis Distribution Results, the Schedule & Cost tab displays a scatter plot graph to better visualize the likelihood of completing a project within a certain cost and finish date.
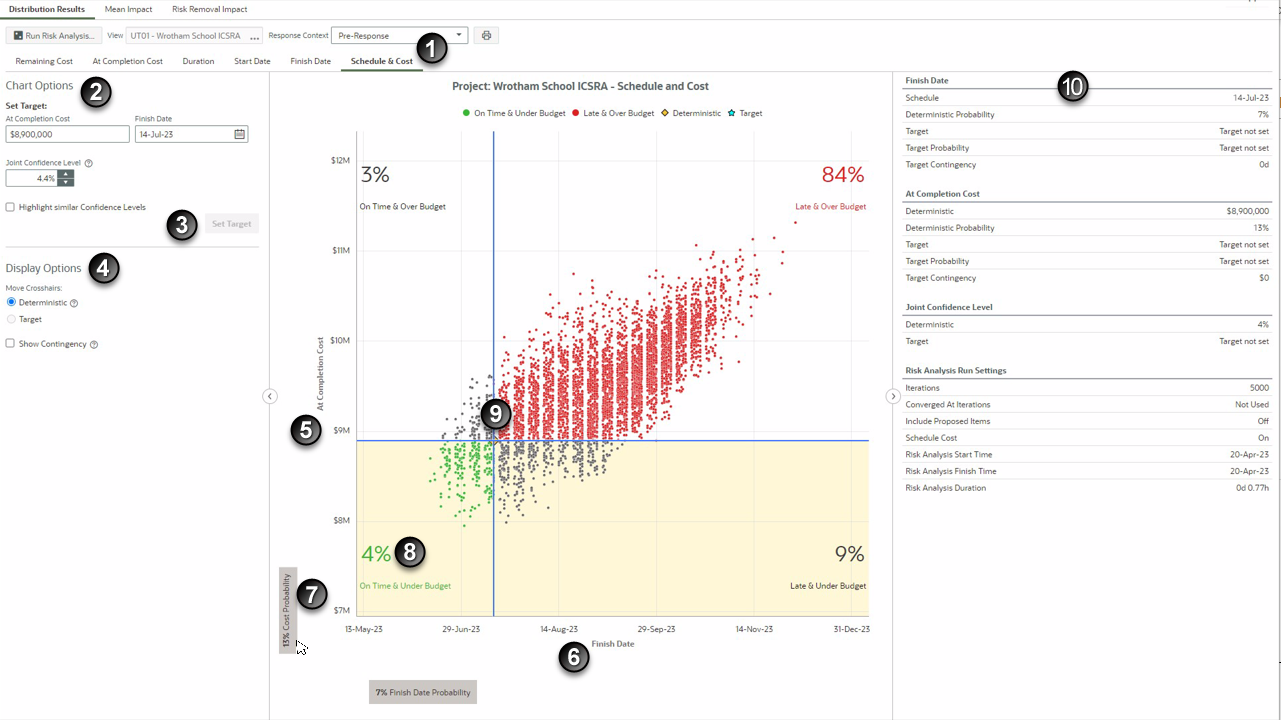
Table of Screen Highlights
Item | Description |
|---|---|
1 | Schedule & Cost tab: Located in the Distribution Results of a Risk Analysis. |
2 | Chart Options: You can set Target values under Chart Options for the At Completion Cost, Finish Date, or both to see the confidence level of meeting these values. Alternatively, set your desired Joint Confidence Level to see the target At Completion Cost and Finish Date needed to achieve this confidence level. Select Highlight similar Confidence Levels to highlight the iterations that are close to desired cost and date values. |
3 | Set Target: Select Set Target to save any updated At Completion Cost, Finish Date, or Joint Confidence Level values. These values are copied to the project target values in the Details Panel (10). A blue star icon is positioned in the graph at the intersection of the target cost and finish date. |
4 | Display Options: Under Display Options, you can toggle between the initial Deterministic values and the selected Target values. A yellow diamond icon is positioned at the intersection of the deterministic cost and finish date. Select Show Contingency to view the Cost and Schedule contingency amounts needed to achieve a confidence level. Return to this tab as your project progresses to see if your confidence level of On Time and Under Budget is improving. |
5 | At Completion Cost: The At Completion Cost displays along the Y-axis. |
6 | Finish Date: The Finish Date displays along the X-axis. |
7 | Hover and Highlight: You can hover over the grey Cost Probability or Finish Date Probability labels to highlight the totals at the set target. In this example, the Cost Probability label is hovered over and the section highlighted in yellow shows the total probability, 13%, that this project will finish at the target cost. For this 13% Cost Probability, 4% is under the target budget and on time and 9% is under the target budget but late. The Finish Date Probability in this example is 7%, where 4% is on time and under the target budget and 3% is on time but over the target budget. |
8 | Joint Confidence Level: Joint confidence levels are displayed in the four corners of the graph, with the chances of being On Time & Under Budget displayed in green in the bottom left corner. You can hover over iteration points on the graph to see details and select any of the points with alternative Finish Date and Cost pairings that give similar joint confidence levels. |
9 | Crosshairs: The crosshairs are initially positioned at the deterministic point. Deterministic values are the project values before risk has been applied. |
10 | Details: The Details panel displays risk analysis details such as Finish Date, At Completion Cost, Joint Confidence Level and Run Settings, including Analysis Start, Finish, and duration time. |