Working with Risk Iteration Analysis Results
This topic provides examples of schedule risk analysis results as well as integrated cost and schedule risk analysis results.
For a complete list of columns that we recommend you display while analyzing either type of results, review the table at the end of this topic.
Schedule Risk Analysis Results
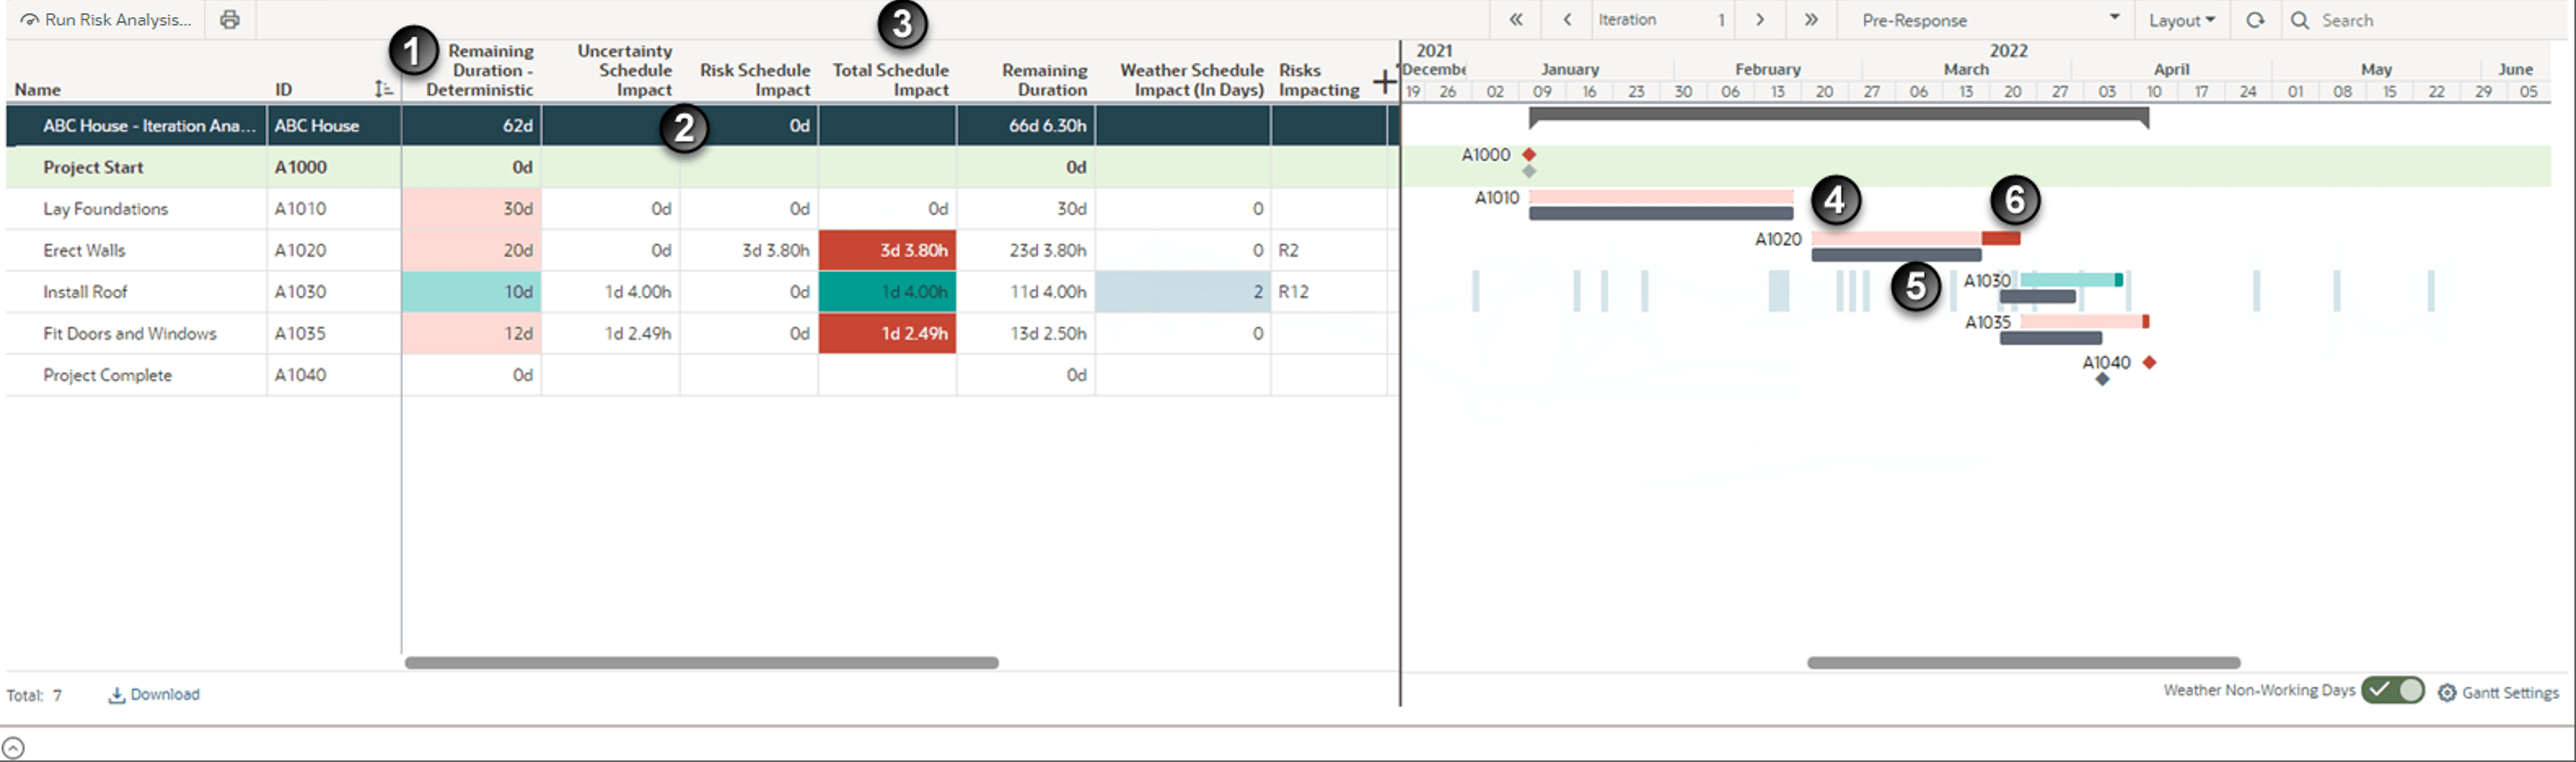
This screenshot depicts impacted dates and schedule data, represented by a grid on the left and a Gantt chart on the right.
In a risk analysis, deterministic values are the values for the activity at the time that the risk analysis was run.
Table of Screen Highlights
Item | Description |
|---|---|
1 | Remaining Duration - Deterministic: This field represents the remaining duration for the activity at the time the risk analysis was run. This is the value that is impacted by risk and uncertainty in each iteration. |
2 | Uncertainty Schedule Impact and Risk Schedule Impact: These fields display the potential impact to the duration of the activity because of uncertainty or risk. |
3 | Total Schedule Impact: This field is the difference between the Iteration Remaining Duration and the Remaining Duration – Deterministic. In many cases, the Total Schedule Impact is the sum of the Uncertainty Schedule Impact and the Risk Schedule Impact for the iteration. In some cases, there can be an Indirect Schedule Impact, that is a variation between deterministic remaining duration and iteration remaining duration that is not due to risk or duration uncertainty. This can include Resource Dependent Activities where the Resource Calendar and Activity Calendars are different. It is always the case for WBS Summary and Level of Effort Activities. If you were to visualize these fields as calculations, they would look like:
Note: Indirect Schedule Impact can occur for Resource Dependent Activities where the Resource Calendar and Activity Calendar are different. For WBS Summary and Level of Effort Activities, the Schedule Impact will always be Indirect. |
4 | Colored Bars: The Remaining Duration - Deterministic, Total Schedule Impact, and Iteration Remaining Duration values are represented by colored bars on the Gantt chart. Above the activity's gray bar, the Remaining Duration for the iteration is displayed as a red bar (for critical activities) or a green bar (for non-critical activities). |
5 | Gray Bars: The gray bars for the activity are drawn between the activity's Deterministic Start Date and Deterministic Finish Date. |
6 | Dark Green / Dark Red Bars: The Total Schedule Impact on the Remaining Duration bar is the darker red or green portion of the bar. The Remaining Duration - Deterministic and Total Schedule Impact columns are also highlighted in red or green to match the Gantt bars. |
7 | Project Risk Impacts Bar: This bar in the Project Risk Impacts row displays project impacts due to risks that are not assigned to an activity. |
8 | Details Panel: View Risk Impacts, Relationships, and Resource Assignments affecting the iteration. |
Note If you would like an additional way to view if an activity is critical other than the column and Gantt bar colors, add the Critical - Deterministic and Critical columns to the grid.
For example, for the Install Roof activity in the screenshot, the columns and Gantt bar are green because it is not a critical activity. The total length of the bar represents the Iteration Remaining Duration for the risk analysis iteration currently displayed. The lighter green represents the Remaining Duration - Deterministic amount and the dark green portion is the additional time from the Total Schedule Impact.
Integrated Cost & Schedule Risk Analysis
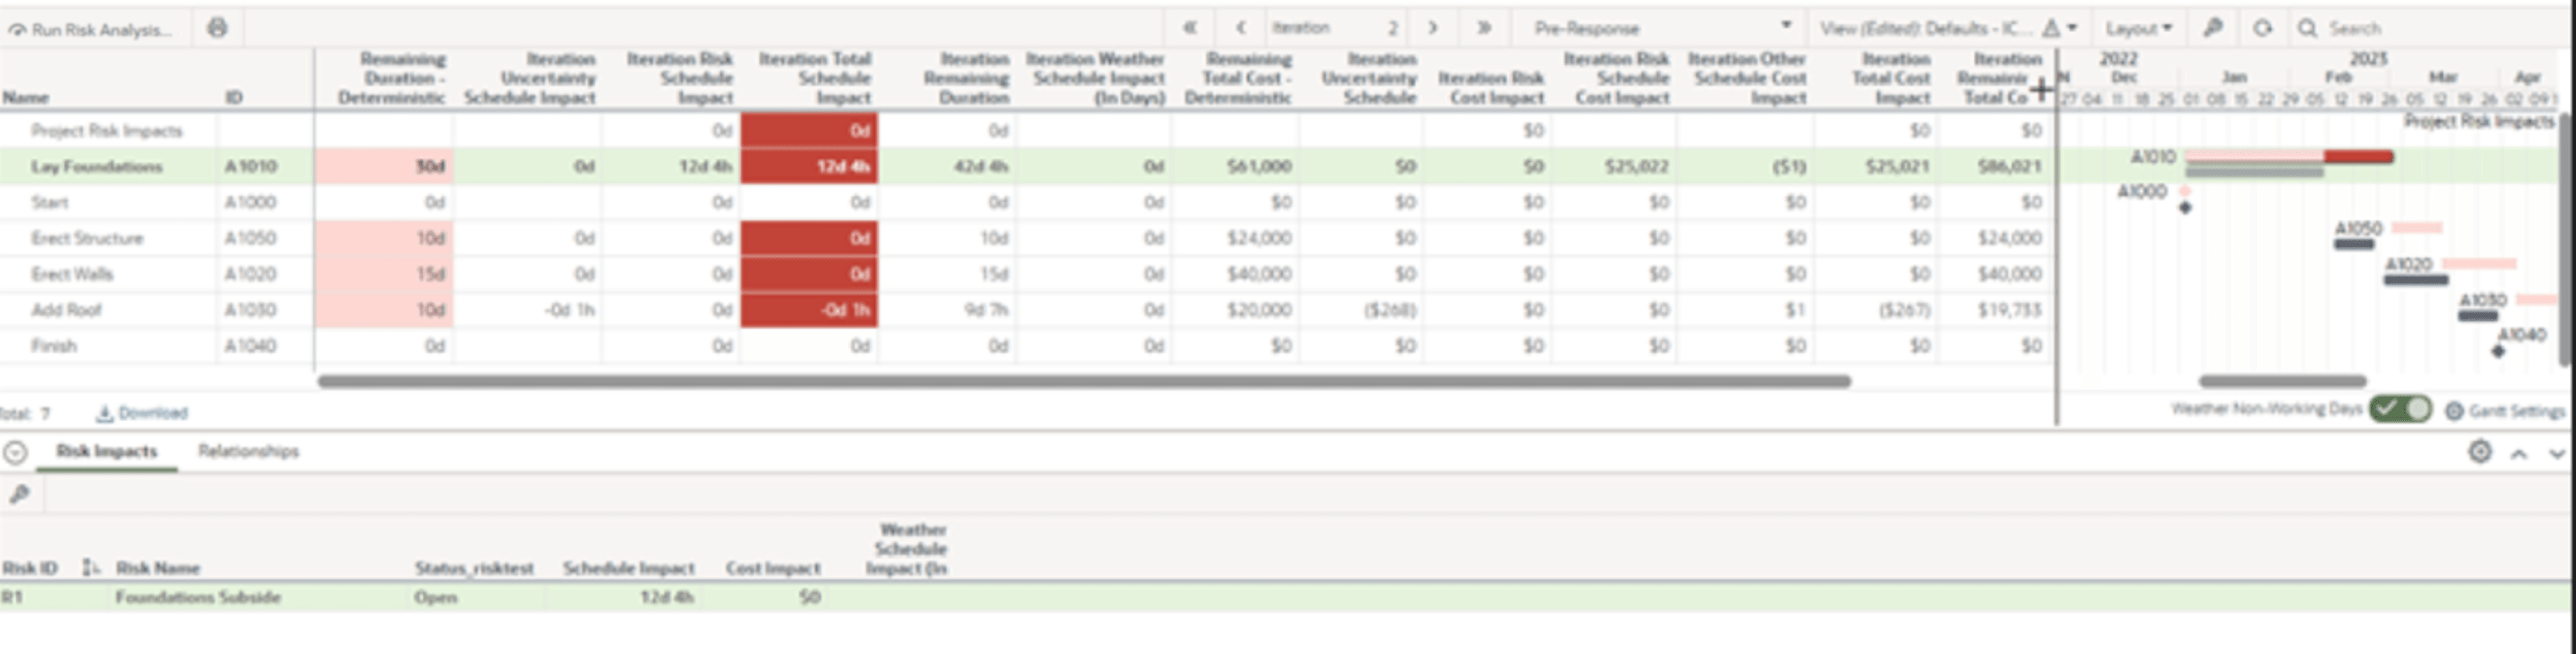
In this screenshot, the risk iteration analysis displays a combination of impacted cost and schedule data.
Tips for reviewing the results
- If the schedule has resources with rates assigned to its activities, then it is also possible to see how the cost changes through each iteration of the risk analysis.
- When an activity duration is increased, the resource assignments may also increase and the cost of both the resource assignments and activity will subsequently increase.
- Similar to Remaining Duration, we can calculate the Total Cost Impact by subtracting the Deterministic Remaining Cost from the Iteration Remaining Cost. We also know the Risk Cost Impact that was sampled for that specific Iteration.
- For Activity Dependent and Resource Dependent Activities, we know the uncertainty and risks driving the Remaining Duration, so we can allocate the rest of the Cost Increase to Uncertainty Schedule Cost Impact and Risk Schedule Cost Impact respectively.
- For Level of Effort and WBS Summary Activities there is no risk or uncertainty driving the Activity Duration directly, so this is labeled as Other Schedule Cost Impact.
- There can also be instances of Other Schedule Cost Impact on Activity Dependent and Resource Dependent Activities when the activity is moved to a different place in time where the Resource Rate differs for that iteration.
If you were to visualize these fields as calculations, they would look like:
- Total Cost Impact = Iteration Remaining Cost – Deterministic Remaining Cost
- Total Cost Impact = Uncertainty Schedule Cost Impact + Risk Schedule Cost Impact + Risk Cost Impact + Iteration Other Schedule Cost Impact
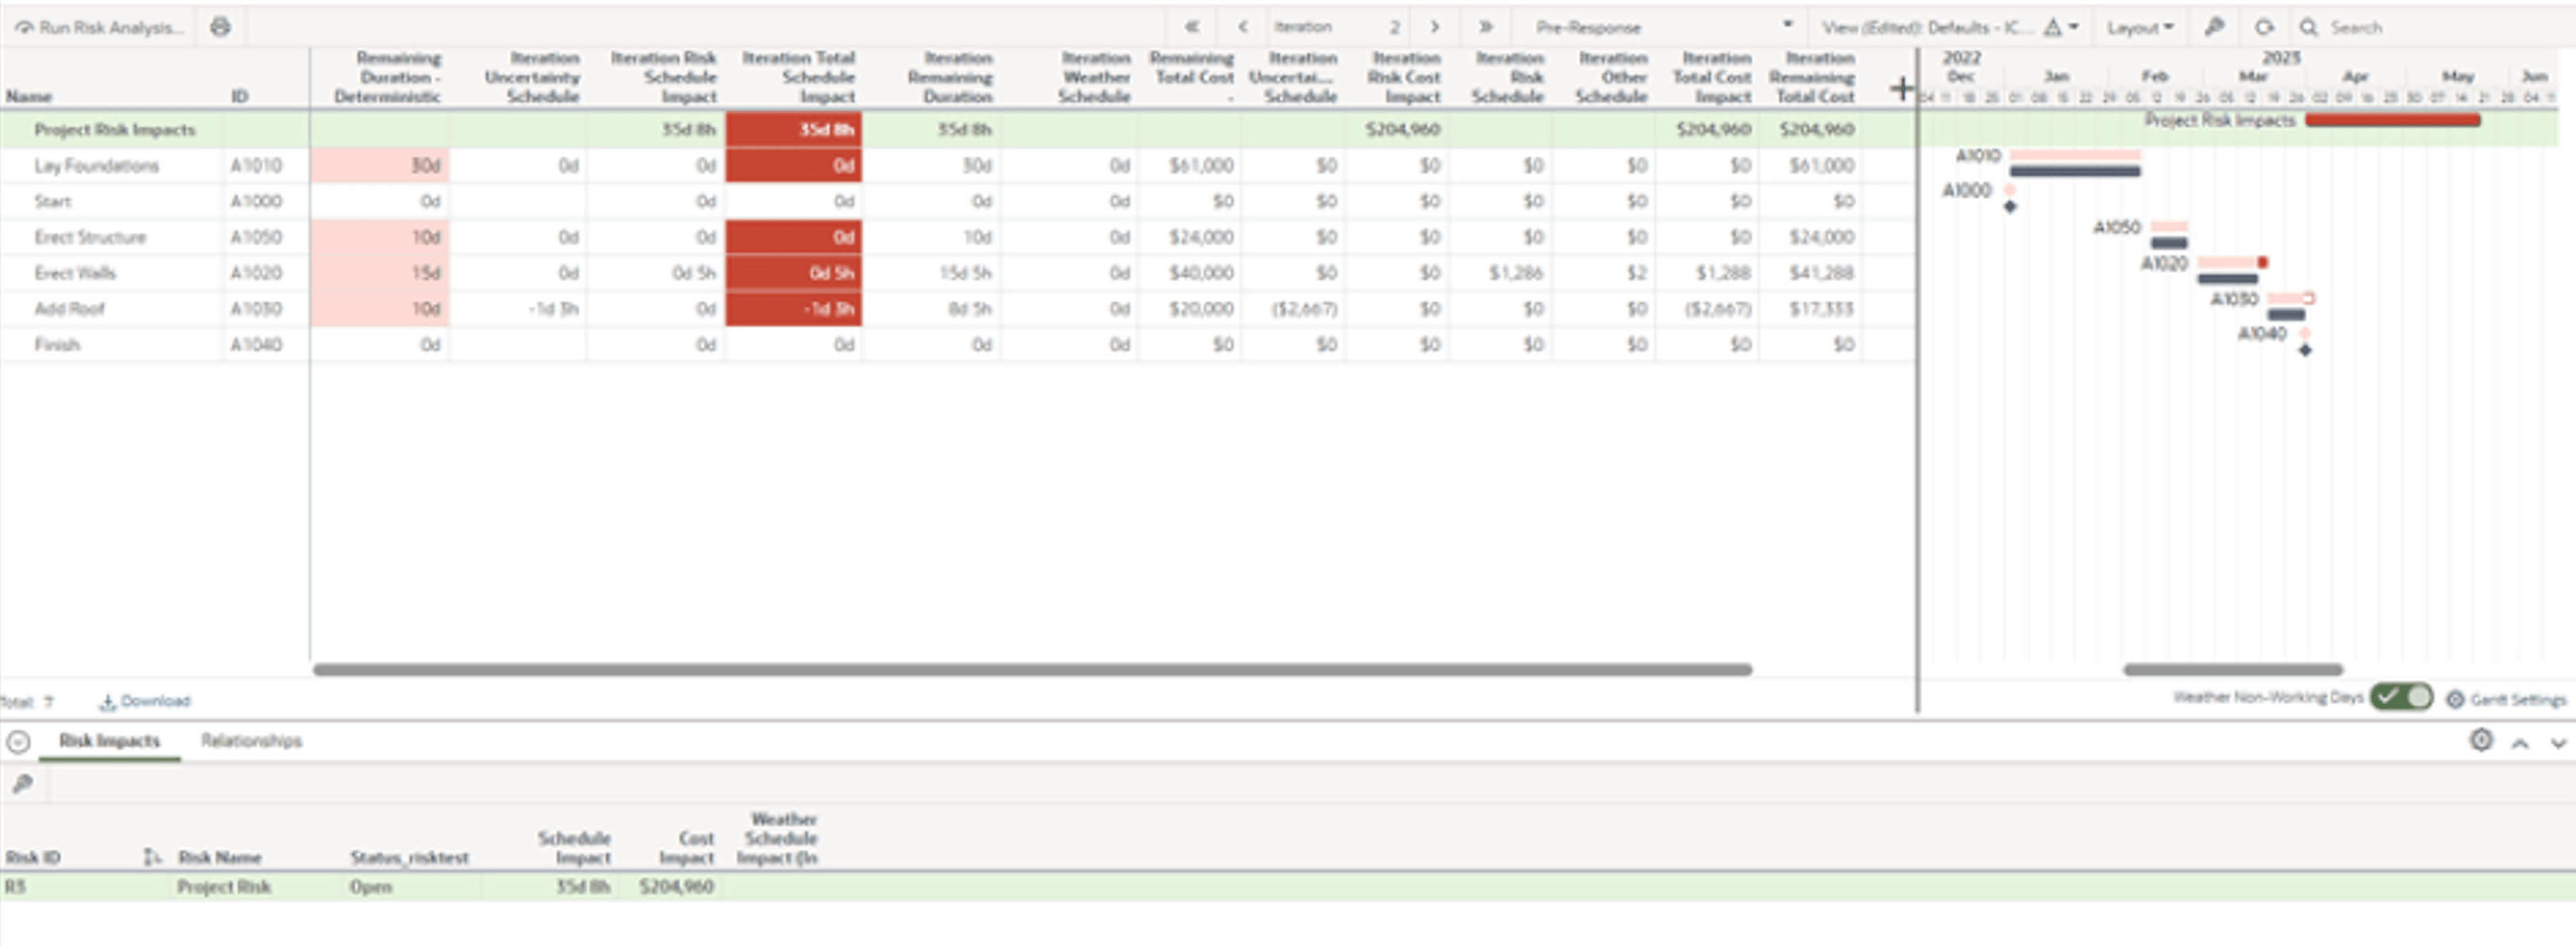
Any Risks that are not assigned to an activity can still impact the project. The Schedule Impact is simply added onto the Project Schedule Finish Date for that iteration. This can be seen in the Project Risk Impacts Bar. Any cost impacts from risks are also included in the Iteration Remaining Total Cost for the Project Row. Note that risks that are not assigned to an activity cannot have a resulting cost increase due to schedule impact. This screenshot displays an example of a Project Risk Impacts Bar, shown as the top row of the grid view and as the red bar in the Gantt chart.
Recommended Risk Iteration Analysis Fields
Field Name | Field Description | Schedule Risk Analysis | Integrated Cost & Schedule Risk Analysis |
|---|---|---|---|
Remaining Duration - Deterministic | The activity remaining duration at the time the risk analysis was run. | X | X |
Iteration Uncertainty Schedule Impact | For the iteration, the difference between the activity deterministic remaining duration and the duration sampled from the activity Uncertainty Distribution. The value can be positive or negative. Stored for the first 50 iterations only. | X | X |
Iteration Risk Schedule Impact | The change in the activity remaining duration due to risks impacting the activity for the iteration. Only schedule impacts from Threats and Opportunities are included (Weather risks impact an activity's non-working, but not the remaining duration). If the sampled risk schedule impacts on the activity are greater than the activity remaining duration, then the activity remaining duration is set to 1 minute because negative duration values are not supported. Stored for the first 50 iterations only. | X | X |
Iteration Indirect Schedule Impact | Variation between deterministic remaining duration and iteration remaining duration that is not due to risk or duration uncertainty. Stored for the first 50 iterations only. | X | X |
Iteration Total Schedule Impact | The Total Schedule Impact is the difference between the Iteration Remaining Duration and the Remaining Duration – Deterministic. Stored for the first 50 iterations only. | X | X |
Iteration Remaining Duration | The activity remaining duration for the iteration. Stored for all iterations. | X | X |
Iteration Weather Schedule Impact (In Days) | The number of weather non-working days between the start and finish of the activity for the iteration. Weather non-working time that coincides with other non-working weather time on the activity time is included. Stored for the first 50 iterations only. | X | X |
Risks Impacting | The risks that impacted the activity for the iteration. Stored for the first 50 iterations only. | X | X |
Remaining Total Cost - Deterministic | The activity remaining total cost at the time the risk analysis was run. |
| X |
Iteration Uncertainty Schedule Cost Impact | Total cost impact due to uncertainty on the activity for the iteration. Stored for the first 50 iterations only. |
| X |
Iteration Risk Cost Impact | The total for the iteration of the cost impact on the activity due to risks impacting the activity. Stored for the first 50 iterations only. |
| X |
Iteration Risk Schedule Cost Impact | Activity cost increase due to the schedule impacts from threats and opportunities. Stored for the first 50 iterations only. |
| X |
Iteration Other Schedule Cost Impact | Other cost impact on the activity for the iteration. Stored for the first 50 iterations only. |
| X |
Iteration Total Cost Impact | Total cost impact due to risks on the activity for the iteration. Stored for the first 50 iterations only. |
| X |
Iteration Remaining Total Cost | The activity remaining total cost for the iteration. Stored for all iterations. |
| X |
Start - Deterministic | The activity start date at the time the risk analysis was run. Note: this is included to allow default sorting by Start Date. |
| X |
Risk Analysis Using Risk Factors
This screenshot depicts a Risk Iteration Analysis involving only risk factors, and with impact on the project schedule only. This means the risk factor cost impact is 100%.
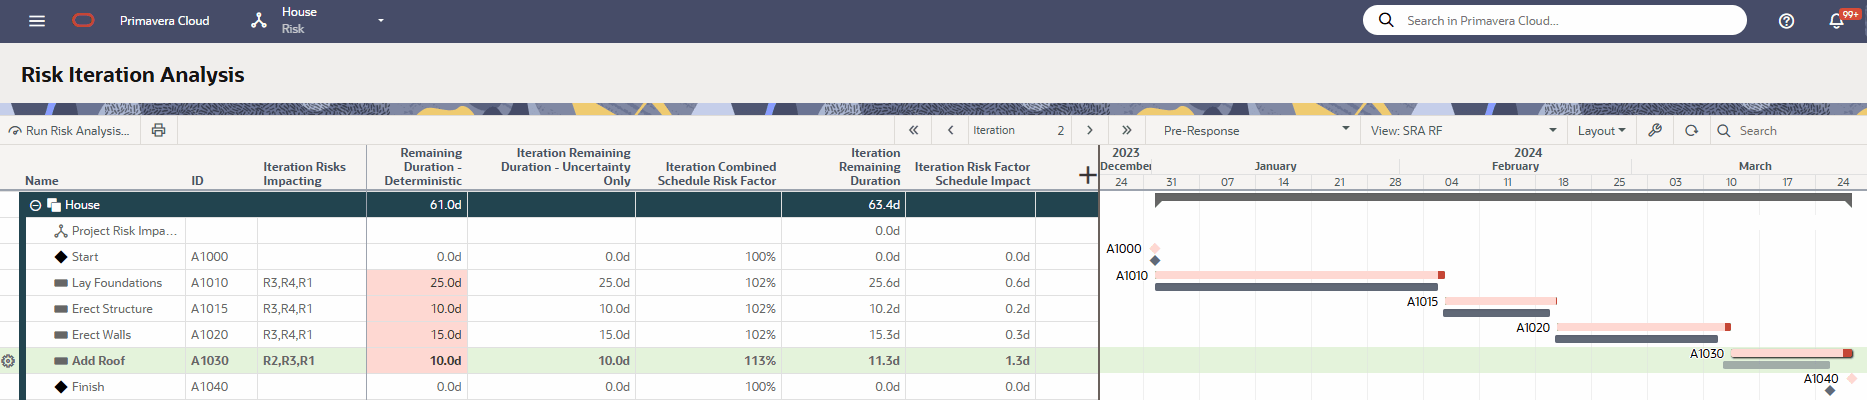 The highlighted activity, Add Roof, has an assigned schedule risk factor of 100%, 110%, and 120%. In this example, the activities do not have any applied uncertainty. If an activity does have applied uncertainty, the risk factor is applied after that uncertainty is calculated. Therefore, the value in column Iteration Remaining Duration – Uncertainty Only is multiplied by the risk factor percentages during the risk analysis.
In the iteration shown above, the value in column Iteration Remaining Duration – Uncertainty Only, 10.0d, is multiplied by the Iteration Combined Schedule Risk Factor percentage of 113%, resulting in an Iteration Remaining Duration of 11.3d and an Iteration Risk Factor Schedule Impact of 1.3d.
The columns displayed above are recommended when focusing on schedule for an iteration analysis utilizing risk factors:
- Iteration Remaining Duration – Uncertainty Only: The remaining duration sampled during this iteration of the risk analysis, which reflects any activity uncertainty applied.
- Iteration Combined Schedule Risk Factor: The risk factor percentage sampled during this iteration of the risk analysis. If there are multiple risk factors assigned to an activity, then each of their individual risk factor impacts are multiplied together.
- Iteration Remaining Duration: The remaining duration once the risk factor has been applied.
- Iteration Risk Factor Schedule Impact: The duration added or subtracted due to the applied risk factor.
This screenshot depicts a Risk Iteration Analysis involving only risk factors, and with impact on the project cost only. This means the risk factor schedule impact is 100%.
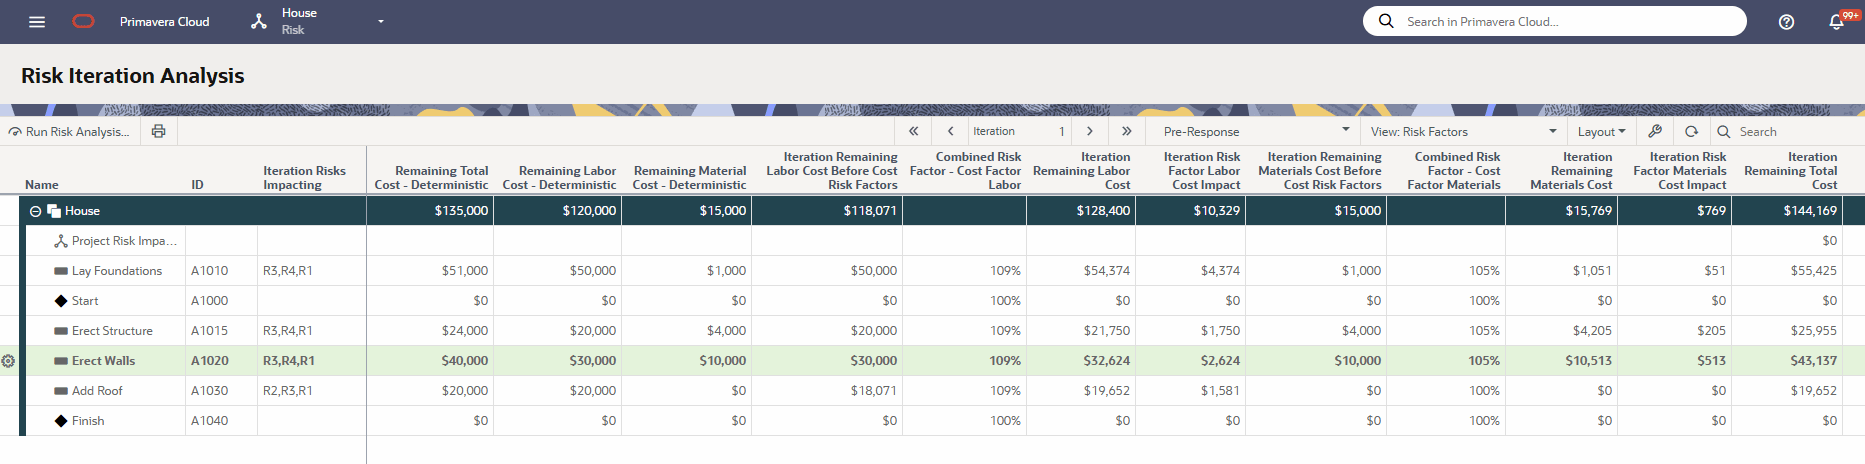
The highlighted activity, Erect Walls, has an assigned cost risk factor of 100%, 110%, and 120%. Risk factor cost impacts have the option to determine which cost type they will impact: Labor, Nonlabor, Materials, or All Costs. In this example, we are only viewing Labor and Materials costs. We see a breakdown of the Remaining Total Cost - Deterministic of $40,000 into the Remaining Labor Cost - Deterministic of $30,000 and the Remaining Material Cost - Deterministic of $10,000.
The value in columns Remaining Labor Cost - Deterministic and Remaining Material Cost - Deterministic are multiplied by the risk factor percentages during the risk analysis. The applied risk factor percentage for each of the labor and materials values has been placed on the grid next to its respective applied value for this iteration.
The Iteration Remaining Labor Cost Before Cost Risk Factors of $30,000 is multiplied by the Combined Risk Factor - Cost Factor Labor of 109%, resulting in the Iteration Remaining Labor Cost of $32,624 and an Iteration Risk Factor Labor Cost Impact of $2,624.
The same process is repeated for the Materials Cost. In this iteration, the risk factor sampled for the materials cost is 105%, for an Iteration Remaining Materials Cost of $10,513.
The Remaining Labor and Materials Costs are combined for the Iteration Remaining Total Cost of $43,137.
In this example, the activities do not have any applied uncertainty. If an activity does have applied uncertainty, the risk factor is applied after that uncertainty is calculated. If more than one risk factor impacts an activity, the impact is added to each risk factor proportionally based on the absolute value of their impact.
The columns displayed above are recommended when focusing on cost for an iteration analysis utilizing risk factors:
- Iteration Remaining (Labor, Non Labor, or Materials) Cost Before Cost Risk Factors: The remaining cost after any cost changes due to schedule, but before threat and opportunity cost impacts.
- Combined Risk Factor - Cost Factor (Labor, Non Labor, or Materials): The cost risk factor percentage sampled for this iteration of the risk analysis. If there are multiple risk factors assigned to an activity, then each of their individual risk factor impacts are multiplied together.
- Iteration Remaining (Labor, Non Labor, or Materials) Cost: The remaining amount for that cost once the risk factor has been applied.
- Iteration Risk Factor (Labor, Non Labor, or Materials) Cost Impact: The amount added or subtracted to that cost due to the applied risk factor.
- Iteration Remaining Total Cost: The total amount for the activity after risk factors have been applied to each cost.
Risk Factors can impact assigned activities as a constant or independently. See Risk Factor Overview for more information.