Working with the Response Actions Page
View all of your risk response actions in one place. You can group and sort your response actions to see which are late or upcoming, and easily see which actions require attention. You can also see the priority of your response actions to know which actions to focus on to reduce the risk on your project.
The Response Actions grid has two header rows. The first header row groups column data by Response Action or Risk. This allows you to see the response actions in context of the risk they were created to mitigate, as well as that risk's data. The second header row contains the column labels.
Because the grid has two headers, you are not able to drag columns in the grid. You must go to ![]() Settings to reorder columns, and available columns are labeled Response Action or Risk. Most response action data is editable, but risk data is not editable.
Settings to reorder columns, and available columns are labeled Response Action or Risk. Most response action data is editable, but risk data is not editable.
Activity data is synchronized to the risk response actions when the scheduler runs. For the most up to date data, run the scheduler before viewing this page.
You must have the View Risks permission to view the response actions.
This screenshot depicts the Response Actions page Default View:
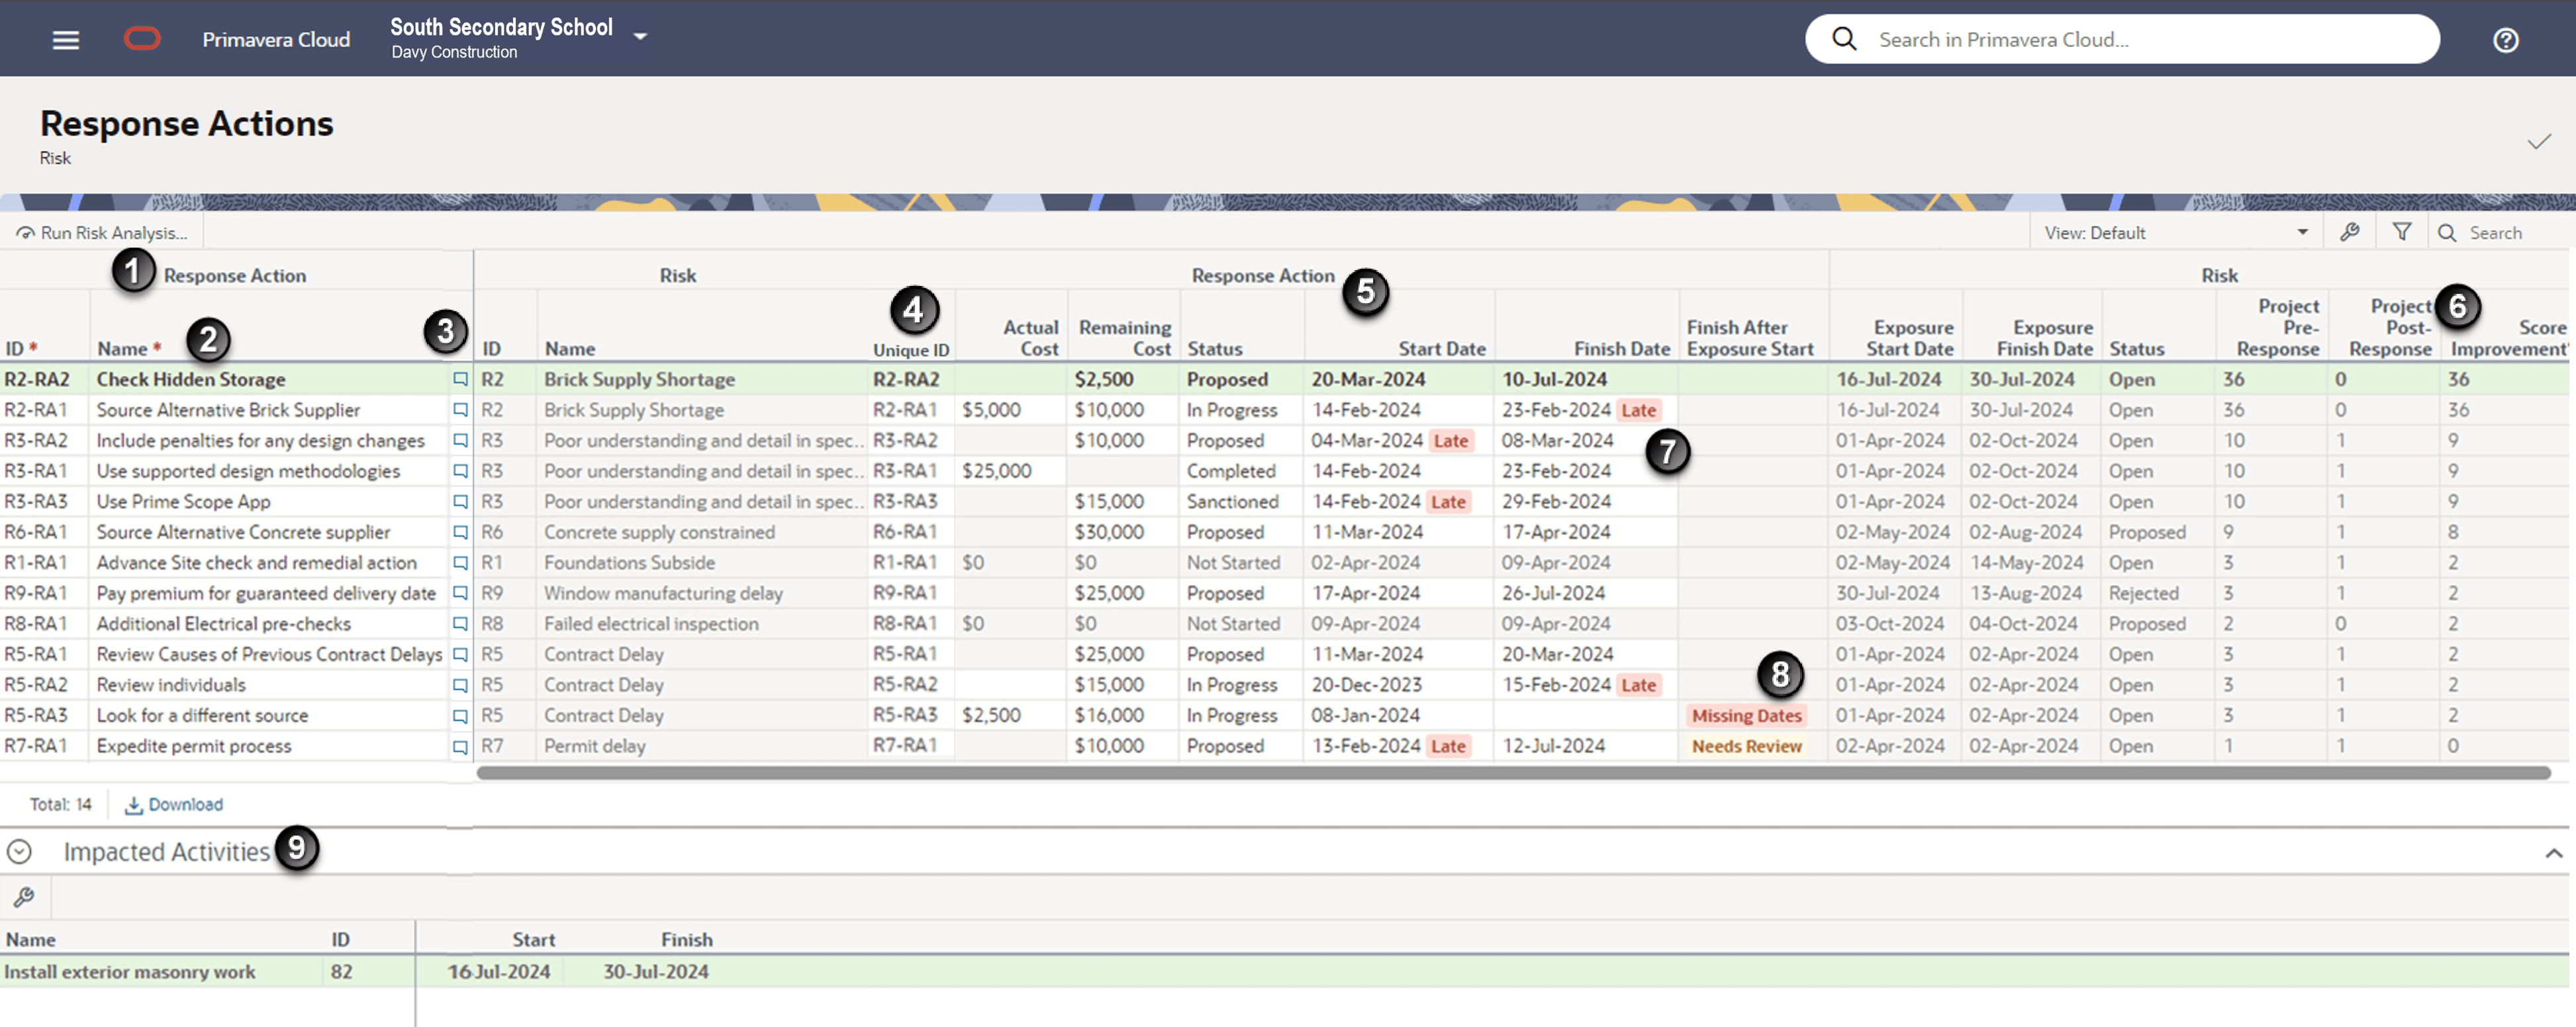
Table of Screen Highlights
Item | Description |
|---|---|
1 | Response Action and Risk Header: Data fields are grouped by Response Action or Risk. |
2 | Column Header: Displays the column labels for response action or risk data. |
3 | Discussions: Use Discussions to view communication and exchange information on risk response actions. |
4 | Unique ID: Displays unique identification for each response action by combining the Risk ID - Response Action ID. Risks can have multiple response actions, and the Unique ID field makes it easier to see which risk the response action is associated with. |
5 | Response Actions fields: Columns display response action data. |
6 | Risk fields: Columns display risk data for the response action. The Score Improvement column displays the difference between the pre- and post-response scores, allowing you to sort by which actions provide the highest improvement score. |
7 | Timing Badge: Badges enable you to see those response actions that are late in comparison to today's date. For In Progress response actions, it is the Finish Date of the response action that is compared to today's date. Otherwise, it is the start date of the response action that is checked. Completed and Rejected response actions are not checked for timing. Note You can also add the Timing field to the grid to view and sort by this information. |
8 | Finish After Exposure Start: Indicates whether the response action finishes after the start date of exposure to the risk. The response action should be completed before the risk exposure begins. If the response action finishes after the risk exposure start date, this column will display Needs Review. If response action Finish Date or risk exposure Start Date is missing, this column will display Missing Dates. |
9 | Details Panel: Select a response action in the grid to view the Impacted Activities assigned to the risk that the response action belongs to. Note It is the start and finish of the Impacted Activities that drive the Risk Exposure Start and Finish Date. |
Prioritizing Response Actions
The response action and risk fields available in ![]() Settings enable you to prioritize response actions to reduce the risk on your project. There are different fields available for priority depending on whether you are performing qualitative or quantitative analysis, and whether you are more focused on cost or schedule.
Settings enable you to prioritize response actions to reduce the risk on your project. There are different fields available for priority depending on whether you are performing qualitative or quantitative analysis, and whether you are more focused on cost or schedule.
Qualitative Analysis
This screenshot depicts a configured view prioritizing a qualitative analysis:
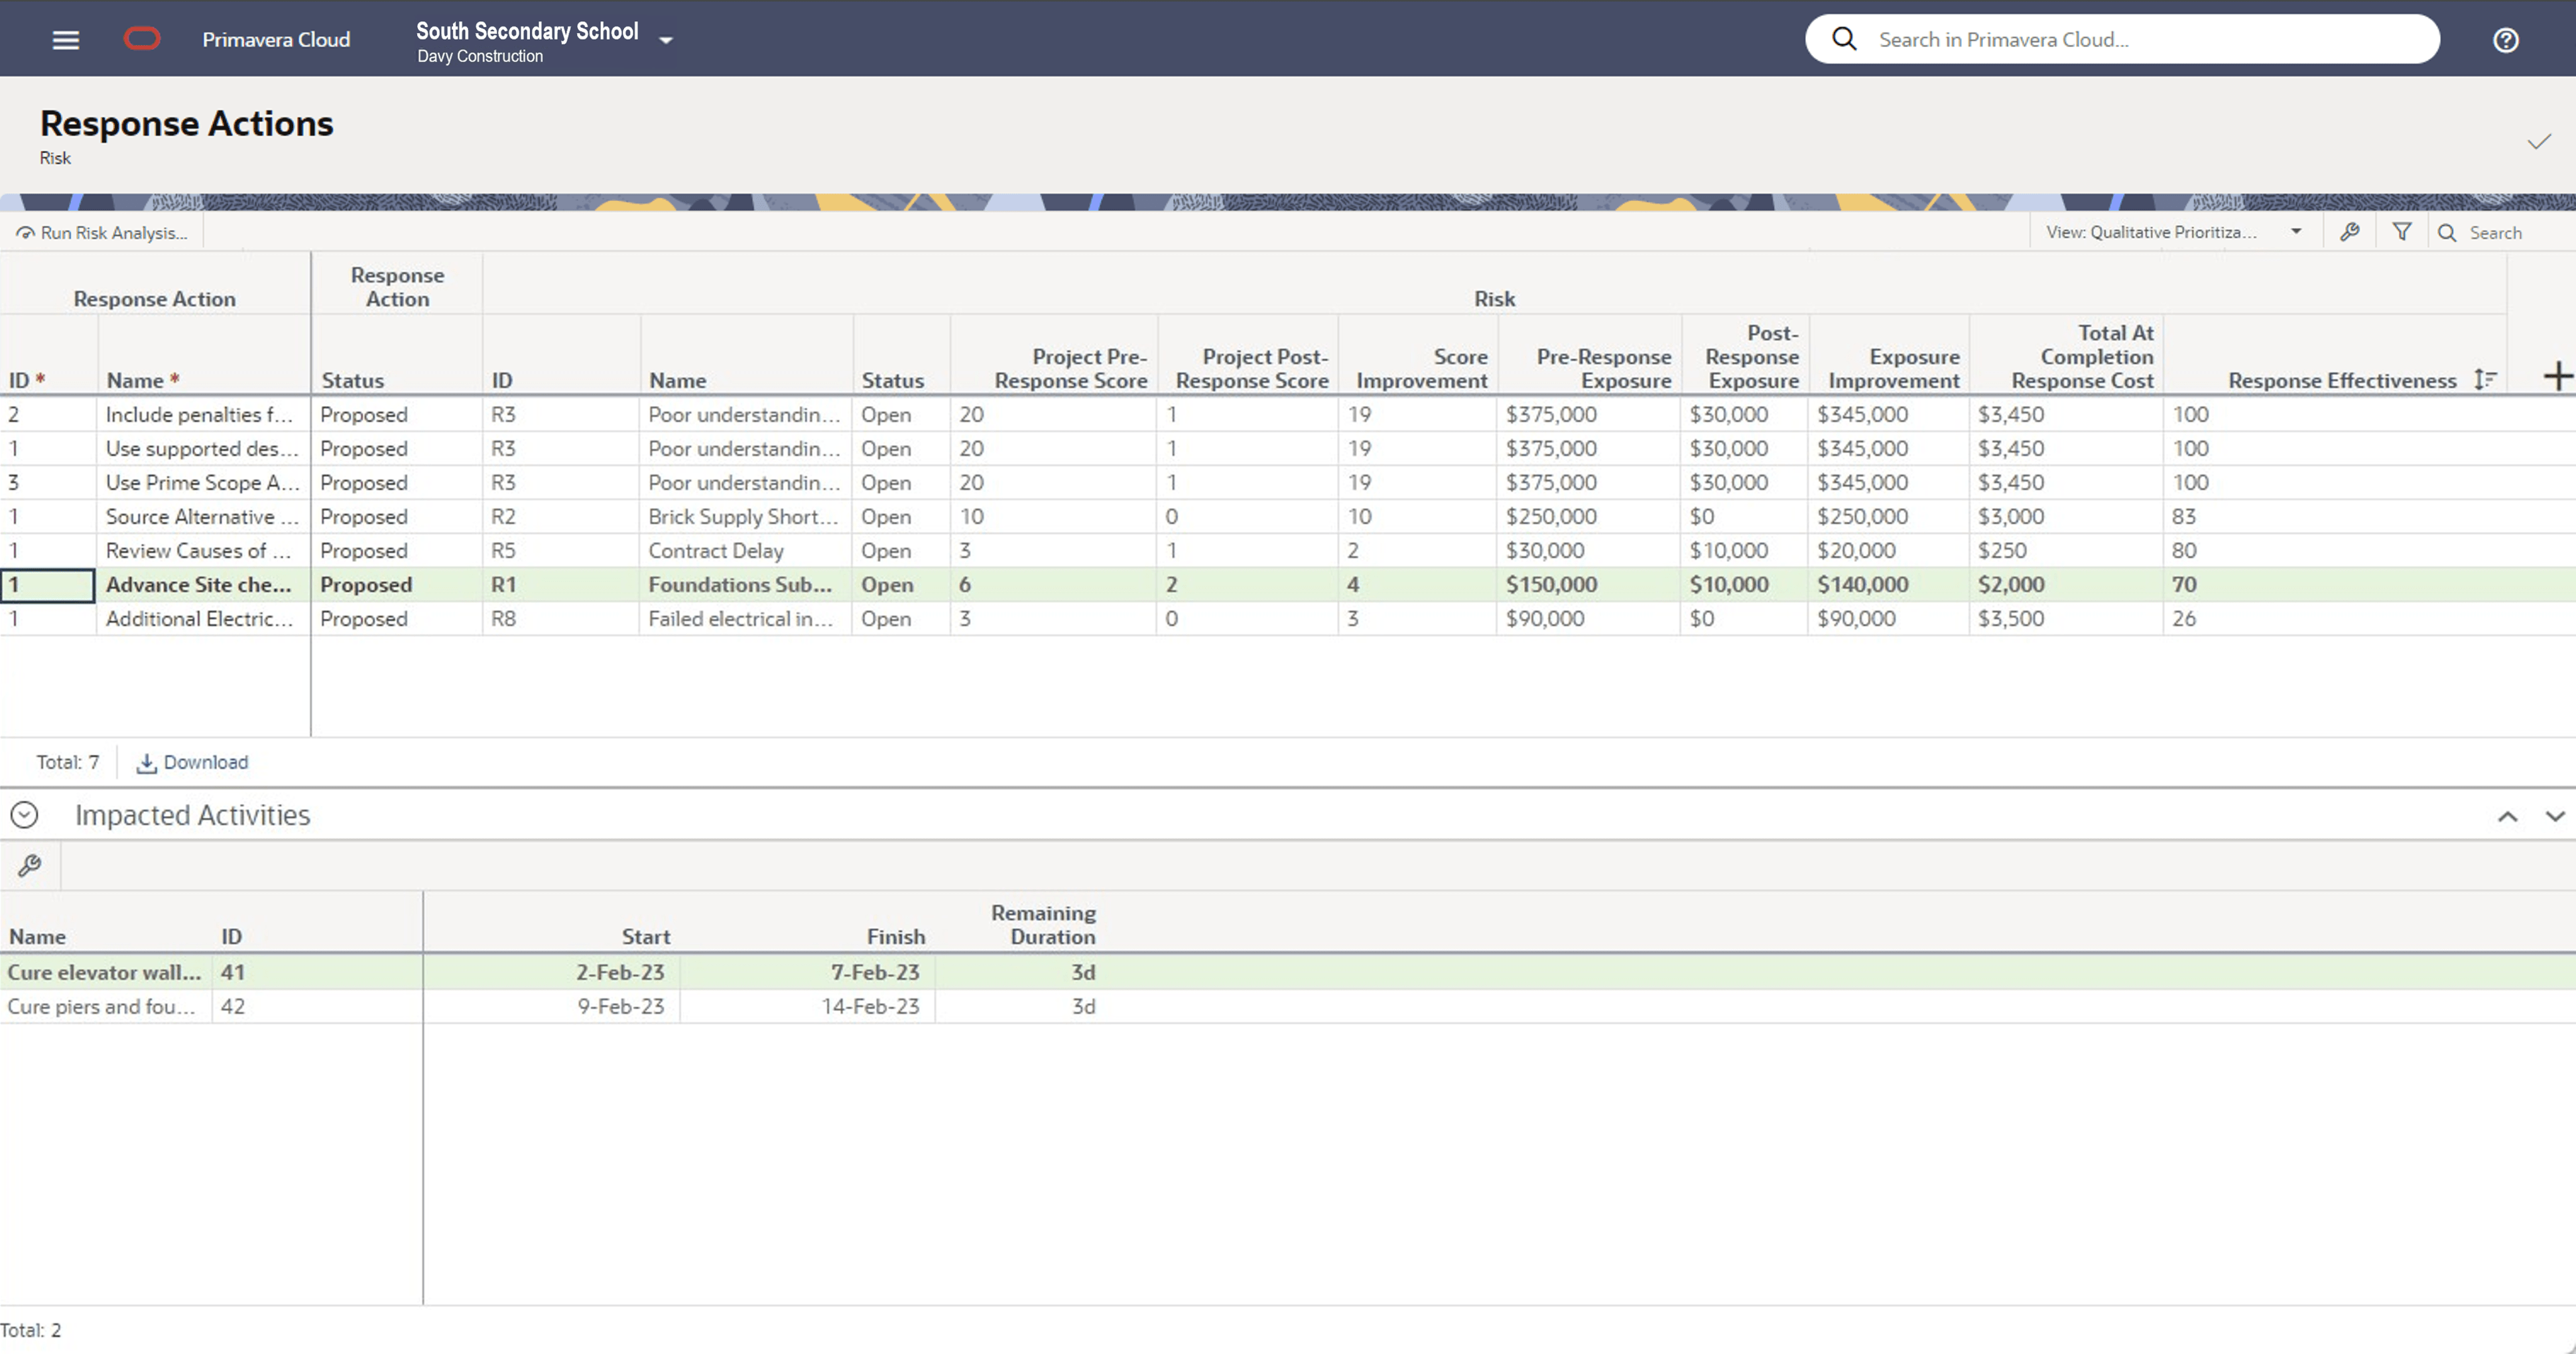
There are three fields selected as columns that allow prioritization for a qualitative analysis:
Score Improvement: This field displays the difference between the Pre-Response Score and the Post-Response Score. You can sort by Score Improvement to see which response actions most improve the risk score.
Exposure Improvement: This field displays the difference between the Pre-Response Exposure and the Post-Response Exposure. You can sort by Exposure Improvement to see which response actions are the most beneficial to cost.
Response Effectiveness: This field displays a risk-level cost-benefit analysis to help you decide whether to carry out the response action for that risk. It displays the size of the risk exposure improvement due to the response action divided by the cost of performing that action (the Total At Completion Response Cost). Any score greater than 1 indicates an effective response action, and the higher the score the more beneficial the response action. A score of less than 1 means the response action costs more to implement than the benefit it brings.
Note Total At Completion Cost is used rather than Remaining Cost to prevent the Response Effectiveness changing during completion of the response actions, where the remaining cost reduces and the actual cost increases.
This view is sorted by Response Effectiveness, with the largest score displayed at the top of the grid.
Quantitative Analysis
This screenshot depicts a configured view prioritizing a quantitative analysis:
To prioritize risk response actions for a quantitative analysis, the Finish Impact and Cost Impact fields allow sorting and prioritization based upon the impact of the response action on the project finish date and final cost. This view is sorted by Cost Impact, with the largest impact on cost displayed at the top of the grid.
In ![]() Settings, Finish Impact is labeled Risk - (Pre-Response Pessimistic Risk Removal) Finish Impact, and Cost Impact is labeled Risk - (Pre-Response Pessimistic Risk Removal) Cost Impact.
Settings, Finish Impact is labeled Risk - (Pre-Response Pessimistic Risk Removal) Finish Impact, and Cost Impact is labeled Risk - (Pre-Response Pessimistic Risk Removal) Cost Impact.
Tips
- Some data, such as cost data, will repeat in the grid when there is more than one action assigned to a risk. These fields are calculated at the risk level, and therefore will not display a breakdown by response action.
- For column fields with a shortened name, hover over the title to see the full column field name.