Hotel Report Tutorial: Regional Managers Property Performance
This topic provides an example walkthrough of how a regional manager can design and create an analysis report to address a business need.
Identify the Data Shown by the Report
-
The total room revenue.
-
The total number of occupied rooms.
Identify the Subject Areas
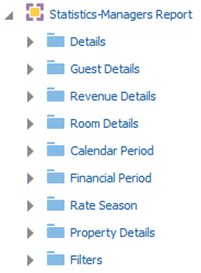
Identify the subject areas that contain the columns and attributes required for the report. In this example, the Statistics-Managers Report subject area contains every column required for creating this report.
Figure 19-12 Statistics-Managers Report Columns

Add Data Columns to the Report
-
Property Details/Chain Code
-
Property Details/Property
-
Calendar Period/Year
-
Room Details/Occupied Rooms
-
Revenue Details/Room Revenue
Figure 19-13 Selected Columns for the Property Performance Report

Add Filters to the Report
-
Chain Code (prompted)
-
Year (prompted)
Figure 19-14 Selected Filters for the Property Performance Report

Add Visualizations to the Report
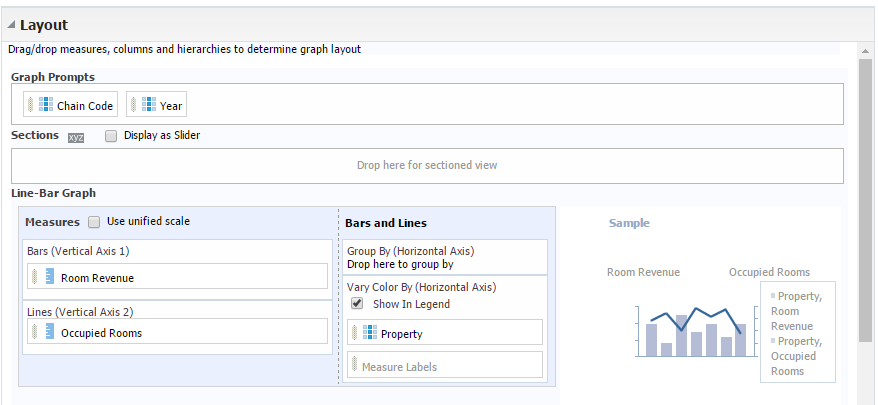
Figure 19-15 Total Room Revenue Comparison with Occupied Rooms Graph Customization

Parent topic: Analysis Reports