4 Oracle Load Testing Tutorial
This tutorial walks you through the main features of Oracle Load Testing. Oracle Load Testing is a separate product in the Oracle Application Testing Suite, which you may or may not have purchased. If you have the Oracle Load Testing version of the Oracle Application Testing Suite, you can follow the examples in this chapter to become familiar with the features and use of Oracle Load Testing.
The tutorial consists of the following examples:
-
Performing a Simple Load Test - shows how to use Oracle Load Testing to run virtual users to simulate load on a Web application.
-
Adding Data Sources - shows how to add data sources to the Oracle Load Testing ServerStats configuration to monitor server-side statistics, such as CPU usage, and available memory.
-
Editing Data Sources - shows how to edit existing Oracle Load Testing ServerStats configurations to modify specific counters.
-
Creating a Scenario with Multiple Profiles - shows how to add a new script to the Oracle Load Testing Scenario. This example also shows how to set the Reporting options and Session Start/Stop options to save data for use in post-run analysis.
-
Running Multiple Profiles - shows how to use Oracle Load Testing to run multiple Scenario profiles with different amounts of virtual users and how to view statistical and performance information.
-
Controlling Virtual Users - shows how to modify individual virtual user attributes, view actions, and stop and abort virtual users.
-
Generating Reports - explains how to view the default reports and generate reports for post-run analysis.
The tutorial is designed to be followed sequentially from beginning to end and assumes you have completed the Oracle OpenScript tutorial in Chapter 3. The examples in this tutorial refer to scripts recorded in the previous tutorials.
4.1 Example 1: Performing a Simple Load Test
This example shows how to use Oracle Load Testing to run virtual users to simulate load on a Web application. The example illustrates how to run a previously recorded script to simulate multiple users accessing a Web application.
4.1.1 Starting Oracle Load Testing and Specifying the Workspace
Note:
This section uses the default login credentials from the Oracle Application Testing Suite installation.To start Oracle Load Testing:
-
Select Programs from the Start menu and then select Oracle Load Testing from the Oracle Application Testing Suite Start menu.
-
Enter administrator as the user name.
-
Enter the password specified during the Oracle Application Testing Suite installation process.
-
Click Login. The main window appears, as follows:
Figure 4-1 Oracle Load Testing Main Window
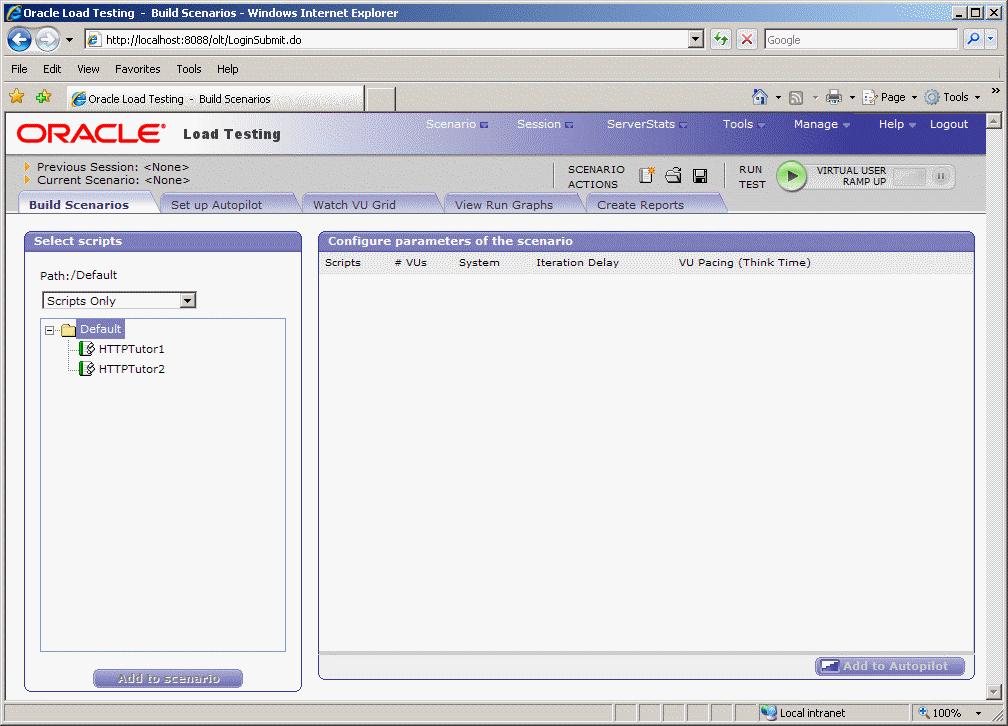
Description of "Figure 4-1 Oracle Load Testing Main Window"
-
Select Default in the Workspace list.
4.1.2 Specifying a Scenario Profile
-
Make sure the Build Scenario tab is displayed in Oracle Load Testing.
-
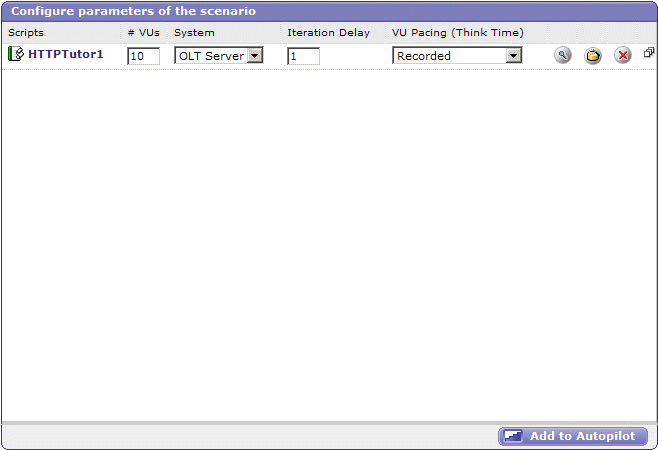
Select HTTPTutor1 in the Select scripts list. These are the scripts that you record using Oracle OpenScript.
-
Click the Add to scenario button to add HTTPTutor1 to the Configure Parameters list. You can also double-click the script name to add it to the Configure Parameters list.
Oracle Load Testing automatically specifies a set of default virtual user attributes for the Scenario Profile in the Scenario tab. For this example, we'll use the default attributes.
-
Click the Add to Autopilot button on the Build Scenario tab.
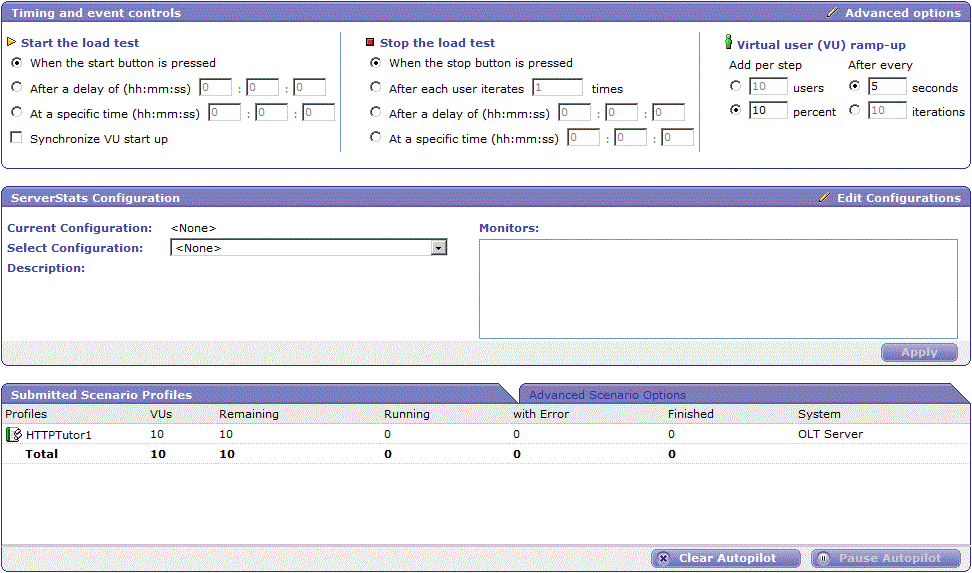
Oracle Load Testing automatically opens the Set up Autopilot tab with the HTTPTutor1 Scenario Profile listed in Submitted Scenario Profiles list.
4.1.3 Running the Scenario Profile Using Autopilot
-
Select After each user plays [#] iteration option from the Stop the load test group of the Autopilot tab.
-
Enter 5 in the After each user iterates edit box.
-
Select [#] users below Add per step in the Virtual User ramp up group.
-
Enter 1 in the Add per step [#] users edit box.
-
Select [#] seconds below After every in the Virtual User ramp up group.
-
Enter 10 in the [#] seconds edit box.
-
Click the Run Test button on the Autopilot tab or the toolbar.
-
Click OK to save the session using the default session name.
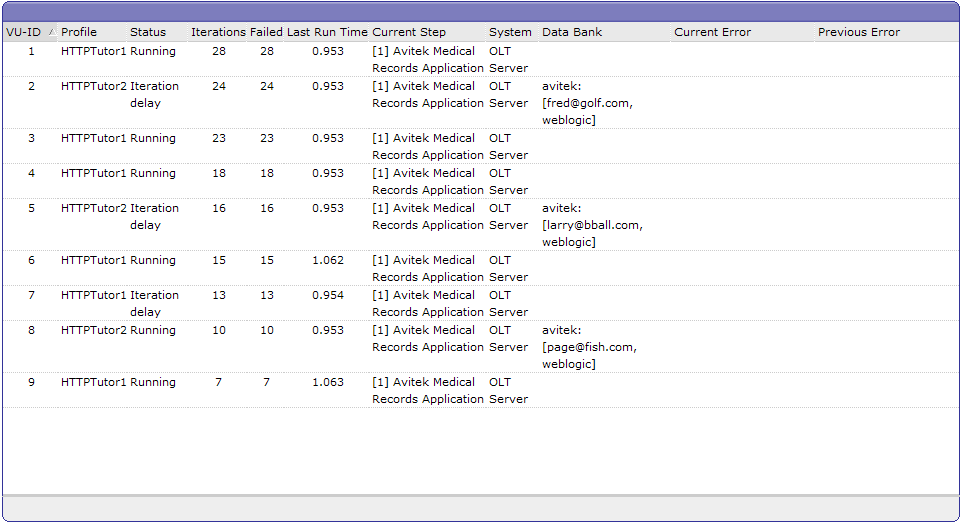
Oracle Load Testing starts running the virtual users in the Virtual User Grid. Watch as the Autopilot starts running the HTTPTutor1 script as ten virtual users.
Figure 4-4 Virtual User Status Grid Window
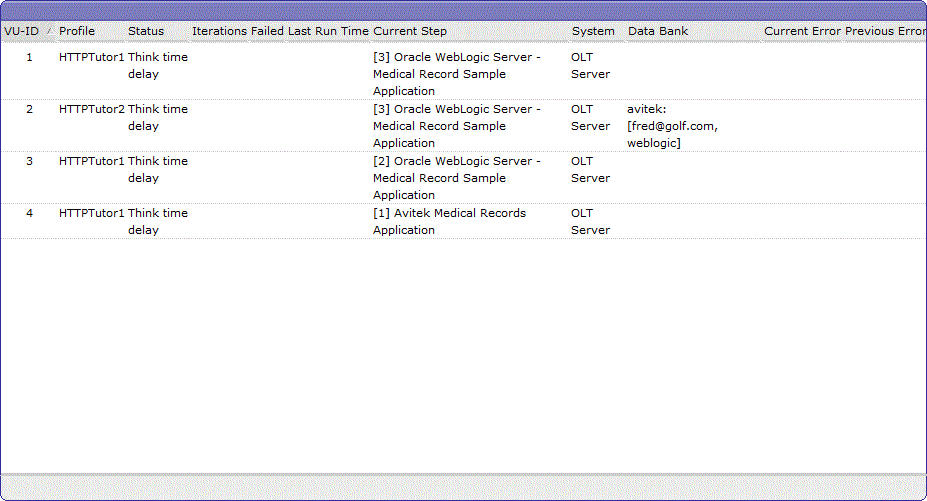
Description of "Figure 4-4 Virtual User Status Grid Window"
-
Allow the virtual users to continue running until all of them indicate Finished in the Status column of the virtual user grid.
Congratulations. You have just performed a simple load test on the Demo Web application. Oracle Load Testing performs the virtual user Web interaction in the background. You can monitor the virtual users in the grid as they are running. In the later examples of this tutorial, you'll see how to use Oracle Load Testing to view statistical and performance information, and how to view virtual user actions.
4.2 Example 2: Adding Data Sources
This example shows how to add data sources to the Oracle Load Testing ServerStats configuration to monitor server-side statistics, such as CPU usage, and available memory.
Oracle Load Testing ServerStats can monitor statistics from a variety of systems and server types. This tutorial adds counters from your local Windows system to demonstrate the features of Oracle Load Testing ServerStats. If you are not running the Oracle Application Testing Suite on a Windows machine, you should skip examples 2 and 3 and continue the tutorial with example 4.
To configure counters from a Windows data source, do the following:
-
Select Configurations from the ServerStats menu. Oracle Load Testing opens the ServerStats Configurations window.
-
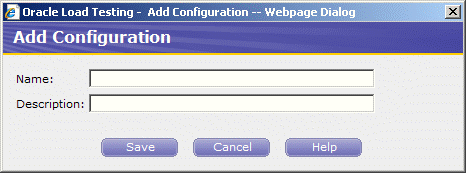
Click New to add a new configuration.
-
Type Tutorial for the Name and the Description.
-
Click Save. The Configuration window changes to include the Monitors configuration options.
-
Click New in the Monitors pane to open the Add Monitor Step 1 window.
Figure 4-6 Add Monitors Step 1 Dialog Box
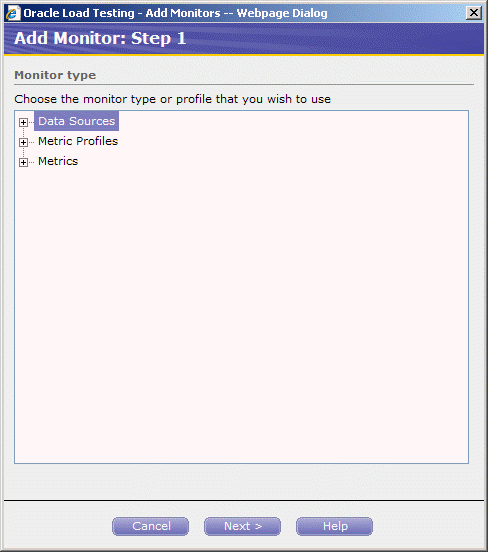
Description of "Figure 4-6 Add Monitors Step 1 Dialog Box"
-
Click the Plus icon next to Data Sources to expand the list of data sources.
Figure 4-7 Add Monitors Step 1 with Data Sources Expanded
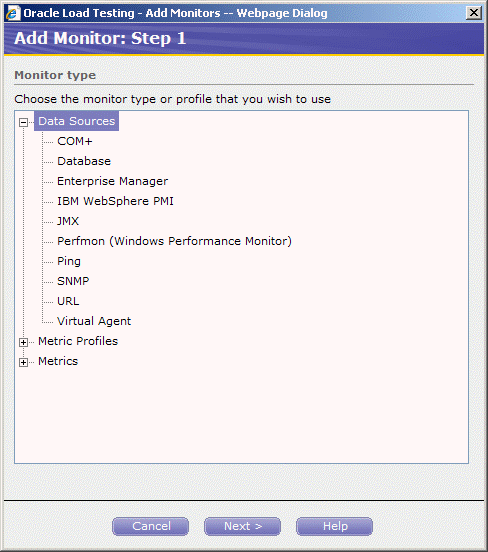
Description of "Figure 4-7 Add Monitors Step 1 with Data Sources Expanded"
-
Figure 4-8 Add Monitors Step 2 Dialog Box
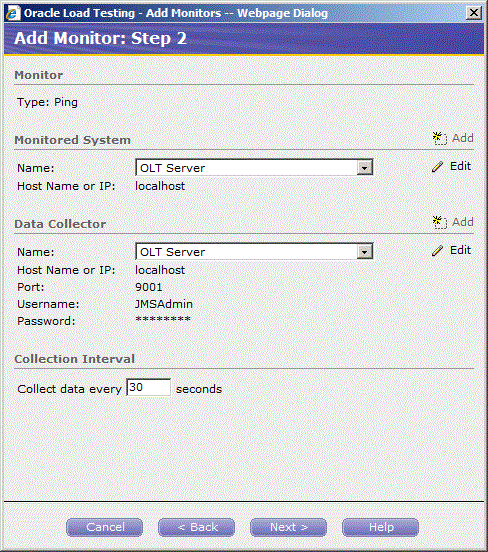
Description of "Figure 4-8 Add Monitors Step 2 Dialog Box"
This step lets you specify which system to monitor and which system to use for the data collector.
-
Leave the default settings for Monitored System and Data Collector.
-
Click Next to specify the monitor properties.
Figure 4-9 Add Monitors Step 3 Dialog Box
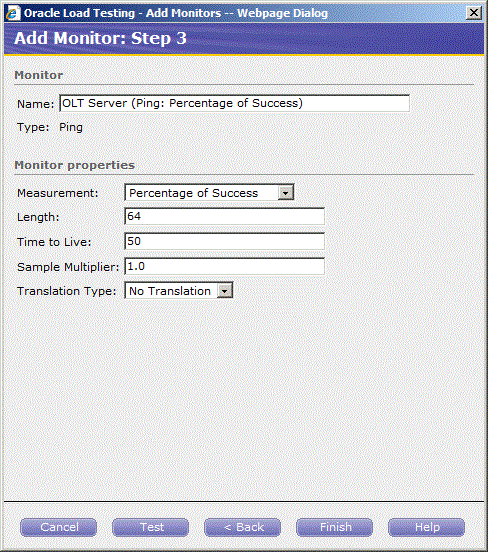
Description of "Figure 4-9 Add Monitors Step 3 Dialog Box"
-
Specify the monitor properties and click Finish to complete adding monitors. ServerStats display a status while it verifies the counters (this may take a few moments).
When the verification is complete, the Configuration window is updated with the monitors.
Figure 4-10 Configurations Dialog Box with Defined Monitors
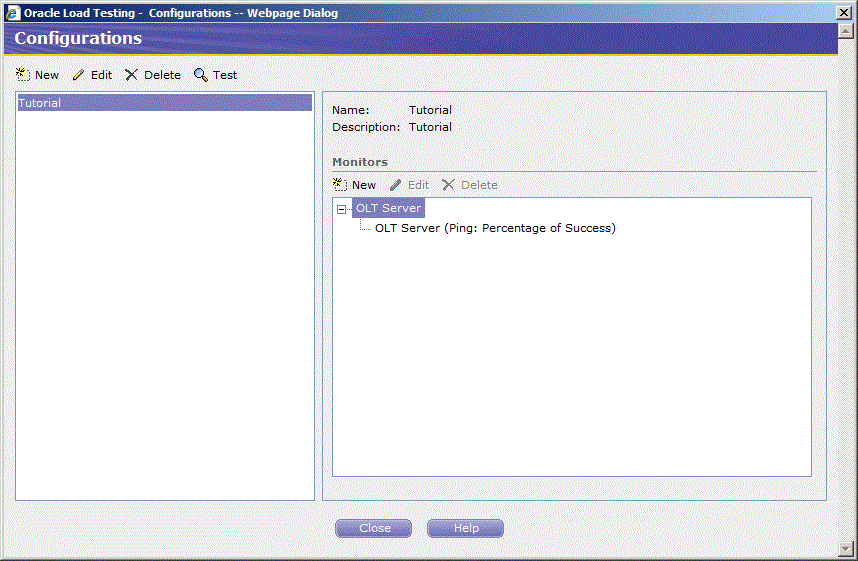
Description of "Figure 4-10 Configurations Dialog Box with Defined Monitors"
-
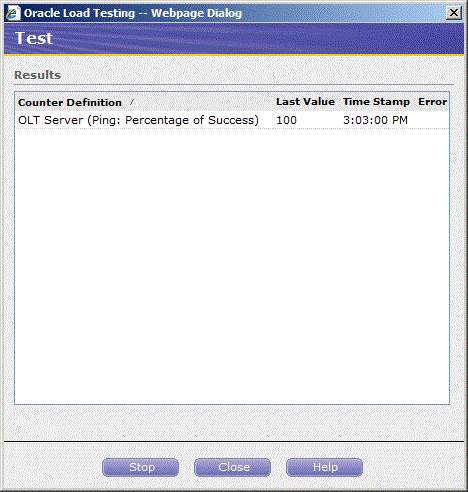
Review the results to verify the counters are working properly.
-
Click Close to exit the test results.
The next example explains the procedures for editing existing ServerStats configurations.
4.3 Example 3: Editing Data Sources
This example shows how to edit existing Oracle Load Testing ServerStats configurations to modify specific counters. The steps in this example are based upon steps completed in the previous example.
-
If not already open, select Configurations from the ServerStats menu to open the ServerStats Configurations window.
-
Select the Tutorial configuration.
-
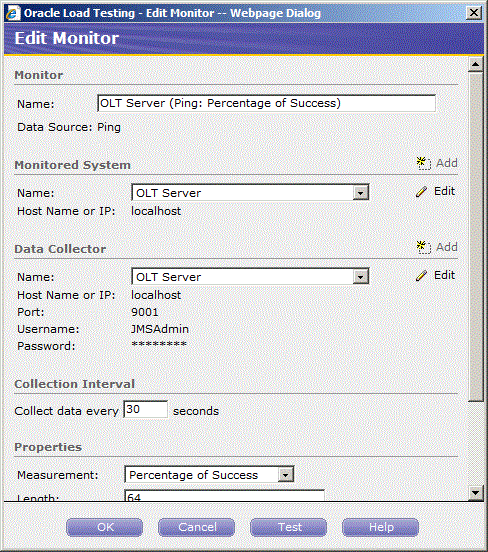
Click the OLT Server (Ping: Percentage of Success) monitor and click Edit.
-
Click Add next to Monitored System.
Figure 4-13 Add Monitored System Dialog Box
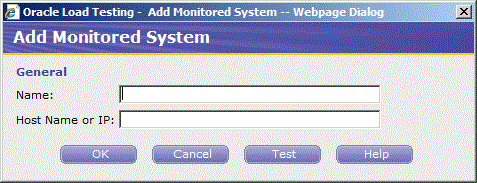
Description of "Figure 4-13 Add Monitored System Dialog Box"
If you have additional systems to monitor you can specify the information here to add the system to the ServerStats Configuration.
-
Click Cancel.
-
Click OK.
-
Click Close to close the ServerStats Configurations window.
See the Oracle Load Testing ServerStats Guide for additional information about using the features and options of Oracle Load Testing ServerStats.
4.4 Example 4: Creating a Scenario with Multiple Profiles
This example shows how to create scenarios with multiple virtual user profiles and how to set the attributes for each scenario. It also shows how to specify the reporting options.
4.4.1 Adding a Virtual User Profile to the Scenario
-
Click the Build Scenarios tab.
-
Double-click HTTPTutor2 in the Default Profiles list to add it to the Configure parameters of the scenario list.
-
Click the Configure all parameters button on the HTTPTutor2 line to display the Edit Scenario Details dialog box.
-
Change the #VUs value to 3.
-
Make sure the Virtual User Pacing is set to Recorded and the Maximum value is set to 10 seconds.
-
Leave the default settings for the remainder of the attributes and click OK.
-
Click the Configure Data Bank button on the HTTPTutor2 line to display the Data Bank Control dialog box.
-
Select the
avitek.csvData Bank file in the left pane under the script name. -
Select Each Iteration of Script as the Advance to Next Record setting in the Data Bank Settings section.
-
Click OK.
-
Click the Configure all parameters button on the HTTPTutor1 line to display the Edit Scenario Details dialog box.
-
Make sure the Virtual User Pacing is set to Recorded and the Maximum value is set to 10 seconds and click OK.
Notice that each profile in the Scenario Profiles list can have a different set of attributes.
4.4.2 Setting Reporting Options
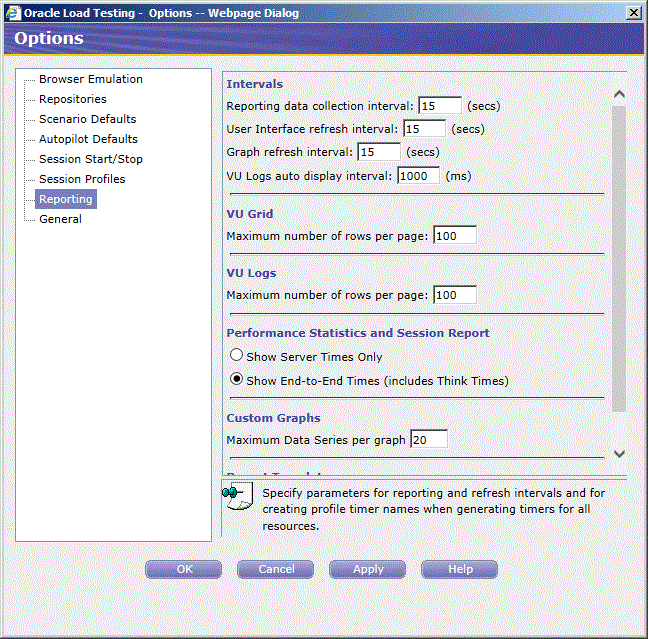
The data generated by a Oracle Load Testing Autopilot session is saved to the Oracle Load Testing database for post-session analysis. You can specify the reporting intervals and Virtual User reporting options in the Reporting options.
-
Select Options from the Tools menu and then select Session Start/Stop.
Figure 4-14 Session Start/Stop Options Dialog Box
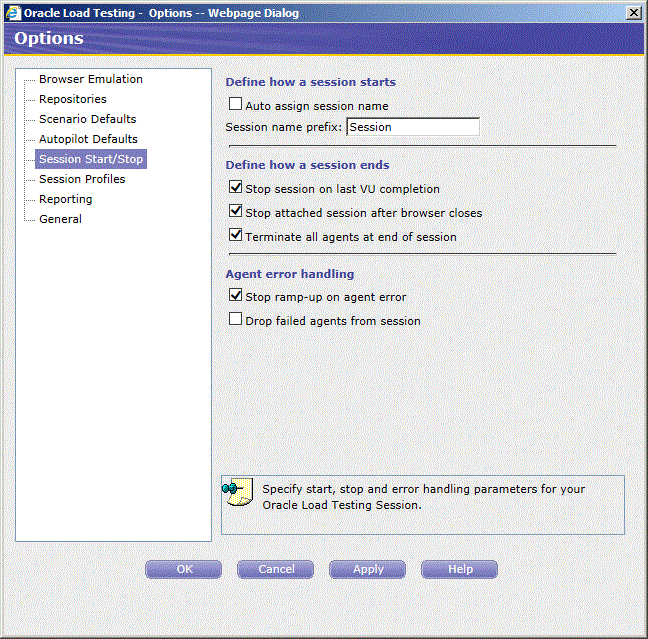
Description of "Figure 4-14 Session Start/Stop Options Dialog Box"
-
Select Scenario Defaults in the left pane.
Figure 4-15 Scenario Defaults Options Dialog Box
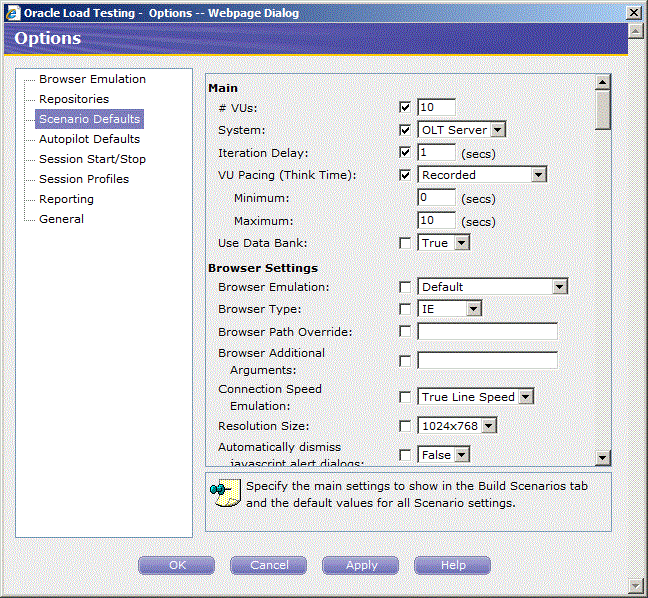
Description of "Figure 4-15 Scenario Defaults Options Dialog Box"
-
Set Message Delivery in the VirtualUser Logs section to Always.
-
Scroll down the screen and set Auto generate timers for all resources in the Reporting section to True.
-
Select Reporting in the left pane.
-
Set the Graph refresh interval to 15 seconds.
-
Click OK.
4.5 Example 5: Running Multiple Profiles
This example shows how to use Oracle Load Testing to run multiple Scenario profiles with different amounts of virtual users and how to view statistical and performance information.
4.5.1 Running the Scenario Profiles Using Autopilot
-
Make sure the Scenario from the previous example is still shown in the Build Scenarios tab.
-
Click the Add to Autopilot button on the Scenario tab or the toolbar.
-
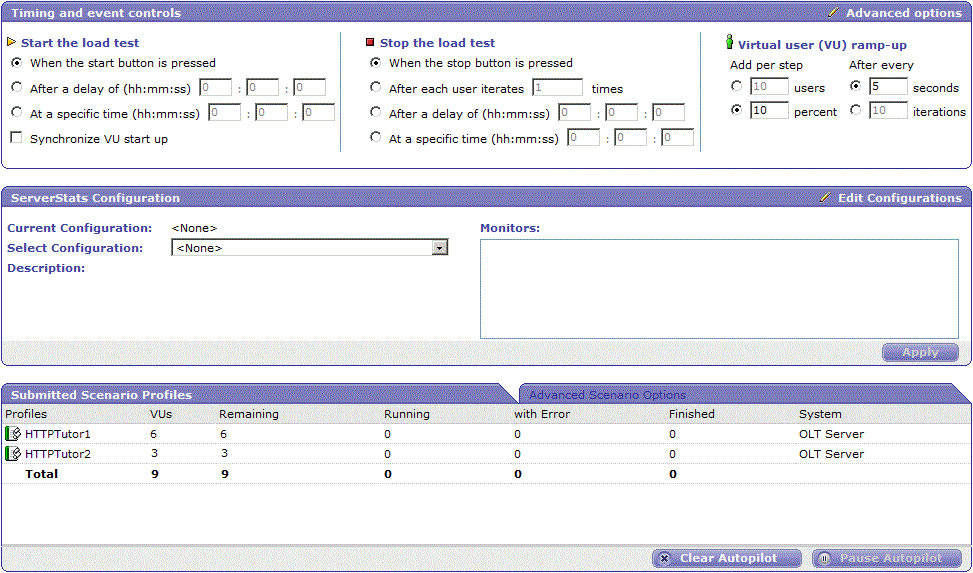
Oracle Load Testing automatically opens the Set Up Autopilot tab with the HTTPTutor1 and HTTPTutor2 Scenario Profiles listed in Submitted Scenario Profiles list.
-
Select When the stop button is pressed in the Stop the load test group of the Set Up Autopilot tab.
-
Enter 3 in the edit box next to # users under Add per step in the Virtual User (VU) Ramp-up section.
-
Enter 5 in the edit box next to # iterations under After every in the Virtual User (VU) Ramp-up section.
-
In ServerStats Configuration section, select Tutorial from the Configuration drop down list to add the configuration to the load test.
-
Click Save to save the Rampup Specification in the Scenario file.
-
Click the Run test button on the Oracle Load Testing toolbar.
-
Oracle Load Testing opens the Save Session data dialog box.
-
Click Ok.
The Save Session data dialog box appears because we did not use the Auto assign session name setting in the Session Start/Stop options. You can bypass this dialog box and use automatic or default values when running virtual users under routine testing conditions by changing the Session Start/Stop options (select Options from the Tools menu).
-
Watch as the Autopilot starts running the HTTPTutor1 and HTTPTutor2 scripts as virtual users. Notice also that HTTPTutor2 is playing back records from the Data Bank.
Initially, the Autopilot starts only three virtual users. After the first three have completed five iterations, the Autopilot starts another three virtual users. Once the second three virtual users have completed five iterations, the remaining three virtual users start. The Virtual User (VU) Ramp-up options of the Autopilot let you control the rate at which virtual users start running.
4.5.2 Viewing Performance Statistics
Oracle Load Testing automatically displays run time graphs in the View Run Graphs tab. Click the View Run Graphs tab to view the graphs. The graphs update continuously while the session is running.
Click on the Reports tab to view the Performance Statistics report. The Performance Statistics report shows a summary of the performance data for the running virtual users.
Figure 4-20 Performance Statistics Report
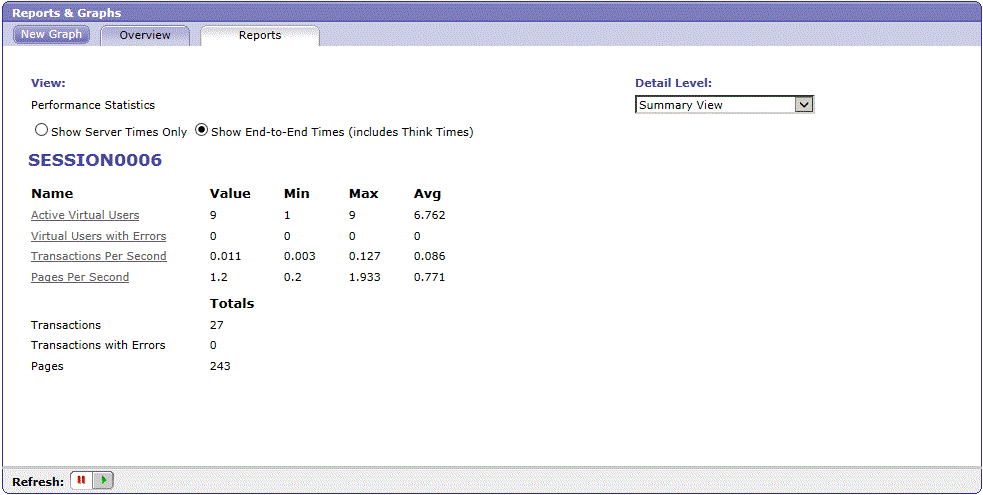
Description of "Figure 4-20 Performance Statistics Report"
The statistics show the values for the following performance categories:
-
Active Virtual Users - the number of virtual users currently running in the Autopilot.
-
Virtual Users with Errors - the number of virtual users with errors.
-
Transactions Per Second - the number of times the virtual user played back the script per second.
-
Pages Per Second - the number of pages returned by the server per second. A "page" consists of all of the resources (i.e. page HTML, all images, and all frames) that make up a Web page.
-
Hits Per Second - the number of resource requests to the server per second. Each request for a page, individual images, and individual frames is counted as a "hit" by Oracle Load Testing. If Oracle Load Testing does not request images from the server (as specified in the Download Manager), images are not included in the hit count. The Hits Per Second and Pages Per Second counts will be the same if images are not requested and there are no frames in the page.
-
Kilobytes Per Second - the number of kilobytes transferred between the server and browser client per second.
<Session Name> Totals
-
Transactions - the total number of times the virtual user played back the virtual user profile.
-
Transactions with Errors - the total number of virtual user profile iterations that had errors.
-
Pages - the total number of number of pages returned by the server.
-
Kilobytes - the total number of kilobytes transferred between the server and browser client.
Performance by Profile and Timer
-
<Profile Name> - the latest, minimum, maximum, and average performance for the virtual user profile in seconds.
-
<Timer Name> - the latest, minimum, maximum, and average performance for the server response timers in seconds. Server Response timers are added to scripts using Oracle OpenScript.
Performance by Profile and VUs
-
<Profile Name> # VUs - shows the time it took to run the virtual user profile with the indicated number of virtual users running. When ramping up virtual users, Performance by Profile and VUs values are added when additional virtual users start running. Once additional Performance by Profile and VUs values are added, the previous Performance by Profile and VUs values are no longer updated. For example, the statistics show elapsed time values for each profile for three, six, and nine virtual users. The <profile name> 3 VUs values are updated only while three virtual users are running. Once the Autopilot ramps up to run six virtual users, the <profile name> 3 VUs values stop updating and the <profile name> 6 VUs values are added and are updated while six virtual users are running. Once the Autopilot ramps up to run nine virtual users, the <profile name> 6 VUs values stop updating and the <profile name> 9 VUs values are added and are updated while nine virtual users are running.
4.5.3 Viewing Graphs
-
Click the Overview tab in the View Run Graphs tab.
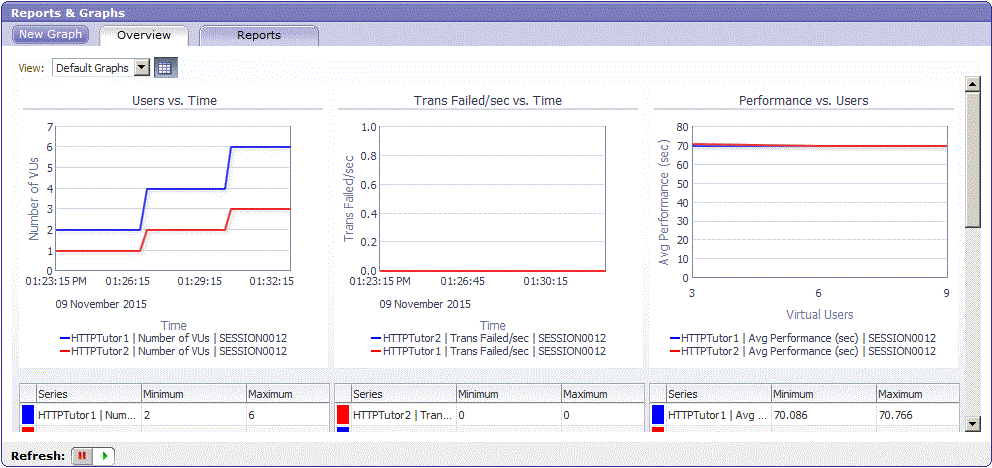
Oracle Load Testing provides several types of graphs that show performance, error, and statistical information for the running virtual users. The Overview tab shows a summary of the default graphs in a single view. Clicking the Show Chart Statistics button on the Overview tab shows and hides the data series tables for each graph.
Figure 4-21 Statistics vs. Time Report with Chart Statistics Table
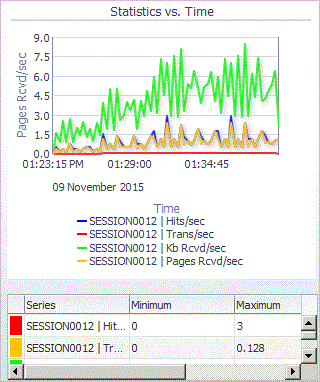
Description of "Figure 4-21 Statistics vs. Time Report with Chart Statistics Table"
Click on a graph in the Overview tab to view a larger image. Click the Back to Overview button on the right side of the graph to return to the Overview view of the graphs.
-
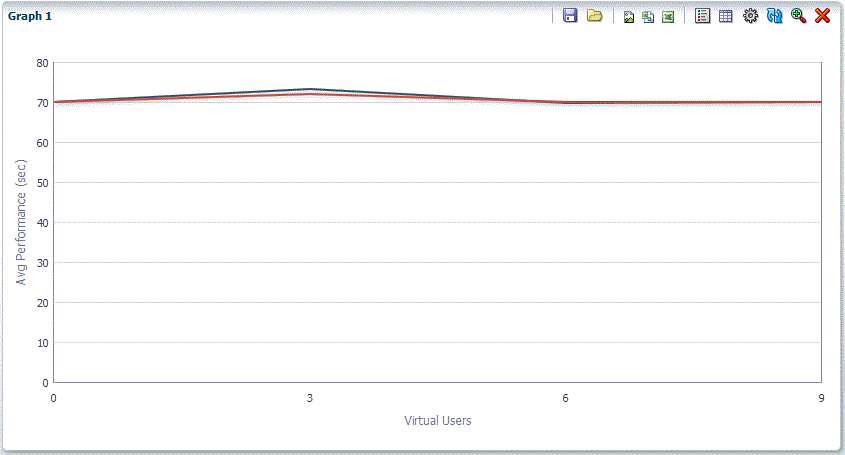
Select the Performance Vs. Users in the Default Graphs dropdown of the Overview tab.
This graph shows the average run time for the number of running virtual users in each profile. The plot points represent the Autopilot rampup of virtual users. In the above graph, the first plot points for each profile shows the average run time while three virtual users were running. Once the Autopilot ramps up to run six virtual users, the plot points for three virtual users are no longer updated.
The second plot points show the average run time while six virtual users were running. Once the Autopilot ramps up to run nine virtual users, the plot points six virtual users are no longer updated.
The third plot points show the average run time while nine virtual users are running. In this example, nine virtual users is the total number of virtual users the Autopilot ramps up to run. The third plot points will be updated continuously while the nine virtual users are running.
-
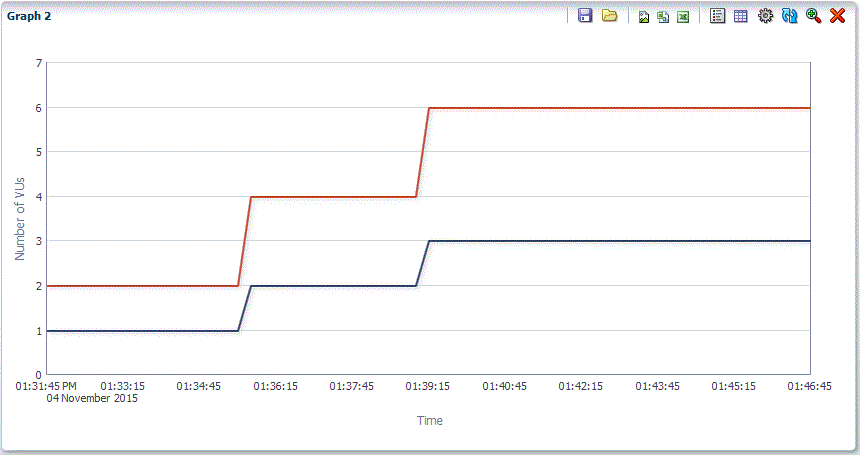
Select the Users Vs. Time in the Default Graphs dropdown of the Overview tab.
This graph shows the relative time when the virtual users for each profile started running. The graph represents the Autopilot ramp up times and the number of virtual users ramped up for each profile.
-
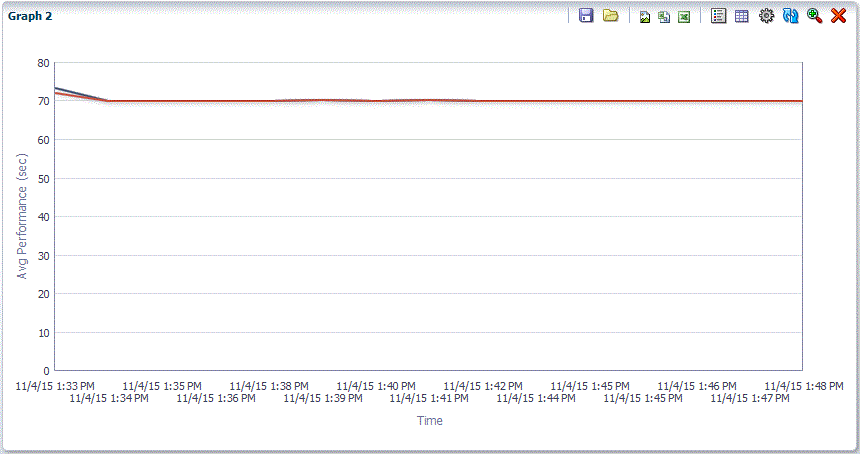
Select the Performance Vs. Time in the Default Graphs dropdown of the Overview tab.
This graph shows the average run time for the active virtual users running each profile over time.
-
Select the Statistics Vs. Time in the Default Graphs dropdown of the Overview tab.
This graph shows averages for virtual user hits, pages, transactions, and Kilobytes per second over time.
The error graphs show percentages of errors vs. virtual users over time.
4.6 Example 6: Controlling Virtual Users
This example shows how to modify individual virtual user attributes, view actions, and stop and abort virtual users in Oracle Load Testing.
-
Make sure the virtual users from Example 3 are still running.
4.6.1 Modifying the Run Attributes
-
Click on any virtual user in the virtual user grid.
-
Click the right mouse-button to open the popup menu.
-
Select Modify Run Attributes. Oracle Load Testing opens a dialog box for changing the run attributes for the selected virtual user.
Figure 4-27 Modify Run Attributes Dialog Box
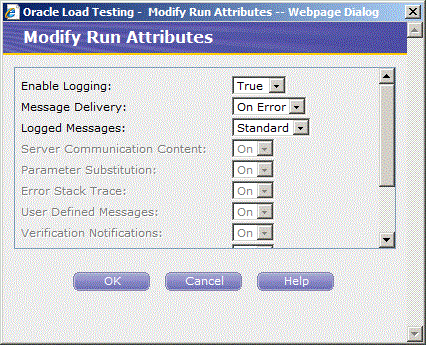
Description of "Figure 4-27 Modify Run Attributes Dialog Box"
You can change the attributes of each virtual user individually.
-
Click Cancel to close the dialog box.
4.6.2 Viewing Virtual User Actions
-
Select VU Logs from the Tools menu. Oracle Load Testing opens a browser window in which you can view the actions of the virtual user.
-
Click the Navigate to Previous Page toolbar button. The viewer shows only the previous page.
-
Click the Navigate to Next Page toolbar button. The viewer shows only the next page.
-
Click the Auto Mode toolbar button. The view shows new pages accessed by the virtual user as they arrive to the viewer.
-
Click the Stop Accepting New Pages toolbar button. The viewer stops accepting pages from the virtual user.
Note: Because of the speed at which new pages arrive in the viewer, it may take a few moments for cached pages to stop appearing.
-
Close the window to exit the viewer.
4.6.3 Stopping an Individual Virtual User
-
Click on any virtual user in the virtual user grid.
-
Click the right mouse-button to open the popup menu.
-
Select Stop. Oracle Load Testing stops running the selected virtual user. The virtual user will complete the current script iteration and then stop.
4.6.4 Aborting an Individual Virtual User
-
Click on any virtual user in the virtual user grid.
-
Click the right mouse-button to open the popup menu.
-
Select Abort. Oracle Load Testing aborts running the selected virtual user without completing the current script iteration.
4.7 Example 7: Generating Reports
This example explains the automatic report generation features of Oracle Load Testing. The data collected by Oracle Load Testing and Oracle Load Testing ServerStats while the Autopilot is running virtual users is saved to a database. You can use Oracle Load Testing to analyze the data and generate a variety of graphs and reports.
4.7.1 Generating Reports from Oracle Load Testing
This example shows how to use previously saved data to create custom reports and to view Session and Scenario reports. The Create Reports tab is used to generate session run reports after a session is finished.
-
Select the Create Reports tab.
-
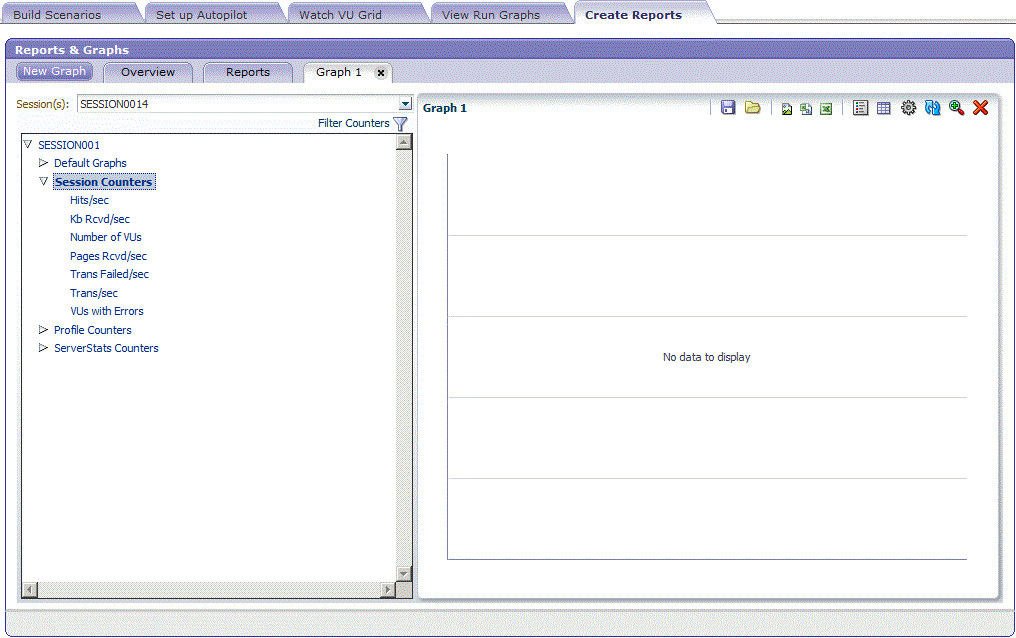
The Graph 1 tab is displayed with a blank graph. Select Session0001 from the Session(s) list. The data categories appear in the Available Data Series list.
-
Expand the session tree in the left pane, then expand Session Counters.
-
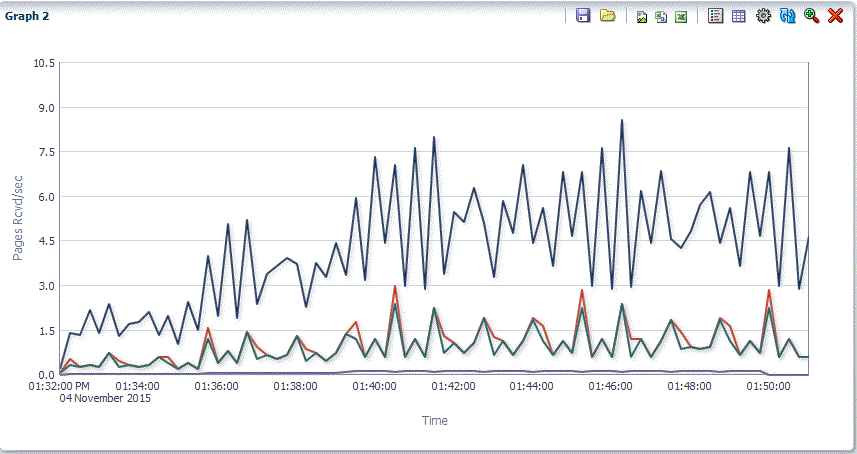
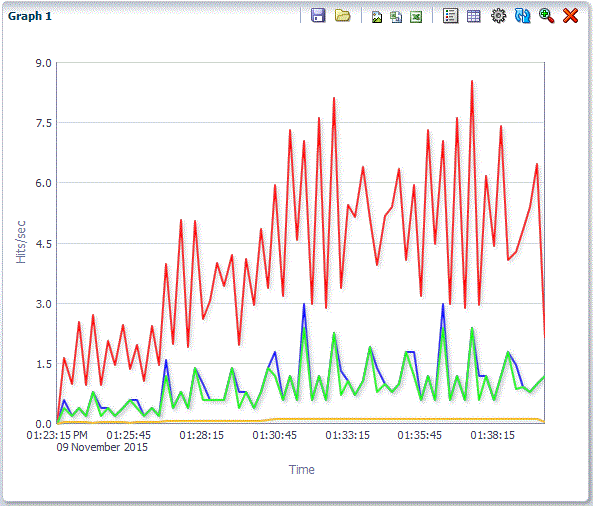
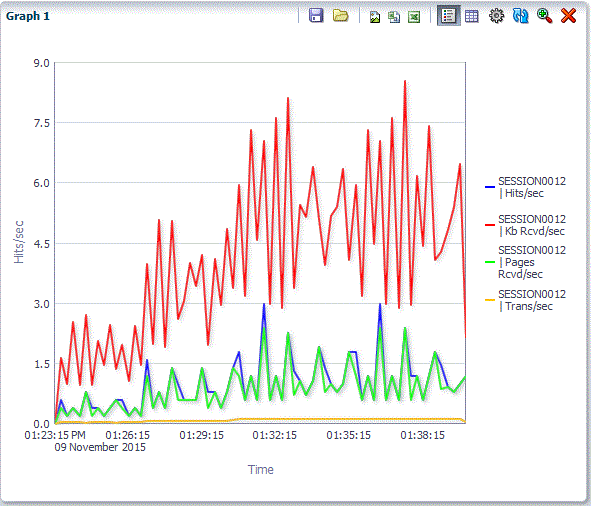
Double-click Hits/sec, KB Rcvd/sec, Pages Rcvd/sec, and Trans/sec in the Session counters tree to add the counters to the graph. These are the overall counters.
-
Click the Toggle Legend button on the top of the graph. The chart legend opens next to the graph.
Figure 4-30 Sample Session Report Graph Showing the Legend View
Description of "Figure 4-30 Sample Session Report Graph Showing the Legend View"
The legends show which color line represents which virtual user profile, script page, and Oracle Load Testing ServerStats counter. The legends for Oracle Load Testing data show the session, the virtual user profile, and the scripts page. The legends for ServerStats data show the session, counter object, counter instance and counter.
You can export the graphs to image files or the data to comma-separated value files and Microsoft Excel files.
-
Click the Options toolbar button and click the X next to a data series on the Graph tab and click Apply to remove a data series from the graph.
-
Click the Toggle Legend button again to hide the legend.
-
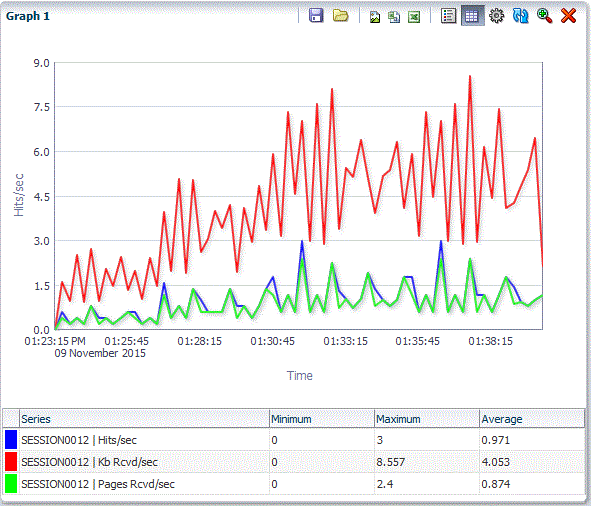
Click the Toggle Stats button on the top of the graph. The chart statistics table view opens at the bottom of the graph.
Figure 4-31 Sample Session Report Graph Showing the Chart Statistics
Description of "Figure 4-31 Sample Session Report Graph Showing the Chart Statistics"
-
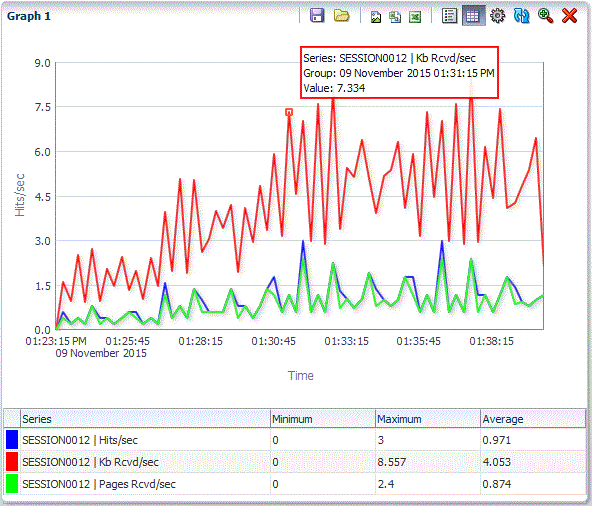
Move the mouse cursor over a data series line in the graph. The data point information popup appears over the graph.
Figure 4-32 Sample Session Report Graph Showing Data Point Information
Description of "Figure 4-32 Sample Session Report Graph Showing Data Point Information"
-
Click the Toggle Stats button again to hide the statistics table.
-
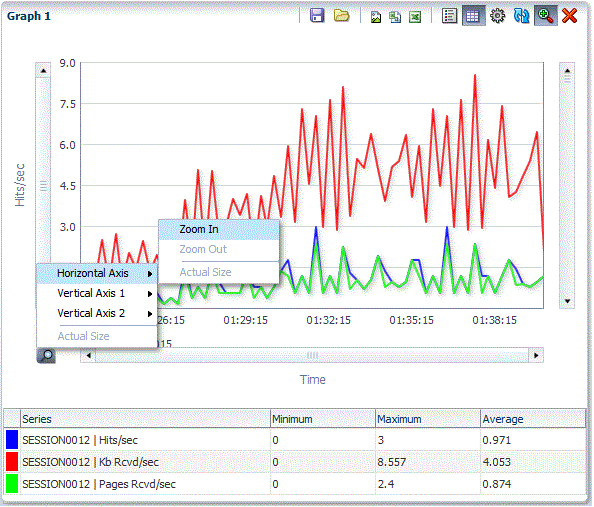
Click the Toggle Zoom button on the right side of the graph. Scrollbars and a magnifying glass appear on the graph.
-
Click the magnifying glass icon to open the zoom popup menu.
Figure 4-33 Sample Session Report Graph Showing the Zoom Tool
Description of "Figure 4-33 Sample Session Report Graph Showing the Zoom Tool"
You can zoom in multiple steps by selecting the Zoom In options repeatedly.
-
Select the Zoom Out options to zoom out one step. Select the Actual Size options to zoom out to the full graph size.
-
Click the Toggle Zoom button again to turn off the zoom tool.
4.7.2 Setting Graph Options
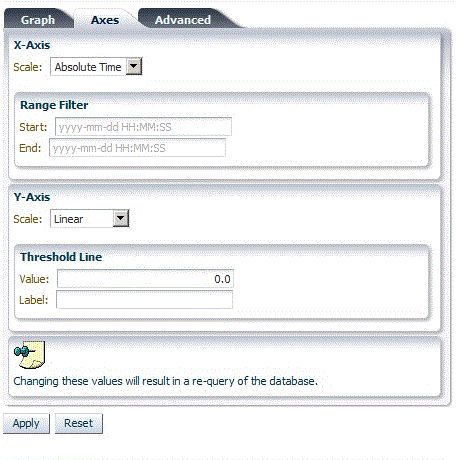
Use the Options toolbar button to set the title and the x/y axis options for the graph.
-
Click the Options button on the top of the graph.
Figure 4-34 The Graph Options View Showing the X/Y-Axis Options
Description of "Figure 4-34 The Graph Options View Showing the X/Y-Axis Options"
-
Set the graph title on the Graph tab and the and x/y axis options on the Axes tab.
-
Click Apply.
4.7.3 Exporting Charts
You can use the export buttons on the graph toolbar to export graph images and data to other file types.
-
Click the Export Image, Export CSV, or Export XLS buttons on the top of the graph to export the graph as an image, comma-separated value file, or Excel spreadsheet file.
-
Specify the file save or open options and select a location to save the data.
-
Use your image or spreadsheet application to open the saved file.
4.7.4 Viewing Scenario and Session Reports
The report shows the current and total performance over time for the Oracle Load Testing scenario. The report also shows the Oracle Load Testing scenario settings used for the session.
-
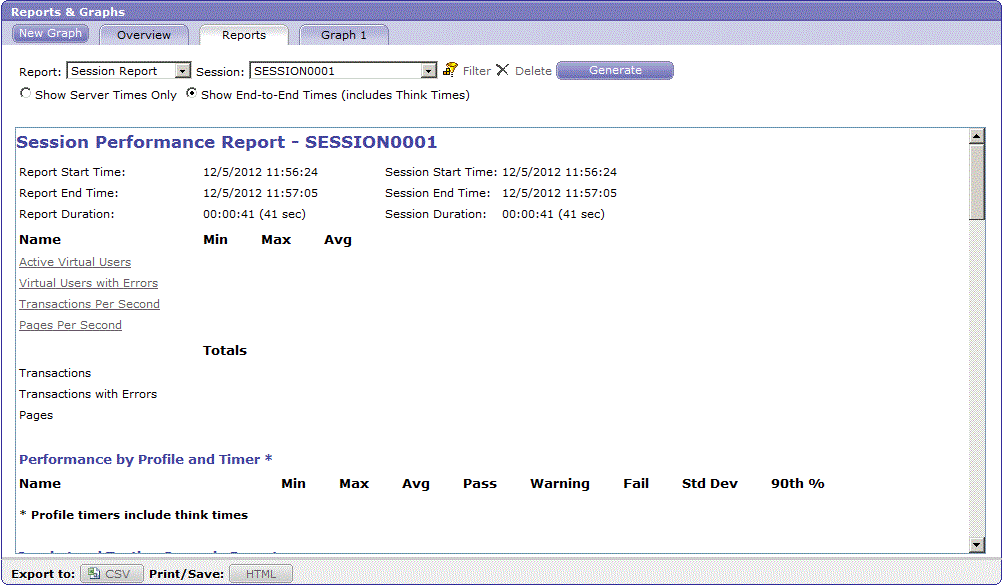
Oracle Load Testing also generates textual reports for Oracle Load Testing Scenario settings and Oracle Load Testing and Oracle Load Testing ServerStats session data.
-
Select the Reports tab.
-
Select the session for which you want to view the report from the Session dropdown list and click Generate. Oracle Load Testing displays the report.
Figure 4-35 Sample Session Performance Report
Description of "Figure 4-35 Sample Session Performance Report"
-
Scroll the Session Performance Report to view the Oracle Load Testing Scenario Report details.
-
You can print the report by clicking the Print/Save [HTML] button and selecting Print from the File menu in the browser window.
This completes the Oracle Load Testing tutorial. See the Oracle Load Testing User's Guide for additional information about load testing and using Oracle Load Testing.
